
With all the hysteria over climate these days, it makes sense to do a short introduction to cycles. I’m sure this won’t make much of a dent in the “war on energy” (and carbon, CO2, and humans, who breathe out CO2, which plants “eat”) that’s alive and well across main stream media, but it might serve as a resource for those of us who are attempting to live in reality. So, here goes …
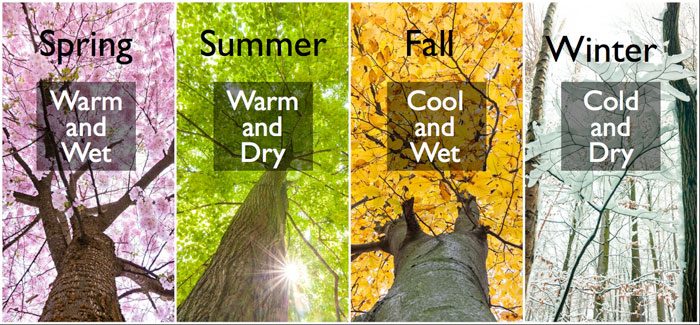
You’re well aware of the four seasons of the year. They represent a cycle. That cycle repeats annually, of course, and you can always expect the seasons to show up more or less on time. Sometimes, they’re a little late, sometimes a little early, and they’re not often exactly the same as the year before; they’re similar, but not a carbon copy.
The seasons of the year are part of an annual cycle.
Within the year, both temperature and precipitation trace out their own cycles. Temperature is high in the summer and low in the winter. Precipitation (rainfall, including volatile weather like storms) is high in the spring and fall and low in summer and winter, on average.
Summer and winter are the extremes each year in terms of temperature. Spring and fall offer the extremes in rainfall. When we transition between summer and winter, we get more changeable weather than normal — lots of storms, lightening sometimes, and generally volatile conditions compared to summer and winter, which are, by comparison, relatively stable.
There are longer cycles than seasons of the year. These longer climate cycles follow a similar pattern — spring, summer, fall, winter.
But there are also larger cycles. There’s a twenty-five year cycle and a one hundred year cycle, among others. These larger cycles follow the same pattern as the seasons. Warm-wet, then warm-dry, followed by cold-wet, and finally, cold-dry. Then they repeat. These larger cycles influence the seasonal cycles. So, if we have a warm-dry cycle that lasts twenty-five years, each of the seasons during that twenty-five year period will be warmer and dryer than normal. Larger cycles (longer in length) trump smaller cycles.
Likewise, when you get major transitions between climate cycles (hot to cold, for example), history shows us that you get volatile periods of climate in between. We’re currently transitioning over about 25 years from a warm-wet climate environment to a cold-dry climate period. You’re going to get the same volatile climate you’d experience with smaller cycles, although larger in scale, or course. That’s what you’re seeing around the world now (and since about 1998) — climate extremes and volatility.
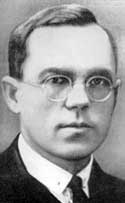
“The climate of the earth shifts from warmer to colder periods and back again, frequently in rhythms. History shows that nations are built on shifts from cold periods to warm, when the human energy level temporarily reaches a maximum. Nations crumble on the shift from warm to cold. International wars are mostly warm, civil wars cold. Each phase, warm and cold, begins wet and ends dry. Cold droughts and centers of civil war epochs generally coincide. A major cold drought and civil war period occurs about every 510 years; generally less severe ones every 170 years. There are also shorter rhythms. Totalitarianism is typical of late-half warm periods; democracy is revived during cold times.” — Dr. Raymond Wheeler, Ph.d, The Effect of Climate on Human Behavior in History
Patterns at Cycle Tops
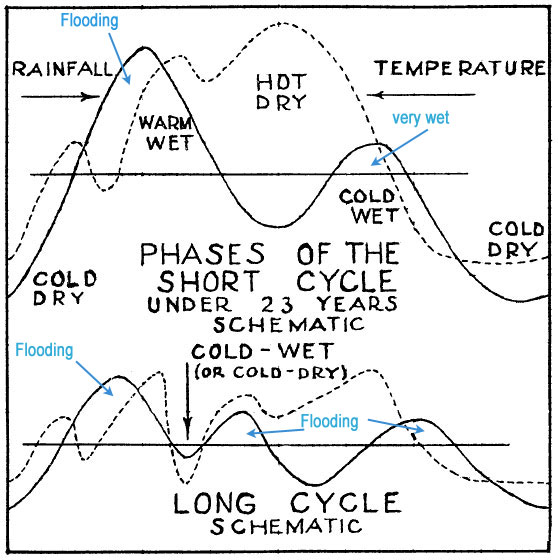
Above is a diagram (from the work of Dr. Raymond Wheeler Ph.d) showing a typical volatile transition periods between warm-wet and cold-dry climate cycles. The tops of these cycles follow roughly the same annual weather pattern we call “seasons”: warm-wet (spring), warm-dry (summer), cool-wet (fall), cold-dry (winter). There are always periods of flooding at the top of these cycles and they usually have a large negative impact on the food supply (we’ve seen this recently in the U.S.).
Dr. Wheeler on the top schematic: “The rainfall maxima occur during climatic shifts from cold to warm or warm to cold. If the greater of the two rainfall maxima happens to occur on the drop in temperature, there seems likely a generous sprinkling of warm years at the time. Usually on the shift from cold to warm, temperatures recover ahead of rainfall so that there may be a short hot drought at this time. A few of these droughts have stood out conspicuously in history and one of them occurred during the rise of Napoleon. The pattern as just described is discernible in fluctuations as short as 7 years, but generally does not exceed the length of a single sunspot period.”
Dr. Wheeler on the lower schematic: “If the warm and cold phases stretch the climatic cycle beyond the single sunspot period, “breaks” to the cold side occur as shown in the lower schematic. Here it may be fairly wet. The cold-wet phase occurs at a time when the long-time trend is a decline in both temperature and rainfall.”
At the temperature highs and lows of major cycles (like the 500 year cycle top we’re experiencing now), the human population gets emotionally agitated. This has happened throughout history, most recently in the 1970s when the concern was about an ice-age taking hold. The period of the ’70s was cold and dry, and resulted in a recession. A recession (or a depression) almost always accompanies a drop in both temperature and rainfall.
Cycles are literally everywhere: in the stock market, climate, our biorythms …
Cycles also appear throughout the stock market. Any stock market analyst knows that these cycles always go to extremes before dramatically turning in the opposite direction. It can often be just as emotional an experience as we’re seeing from the “climate change” activists who seem to be building a religion based upon their emotional reaction to this major cycle top.
This is a typical topping process. Where I am (Alberta, Canada), we’ve noticed a much colder winter and summer over the past year. We’re expecting an extremely cold winter coming up. In fact, as I write this, we are having our first snowfall of winter … in September! We wouldn’t normally see snow until late October, at the earliest. The times, they are a changin’. Fluctuations in temperature and rainfall are a natural phenomenon (and larger cycles are quite predictable).
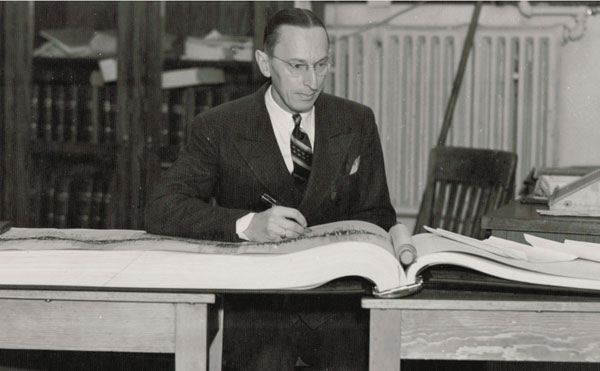
Dr. Wheeler with his “Big Book”
There are many traits of the warm-dry cycle tops like the one we’re experiencing now. Dr. Wheeler:
“Why should the major economic depressions of history be associated with excessive temperatures and drought? Why did the human birth rate and the animal birth rate decline during the excessively warm 1920’s and 1930’s? You will remember that the dictator nations tried their best to get the human birth rate back to normal again, but unsuccessfully, according to the testimony of their physicians. Why should all the known declines in human birth rate history have been associated not with wars, but with hot droughts? Why is it that conception declines with increase in temperature above a certain limit? The age of maturing girls in the southern part of the United States is on the average one year behind the corresponding age in the northern part.”
“Why should the great revivals in learning of good government, of genius, of economic and political aggressiveness, long rises in production, and the numerous other events of “Golden Ages” all come at the same time on the cycle along with increases in the birth rate in man and presumably in animals? Why, when decadence occurs, is it general and always associated with extreme temperatures? Why is stability of behavior associated with “optimum” temperatures and instability with excessive temperatures?”
Why indeed? But this has always been the case, throughout history.
Cycles That Impact Civilizations and the Economy
Now, let’s take a look at much larger cycles, spanning many decades, for example, 172 and 516 year cycles.
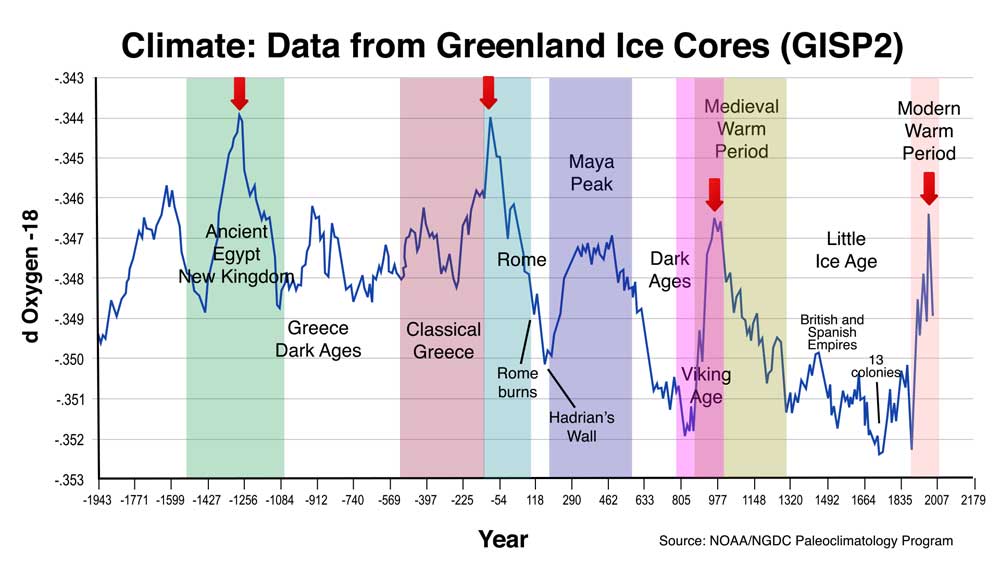
The data above comes from the National Oceanographic and Atmospheric Administration—from the Greenland Ice Core Research project ending in 1992. Ice cores are an extremely accurate method of determining temperature (blue line in the chart) back through the centuries. This data is undisputed by the scientific community, but has been suppressed by the UN-associated, man-made warming advocates. It also reinforces the findings of Dr. Raymond Wheeler in his research over fifty years earlier of tree ring data, weather records, military records, locust plagues, historical chronicles, sunspot records, etc.
The blue line that represents the major climate cycles, is a temperature indicator. Rainfall more or less follows the temperature pattern but creates its own fluctuating cycles in its own rhythm.
The red arrows on the diagram above mark large cycles of approximately 1050 years. The period from about 1256 BC to 54 BC had one extra 172 year cycle, so there can be fluctuations in overall cycle length, but they tend to be plus or minus one sub-cycle.
Major Cycles and Their Influence
 Here are the major cycles, with a description of their impact from the work of Stephen J, Puetz in his seminal work, The Unified Cycle Theory.
The major cycles are “harmonic”: Multiply by 3 to get the next higher cycle period.
1545 year cycle — This cycle is often referred to as the “Dansgaard-Oeschger” cycle by paleoclimatologists. It’s a cycle that has been reinforced by the Greenland ice core data — a climate cycle and major sunspot cycle. Peaks are considered golden ages, while troughs develop into “dark ages.” The most recent temperature low was in 1663 (a half-cycle low), while the next trough is predicted around 2436. The previous major full-cycle climate low was is 1891 (you can see this on the above chart). The lows of these cycles are characterized as “Dark Ages.”
1030 year cycle — The importance of this cycle (two 515 year cycles combined) is that it marks an East to West (and vice versa) power shift. Each successive empire develops on the opposite side of the planet. So, while the American Empire of the West crumbles, the East starts to rise in power. Expect the next big world dominating empire to be one of either India, Russia, or China. The next 500 year cycle top after that will be a western-based empire.
“There have been five 500-year epochs since the sixth century B.C. The first, third, and fifth belonged to Europe, as measured in terms of political initiative and aggressiveness. The second and fourth belonged to Asia. In the second epoch, Turkish peoples , Huns, and Tartars built one great empire after another, ending in Attila’s famous dominion. In the fourth the mongols ruled Asia under the Khans. The next epoch, the sixth, will belong to Asia in terms of initiative and aggressiveness. Signs of these forth-coming events are already obvious in the present behavior of the Asiatic peoples, including Russia.” — Dr. Raymond Wheeler
515 year cycle — This is referred to as the civilization cycle. New civilizations generally form 200-300 years before the theoretical peaks. Dominant civilizations at the peak tend to decline, the collapse, in the 100 to 300 years following its peak. You’re currently watching the start of the decline of the American empire. Supporting evidence for this cycle spans more than 5000 years covering empires such as: ancient China, Meso-America, Egypt, Greece, Rome, Medieval Europe, and modern Anglo-Saxon nations.
172 year cycle — This cycle is both a climate cycle and an economic cycle, always resulting in an economic crash and depression (and ushers in a period of civil wars). The theoretical top was in the year 2007. While we started a major crash, it was upended in early 2009 by the injection of huge amounts of debt by central bankers. While they’ve been able to delay the deeper collapse, Mother Nature always wins in the end; we’re expecting the balance of this collapse and depression to once again tip the scales to the downside at the end of 2020 or early part of 2021. This cycle occurs at the 171.4 year conjunction of Neptune and Uranus. The past four cycle tops (and economic crashes) have triggered exactly 14 years after the conjunction itself.
Kondratieff
57 year cycle — This cycle is known as the Kondratiev Wave, after the Russian scientist who made it famous, Nikolia Kondratiev. It’s also called the K-cycle, or “long cycle.” It subdivides into four parts and is associated with cycles in war, stock prices, credit markets, commodities, and economic depressions. Major depressions coincide with every third cycle (which is also the 172 year cycle). Lesser downturns often occur at the other two 57 year highs of the 172 year cycle. This is one of the most well-known cycles and is followed by many stock market analysts.
18.5 year cycle — This cycle is actually 18.3 years and contains a real estate cycle, exhaustively researched by Edward Dewey, even before he founded “The Foundation for the Study of Cycles” back in 1941. I sat on the board a few years ago as the Executive Director. The cycle has two parts, and is known to climatologists as the lunar nodal cycle, a period when the moon above the equator for half the cycle and then below it for the balance. It’s also a well-known rainfall cycle.
Smaller cycles: There are smaller cycles still. The seven year “feast or famine” cycle is extensively referenced in the Holy Bible, for example (It’s a rainfall cycle). There are shorter cycles of 3.5 years, 2.2 years … right down to 28 days (the moon). Ask any hospital emergency nurse or policeman about the likelihood that the full moon cycle influences our psyche is real, or not.
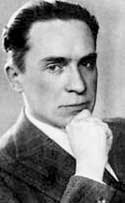 Alexander Chizhevsky, a Russian scientist, wrote extensively about the “excitability factor” in humans, which exhibited itself with every solar cycle top of approximately 11.2 years. You’ll find Woodstock and the Destruction of the Twin Towers in New York at the very tops of these cycles.
100 year climate cycle — a climate cycle. This cycle is has been extensively researched and written about by Raymond H. Wheeler. 500 year cycles break down into sub-cycles of about 100 years each. They may vary, though between about 80 and 120 years, but since the top of the Roman cycle, they’ve been fairly consistent.
Cycle Traits
Cycles have their own inherent traits that manifest themselves at lows and highs. The larger the cycle, the more pronounced these traits tend to be. We’re now at the top of the 500 year cycle, so you’re currently seeing extremes, but these extremes are nothing new. You’ll find them at work in the 1500s, for example, when humans also experienced similar traits. There was an historic financial collapse, as feudalism collapsed and we moved into the modern financial system of debt-fueled private banking.
And, in terms of social traits, they’re always more or less the same:
“Observers down through history agreed that warm-climate peoples were more prone to fanaticism, cruelty, tyranny and dictators. These phenomena have concenuated, all down through history, from the days of the Greek tyrants to Hider, Mussolini, and Stalin, during the warm phase of the climatic cycle. It is during these rimes, especially when they are dry and therefore hotter yet, that minorities suffer their worst persecutions, liberties are curtailed, and fascism and communism develop. Hitler is a typical hot-drought specimen! Socialistic trends — any form of shift from individualism toward greater state control and ownership — are warm-phase phenomena and, when extreme, are symptoms of decadence.” — Dr. Raymond H. Wheeler, Ph.d
Ring any bells in terms of the world we live in today?
Cycles of varying lengths and power influence every aspect of our lives on Earth. Never forget that we’re only a very small rock in a huge solar system (the Sun is 400 times larger than our tiny planet). We’re influenced every day by forces well beyond the nine revolving planets we count as our solar community.


Care to draw a schematic of the cycles please?
Hi Io,
There are already two schematics on the page that show cycles. A cycle is like a sine wave. You can see that pattern most easily on the schematic of the flooding cycle that is common at the top of major cycles of 172 years and 516 years.
On the coloured schematic, a cycle goes from high down to a low and then back up to a high again, for example, from one red arrow to the next. That’s one cycle.
Thank you Peter but let me rephrase: can you draw the schematics in a real timeline to understand where we find ourselves in 2021 for each cycle and into the future?
Per civilization cycles I found the Glubb cycle
http://people.uncw.edu/kozloffm/glubb.pdf
and David Murrin’s Arkent cycle http://www.davidmurrin.co.uk interesting as the climate cycles influence the rise and fall of civilizations