
 One of the first things President Trump did when in office was to require that for every new regulation brought into law, two more must be rescinded. The message here is that we’re grossly over-regulated.
Think about it. When do you hear of a law being rescinded? Almost never. Yet, with every new administration, new laws come about because that’s the primary goal of legislative bodies (politicians) — to create new laws. These laws have to be policed and so both governments and policing bodies grow in size and power, spending more and more tax payer dollars in the process, and making our life more difficult.
A result of all this over-regulation is that it takes more time and money to get anything done. It adds to the debt level.
The Law of Diminishing Returns
Yes, this a real law from the field of economics:
This law refers to a point at which the level of profits or benefits gained is less than the amount of money or energy invested. In everyday experience, this law is expressed as “the gain is not worth the pain.”
Joseph Tainter wrote a very interesting book in 1990 entitled “The Collapse of Complex Societies.” You’ll find on my books page. It describes all of the major civilizations and how they all got overly complex before they collapsed. They met their ends, as I’ve stated so often before, at 500 year cycles tops.
But the point is that when times are good (warm-wet and there’s lots of eat), we humans grow our societies like crazy, and as time goes on, they become more and more complex and finally collapse on themselves. We become more and more unproductive, weighed down by all the “stuff” we’ve created, without much thought to the bigger picture.
There are lots of reasons for collapses of civilizations; this is just one of them.
We have tax systems that nobody can figure out. You have to pay people just to figure out how much you owe.
To travel these days is a nightmare of TSA workers, rules for baggage, and additional seating charges that change constantly. I’m in awe of the British, though. Somehow it took them two weeks to get me my first British passport (online), and yet getting a Nexus card to go to the US a little bit faster took about 8 months and an interview at the airport.
Our cars are computers now and they continually break down. Often finding the problem is impossible; you have to replace the entire unit. My BMW motorcycle has a computer software upgrade every time I take it in for service. Some of these take 6-8 hours to upload!
We have air bags that blow up; we have computer monitors that fail (lol) and it’s more expensive to fix them than buy a new one (score one for pollution!).
Software companies are coming out with new versions in less than a year from the previous one and guess what: They’re finding them really hard to sell! That’s partly because we simply don’t want to learn a new program every month, to find out that there’s really nothing in it that will increase our productivity.
The Internet and GDPR
May 25 was the deadline for the new European privacy laws (GDPR) to come into affect. Of course, everyone left it until the last minute. True to form, the youngsters (most everyone is a youngster to me now) in charge of the internet don’t communicate the changes nor the possible side effects, so we website managers just have to wait for the outcome and deal with the consequences. It’s always a surprise!
Two weeks ago, it was my email. I had moved my website to a European service provider, who decided to implement some new procedures without telling anyone. The result was that I had to quickly (it took several hours for the entire process to work its way through the system) move my email to a US service provider.
It took me almost a half hour on the phone to get the European service provider to admit that they had made the change!
On Friday of this week, suddenly users of my site were not able to leave a comment. Everything was marked as spam. I knew instantly that this had to do with the new GDPR legislation and so immediately began a pre-planned procedure to move my website out of Eurpean territory.
That was a wise choice because calls to an overloaded switchboard of this European provider were never returned. It took 24 hours to complete the move and allow me to troubleshoot the actual problem. The culprit was a spam-blocking WordPress plugin that had been updated to be compliant with GDPR rules. The solution has been to “roll back” to the previous version (while I have the developer look at my site and figure out what’s conflicting — something that should have been done ahead of time, of course).
What’s every more frustrating is that these GDPR rules don’t really affect me, because all the information I collect consists of a real name and a pseudonym (a “handle” if you will). I don’t even retain passwords, because the technology doesn’t provide me access to them. And the requirement for people to opt-out of emails was a law that was passed in Canada two years ago (which has never been prosecuted — because it’s impossible to police, as for the most part, so is GDPR). But we all pay the price in lowered productivity.
We’re Out of Control
This is another sign of a cycle top. As a society, we’re simply “out of control.” Nobody’s thinking anymore. And quite frankly, people are getting to the point where they’re “mad as hell and they don’t want to take it anymore.”
So, for more reasons than just this, we’re going back to simpler times. It will impact everything. Even our music will become simpler. Look out for the coming ballads! I’ll be so glad for the change!
I don’t necessarily like where we’re going, but the current business environment is obviously “finished.” It’s simply unsustainable. The level of complexity is sometimes overwhelming and often illogical. I can’t keep up.
The underlying cause to much of what I’ve described is also economic, but having to do with inflation. Governments have inflated away the value of the dollar that companies are forced into lowering the work that goes into producing all these items and so they’re more cheaply made … overseas. We simply don’t have the money to put into research and development (or proper testing)( before we launch all this crap on what used to be an unsuspecting public.
They’re not so unsuspecting any more and so products stop selling. We spend most of our time yelling at the telcos, rather than getting our work done. However, the added stress is great for the drug industry!
Actually, yelling at the telcos can be fun, because you know they’re going to lose once you threaten to cancel.
There’s More!
I wrote a year ago about coming home from a trip to New York:
On Saturday, I went to turn on satellite TV and my remote control, which has been acting up for the past month, was completely dead. My conversation on the telephone with one of our national telcos took about an hour and a half, about half of it on hold. Three people later, I started to get some answers.
They wanted to charge me for a new remote, which they would send to me in about a week. I asked them to explain the logic of charging me for a failed piece of their equipment so that I could watch a service that I was already paying for monthly. I had to get elevated to a supervisor. Even he found a logical explanation a little difficult. I ended up getting the remote for free and they will credit my bill for the time that I can’t watch it (’cause I don’t have a remote). But I had to threaten to cancel to get their attention (which is typical these days). Deflation makes this possible. They’re so concerned about losing customers.
I also found out that one of my two internet services was completely down. It took me another hour to get hold of another telco just to get an appointment for a tech to look at it (again, I pay for two services, because one of them invariably has problems and goes down and, as a trader and market analyst … well … ). I’ve had so many problems over the past four months with this particular service that they told me they would “elevate the request to get a tech out today,” but I know that won’t make any difference … (past experience). It will happen when it happens … likely later on in the week.
My last run-in with this telco took 6 hours on the phone, two letters to head office (one by courier) and two and a half months to get resolved. I’d originally called them simply to upgrade the speed of my internet service. It’s a very long story from Hell.
I reflected on Saturday about the fact that four computer monitors have failed on me this year. My business telephone system quit on me a month ago and had to be replaced. On Friday, one of my two computers went completely dead in New York (I travel with two for that very reason).
Funny enough, none of this seems out of the ordinary anymore. I’m sure most of you have had similar issues (I hope not as many!). For me, the challenges just seem to go on and on.
Whenever I access the internet these days, something has changed (I use so much software and different services and they’re all competing to stay fresh and new). I spend more time learning where buttons have gone to than I do actually completing the task.
The world has become so complicated that we’re hitting levels of productivity in the private sector that I would expect from the depths of government … yikes!
This Trajectory Will Eventually Reverse
My rant has a bit of a purpose. Stay sensitive to what’s going on around you. There are terrific savings starting to come about due to deflation. It’s time to start threatening cancellation to get better and less expensive service. This is just the start of a process that will go on for the next several years.
Longer term, we’re going to start seeing quality going back into products, less regulation, more customer service (or maybe I should say “some” customer service), and less stress.
However, it’s going to take a lot of pain to get there. This is just a reflection on what I see going on around us. I think it helps to understand it all so that you don’t end up going totally insane in the meantime.
Elliott Wave Basics
There are two types of Elliott wave patterns:
- Motive (or impulsive waves) which are “trend” waves.
- Corrective waves, which are “counter trend” waves.
Motive waves contain five distinct waves that move the market forward in a trend. Counter trend waves are in 3 waves and simply correct the trend. These patterns move at what we call multiple degrees of trend (they are fractal, meaning there are smaller series of waves that move in the same patterns within the larger patterns). The keys to analyzing Elliott waves is being able to recognize the patterns and the degree of trend that you’re working within.
The motive waves shown above are typical in terms of their look and length. Subwaves of motive waves measure out to specific lengths (fibonacci ratios) very accurately. Motive waves are the easiest waves to trade.
Waves 1, 3, and 5 of a motive wave pattern each contain 5 motive subwaves. Waves 2 and 4 are countertrend waves and move in 3 waves.
Motive waves also travel in channels. The red channel above can be drawn from the apexes of wave 1 and 3 on one side and waves 2 and 4 of the other. The end of wave 5 typically meets the trend line on the wave 1 & 3 side before it reverses.
Countertrend waves move in 3 waves and always retrace. You’ll find much more about them in the countertrend section and the page on “The Right Look.”
To use Elliott wave analysis accurately, you must be able to recognize the difference between a trend wave (motive) and a countertrend wave (corrective). There’s very much more to proper Elliott wave analysis, but this gives you the basics.
____________________________
Registration for Commenting
Want to comment? You need to be logged in to comment. You can register here.
If you register, it protects your information. It also allows you to comment without filling in your information each time. Once you’re registered, simply go to the home page and click on the login link top right in order to log yourself in. Usually, you’ll be logged in for several days before needing to be logged in again.
______________________________
Problem receiving blog comment emails? Try whitelisting the address. More info.
______________________________
The best of them JL 2
The best of them …Last couple of years, I subscribed to several ‘market traders’. You are by far the best of them and the personal contact is awesome. Daily and daily updates are very well written! Besides your expertise in EW, I also like your cycles analysis. Best investment I ever made! —JL |
Couldn’t be happier … KK 2
Couldn’t be happier …The analysis and insight you provide is simply amazing! I’ve been trading the futures and equity markets for well over thirty years and usually average around 5% monthly. Since joining your Traders Gold Service two months ago, that number has better than doubled. I couldn’t be happier.—KK |
A true expert in Elliott Wave FL 2
A true expert in Elliott Wave …You are a true expert in EW analysis. What you provide is not available anywhere and is priceless. Subscription on your services is the best thing I have ever done. Many thanks for your effort to make me a better investor. I now have more trust in my investment decisions. I hope you will continue the excellent work! —FL |
Have not had a losing week RW 2
Have not had a losing week …I have been with Peter almost a year. The only thing that matters is have I made money with his service. I think I have finally turned the corner using Peter’s EW. I have not had a losing week in the last 5 months. Thanks Peter, for your amazing amount of hard work. —RW |
Rise above the rest … SM 2
Rise above the rest …I have only ever met a few people who, in their chosen fields (astrology, medicine, music, martial arts, technical analysis), rise above all the rest and you are one of them…you have ‘the gift’…and that’s why I’m a Trader’s Gold member. —SM |
the real deal SM 2
The real deal …‘Educational, insightful and thorough market analysis for all levels of traders. It’s Elliott Wave at its best….Peter Temple is the real deal’ —SM |
Tops in your field DZ 2
Tops in your field …You are tops in your field. Tried to follow Elliot Wave international for years. They were always behind the market. After discovering you, I perceive that you are an expert in reading the waves, which puts you way ahead of the rest of your peers. And you can read the Waves like you are reading tomorrow’s financial section. I pray you stay healthy. —DZ |
Get an upper hand … JC 2
Get an upper hand in trading …Seeing all the different currency pairs and the wave structures and hearing you explain why this has to do that on a nightly bases gives one a upper hand when trading. Elliott Wave applies to all stock and indices and can be applied to any candlestick chart. If someone ask what you want for Christmas – Tell them a membership to Peter’s “Traders Gold!”—JC |
The Market This Week
Here's the latest daily chart of ES (emini futures)
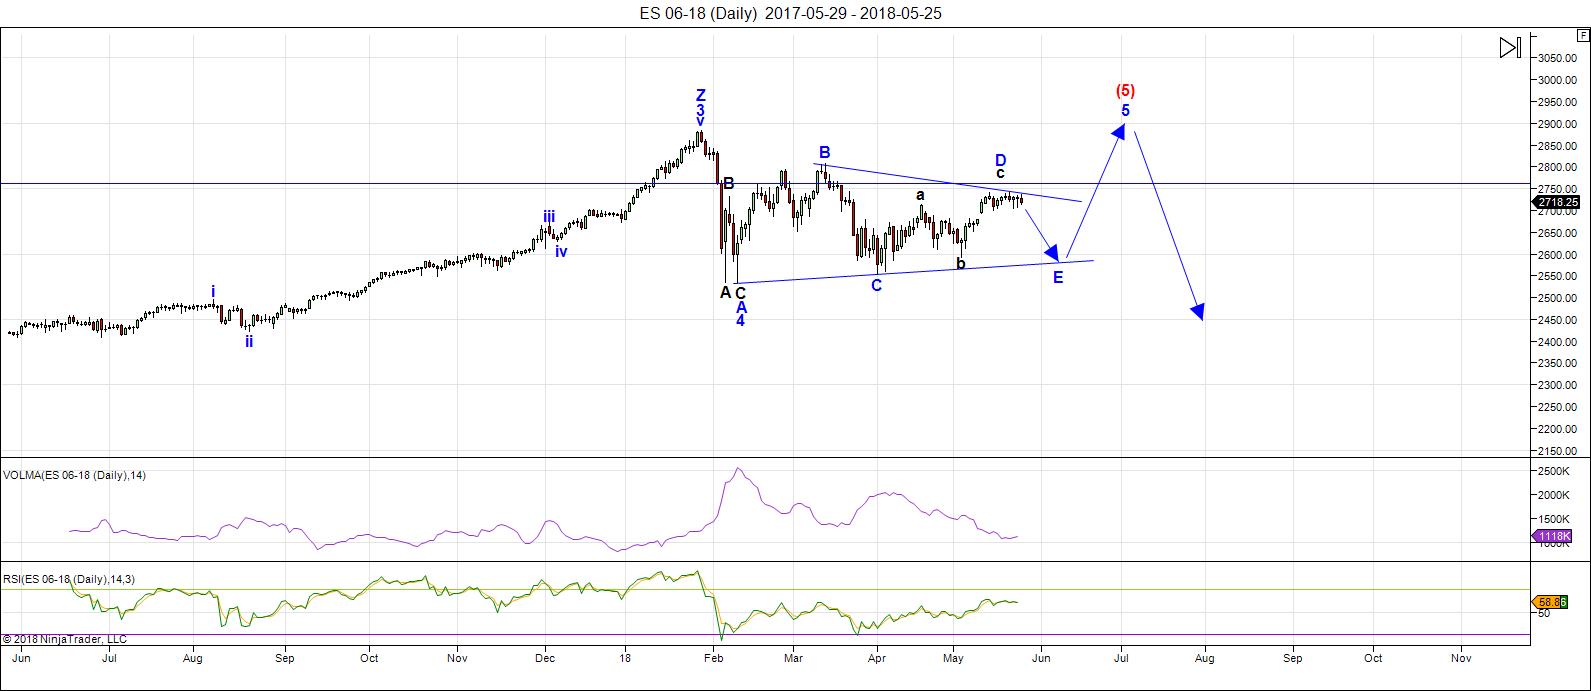
Above is the daily chart of ES (click to enlarge, as with any of my charts).
We've now being going sideways at the top of the D leg of the triangle for two weeks. This signals to me that the market is exceptionally weak and having a tough time making it to the required target. I'm expecting one more wave up to complete the D leg. We're either targeting the previous high or 2750.
Volume is exceptionally low, which contributes to the volatility and lack of momentum at times.
Once we hit the target, though, we'll head down in the E leg. The turn will have to be this week, because we're running out of waves ... lol.
After the E wave down is complete, we'll take off again to the upside in a fifth wave, which will simply finish off the pattern. We'll get to a new high and probably more, but don't expect (as I've been saying for a very long time) a large fifth wave that travels any great distance. (I think 3000 is possible but at the high end of the probability spectrum)
Summary: We're not quite finished the D leg of the contracting triangle. Topping out will result in a high probability trade to the downside (the E leg of the triangle) Once E leg (down) is complete, expect a final fifth wave to a new high. That fifth wave up to a new high will be the end of the 500 year bull market.
___________________________
Trader's Gold Subscribers get a comprehensive view of the market, including hourly (and even smaller timeframes, when appropriate) on a daily basis. They also receive updates through the comments area. I provide only the daily timeframe for the free blog, as a "snapshot" of where the market currently trades and the next move on a weekly basis.
______________________________________
Sign up for: The Chart Show
Next Date: Wednesday, June 6 at 5:00 pm EST (US market time)

The Chart Show is a one hour webinar in which Peter Temple provides the Elliott Wave analysis in real time for the US market, gold, silver, oil, major USD currency pairs, and more. You won't find a more accurate or comprehensive market prediction anywhere for this price.
Get caught up on the market from an Elliott Wave perspective. You’ll also get Andy Pancholi cycle turn dates for the SP500 for the balance of the current month. There’ll be a Q&A session during and at the end of the webinar and the possibility (depending on time) of taking requests.
All registrants will receive the video playback of the webinar, so even if you miss it, you’ll be sent the full video replay within about an hour of its conclusion. For more information and to sign up, click here.


Thanks for the update Peter
I borrowed this from Martin Armstrong’s blog
https://www.armstrongeconomics.com/international-news/rule-of-law/american-media-blocked-in-europe/
The American media companies such as Tronc and Lee Enterprises are now totally dark in European Union countries. Some of those sites include the Los Angeles Times, the New York Daily News, the St. Louis Dispatch, the Chicago Tribune, and the Orlando Sentinel. It appears that various American media have decided to simply block Europe entirely rather than risk that they may publish a story that will inspire GDPR to be invoked on them in retaliation.
Complying is expensive and the new law is certainly not pro-capitalism, that’s for sure. The developer of this plugin I use for spam has trouble with English, so this new version may not be viable. The plugin is great when it works, but the new version doesn’t. I will have to eventually find another solution. I spend way too much time trying to compensate for changes in technology an laws.
Gaps higher in futures used to be quite rare. This is at least the second one I have seen this month. They represent huge cash dumps! Somebody getting nervous? Perhaps they should.
It is even rarer to see futures gaps filled ahead of the opening, as is currently the case with Dow30 futures.
The bears have clearly thrown down the gauntlet….how will the banksters respond?
Hi Peter a very good story with facts we normally don’t think about. Its normal (?)
I did my best again and found out that 4 indicators correct eachother. Next weeks we will find out if its OK. I expect a lot of it.
This week down into wednesday and then up into Friday and then a decline??
Difficult week with a lot od disturbance fron, the ECB, FED, JOBS(2x) PMI.
http://www.prognoseus500.nl/
Joe, sorry for the delayed response to your comments on the a-d line vs. popular market indexes. I have great respect for your analysis, Joe, but you’re way off on this one. Your example pointed to Oct-Nov ’29 to April 1930 new highs in the a-d line unconfirmed by new highs in the popular averages. First, I thought I was one of very few people who has the a-d data back to that period and am curious where you got yours. Secondly, as the chart my link will take you to will show, there certainly were no new highs in the a-d line from ’29 to ’32. Does your a-d differ from the one I show on this chart? Please also give me another period when you believe the a-d went to new highs unaccompanied by the DJIA that ended up bearish. Here is the link to DJIA and a-d line from 1927-1932!
https://imgur.com/a/ILoMPTM
Peter G,
Hasn’t there been at one time where the A/D Line was not divergent at the high? Someone mentioned that. I do not have the data to confirm that! I appreciate and look forward to both your posts….and Joe’s posts.
At the very important top in December 1968, Ed, the a-d line did not diverge from the averages, at least not on a short to intermediate term basis. It reached a 14 month high (not all-time) on November 29, 1968, its highest point since 9-25-67 and on the same day both the S&P and DJIA closed at highs (the DJIA reached a fractionally higher close 2 days later). Those highs on the DJIA and the S&P lasted over 3 years, obviously an important high, but the far more important highs in December 1968 were the highs registered on the secondary stock indexes. The Value Line Composite Geometric Index topped out 2 weeks after Nov 2 1968 (so there was a minor negative divergence) but that top on the Value Line lasted for over 14 years! I have not found a time (and would be indebted to someone who did) that turned out to be bearish when the daily a-d line moved to new all-time highs while the popular averages were 5-6% below their respective highs. This has happened recently and though it would appear to be bullish on the face of it because the a-d is a leader, not a laggard, as noted above, I have not found a previous time in market history when the daily a-d was at new all-time highs accompanied by DJIA and/or SP 5-6% below. As to previous comments explaining why a-d’s personality may well have changed recently because of ETFs and interest rate related issues and other factors, I take that into consideration but I intensely dislike making excuses or rationalizations for behavior that has been historically predictive just because I don’t like the results…
Peter G it seems to me that the crux of your argument is not to disagree with A/D line’s being historically a leading indicator and signaling tops by diverging from major indices as they made new highs, but that you have never seen the indices lag new A/D line highs by so large a percentage off index highs.
Please correct me if I misunderstood.
If what I said is correct, I have two observations.
1. If the current situation with regard to the A/D line and the indices truly is unprecedented, clearly it has little, if any, predictive value.
2. Commercial shorts are now at their biggest net short position for quite some time at over 500K ES contracts.
One would not expect to see VIX trading at 12 plus under such circumstances.
It seems to me it is not so much folk wishing the market was saying something different, but rather the metrics we normally employ to decipher market signals may be no longer reliable….
Peter G,
Thank you for the thorough update! It is appreciated!
Try as I might. I can find nowhere an explanatipn for an A/D line making new highs while the iunderlying index does not. If you think about it is a statistical impossibility. People sometimes forget the A/D line most often cited is the NYSE and not the index its A,/D line is being comared to. NYAD is not currently at all time highs but conventional wisdom says it is direction and not actual value, that is important.
Peter G,
How would the “structured supply of listed companies (down from about 7800 in 1999 to 3900 today…plus a 17% reduction in outstanding shares…plus the influence of central banks and non-economic players)” per Doug Kass influence the A/D Line? Much of that quoted text came from Lance Roberts of RealInvestmentAdvice.com.
Maybe the answer is unknowable except in hindsight! However, the Russell 2000 is over 50% of the shares traded today! In 1999 the Russell 2000 represented 25% of the listed companies.
It seems to me that Indexing would almost certainly change the character of the A/D Line.
Peter T,
Above you had thought we’d have one more small move to your target.
Given today’s action do you think we’ve seen the top of minor wave D ?
Your thoughts would be much appreciated.
Harvey
We had a failure overnight … a surprise. No, we’re definitely in wave E.
And Maestro, the expected target? 🙂
Peter g
I cannot post my data at this time. I’m working
And my work is out in the ocean .
Without data my post is a bit irrelevant yet here it goes .
When everyone goes long and buys and buys yet the market index
Fails to make a new high that pattern that develops will appear
To be an ending diagonal yet the actual Dow will appear to be
A triangle . This is why I’m still questioning this triangle as being
Now in wave E as Peter just mentioned above .
Verne I won’t speak for Peter yet I’d say spx pokes below 2600
In wave E yet in doing so it will also keep the potential bearish triangle
B wave in tack. If so the Feb lows were wave A and we have
Been in a narrowing triangle ever since which would be wave B.
That would label a poke below 2600 ( a must be seen ) as wave D
Since these declines and rallies need to be 3 wave moves .
I must conclude we are in wave a of this minor a b c decline .
The next b wave high of this decline becomes the focal point .
The previous high we just saw is now the MUST HOLD level
For the bearish triangle to be valid . A poke below 2600 is also a must
Or it will signal something else is going on.
Yesterday being May 28 , I’ll consider the low to low to high count
As a valid signal . The new moon a couple weeks ago also a signal
Of a change of trend even if not perfect . Now though we are at
A full moon and wave A which needs minor B and C which
Must poke below 2600 on the spx. Since we are also coming to the end
Of a larger triangle be it from Feb or March . It is possible that
We see a further developing smaller triangle form which will also
Complete the larger form. The recent highs should not be broken
Regardless ( as I see it ) the daily RUT spx and Dow look to be in sync
Yet the nasdaq comp is holding up better .
Timing wise June 6-9 should be interesting . The next new moon
Is June 13. As noted before following the June 6-9 date the next
Major date becomes Sept 8 th ( this does not include other various turn dates )
2018-1932= 86 years exact in July .
The years 1889 1932 1975 and 2018 are all 43 years apart .
July 1932 call it Jan 1975 ( I don’t have the exact 1974 low date in front of me )
42 1/2 years does work if you look back from the 2007
Top . I don’t have the data to do the math and don’t have my notes.
We should not see new all time highs if this is a B wave triangle
And the recent highs are now the important highs.
Once 2600 on spx gets broken I’ll target what ever minor B wave comes
And since we may or may not be done with minor wave A down
It’s to soon to call it .
I am becoming increasingly more bearish and as noted above
My risks are noted. The recent highs matter as do the all time highs
That is the only valid stops at this moment .
Waiting until June 6-9 th before commenting .
Good luck everyone and thank you Peter for your time
And efforts .
Joe
Thanks Joe! Great info even without your data! 🙂
Joe,
Your post are always interesting and informative! It seems that your composite index of “all” the various indices that incorporate into it….has perhaps shown a glimpse of Peter T’s wave E or something more ominous if your Bearish triangle continues to unfold as you seem to expect.
Thank You for sharing your analysis and thoughts!
https://www.youtube.com/watch?v=qdBgMni0Tlc
not looking good world wide now.
Pete – any chance of explaining a couple of bond markets for us.
Red Dog, I go through TLT and TNX (20 year and 10 year) in the Chart Show (later today). They’re performing as expected …
Looks like we had a very brief E down. They are indeed known for their brutal reversals. Move back above 50 day bolsters bullish case imho.
I was a bit concerned that I exited the short calls of my spreads too early yesterday but I am glad I did. I am selling long calls on today’s run-up and waiting to see break-out confirmation before reloading.
Tepid volume and the brevity of the move suggests to me E not quite done. I think we go a bit higher to complete B leg of possible zig zag. I will be re-deploying bear call spreads on any sign of reversal tomorrow. Cheers!
For /YM & /ES, May 9 lows held. Perhaps, D is not done. So maybe a do-over to target Peter’s 2750.
Top of D already a bit high compared to B for larger contracting triangle I think.
There are some really strange things going on in the world of S&P500 technical analysis. How can an index A/D line be supposedly printing a new all time high on steadily declining volume, multiple negative divergences at recent highs, and a clear breach of a years long held trend line, now being back-tested? Something is rotten in the state of dem markets!
3 times i put in my comments and lost it
last time:
8-10th is a serious Low (Dutch Astrology) coeld be a deep LOW
even the 15-17th could be worse
http://www.prognoseus500.nl/
What happened to the low into Wednesday?
Not being critical, just curious about what you learn from incorrect calls.
Hi Verne, the indicators can’t predict a problem in Italy on Tuesday. But without Italy it was predict a hughe decline and on Thursday again. The Holiday and Italy made a mass of the pattern. Tuesday was a panic low. When that occurs I always sell my position and wait the rest of the week. A profit is made. 🙂
I closed out a few more short trades today including short calls on SPXL and SPY. Still holding a few more bear call spreads. We could see a start of the new month’s ramp tomorrow so I may have to beat a hasty exit from the rest of my short calls, lol!
Everything is looking corrective. The crowd is convinced we are on the cusp of a huge third wave up. We will see! 🙂
https://worldcyclesinstitute.com/the-500-year-market-top/comment-page-1/#comment-29966
https://worldcyclesinstitute.com/the-astounding-mr-elliott/#comment-29856
the SPX has moved sideways for two weeks…Andy Pancholi may have scored this time…
O.K., since I am a gunslinger by nature and this market seems to have as a strategy, to slowly grind to powder bull and bear alike, I entered a really gutsy trade today to take advantage of this stupefying train to nowhere.
I sold to open the SPY 273/273.50 bear call credit spread for 0.07 cents. One hundred contracts puts 700.00 dollars in my account and my risk is 5K if SPY closes above 273.50 next Monday and I hold options through expiration. Either the market continues to grind bulls and bears alike to powder with more sideways movement, it breaks the downside, or it breaks to the upside.
I really don’t care which. If an upside break is indicated and so far as I am concerned, that will be indicated by a move past 273, I immediately exit the short calls and hold the 273.50 calls for additional upside. Gutsy, but much better than directional trades in this go-nowhere market. Sell premium!
Lots of people make market predictions, few tell you how they are trading their talk….why is that? 🙂
Peter T,
What are the chances we see 2770 before we go down to 2600 or 2550. Will it invalidate EW counts.
Thanks
Bill
E cannot move above wave D.
If SPY closes above 273 will be rolling spread out one week. Looks like a bearish rising wedge with overlapping waves.
New high above 2733.30 negated E wave of larger triangle. I doubt D is continuing higher….
Peter T,
Do you think we break 2750 and go higher. Does today’s strength change anything.
Bill
Looks like indices may be setting up towards June opex highs.
June 15-17, new moon period.
Thanks Willem. We did get a good dive on Thursday so I was wondering if it was a matter of just tweaking your system…. 🙂
I can never remember whether new moons co-incide with market tops or bottoms, lol!
I guess I will have to take a run over to lunatic trade to get the skinny!
From Lunatic Trader
“Several studies found a connection between full and new Moons and stock market performance. Generally, stocks tend to perform better in the days around the New Moon, while price weakness is more frequently seen in the days around Full Moon. It was also observed that major market crashes have a history of happening about 3 days before a New Moon, typically in 8th or 9th lunar month in the Chinese lunar calendar ( = September or October).”
I am typically left scratching my head as he seems to make contradictory remarks about what happens at new moons…crashes or market strength? Both?
I see the market move up till June 15, we will have a slight pull back around June 9-10
If we are in a triangle, it is clear to me as one who has traded quite a few this one is not done. While the reversal off a completed E wave is generally sharp, any prediction of substantial upward movement prior to an E wave low is imho very problematic indeed. Just one man’s opinion. I trade what I see. I am certainly lacking in forecasting skills. lol! 🙂
Liz made a good point about option expiry
No comments from me for a few days though .
June 6-9 th date and June 13 moon plus option expiry
On ? Is it the 3 rd Thursday or 3 rd Friday of the month ?
I am way out of touch with a few models I plan on updating
Over the next week. One of which I have been running in my head
Vs running on a strict pattern . That pattern though is typically
Sideways and that’s why the June 6 date. The only reason
I’m calling it June 6-9 th is because I included the Bradley model.
My own work I intend to finish up yet basically the main
Bearish cycle begins in August- Sept .
A June 6 low targets a Sept 8 – 9 high and if so we enter a crash
Window. The problem with this year is despite the bearish cycles
The index’s have only paused and gone sideways .
Come Oct we begin another Venus bull cycle and come January
We begin a new 2 year bull cycle ( 2 year low to low hence approx
1 year of up ) . If this bearish cycle can’t break the market to the downside
Then when the bull phase kicks in the market will experience
A blow off to the upside .
I don’t want to get caught up in the decennial pattern
For years ending in 9 but next year has the cycles stacked up
As outright bullish . No doubt in my mind I’ll be putting
Money back into various sectors such as gold stocks and commodities
As well as individual stocks of other sectors .
For now though I want to see where the Dow sits come June 6-9th
And as I’ve noted previously I’m not going to become overly
Bearish or bullish.
Keeping my powder dry and dialing in the way count 1 swing at a time.
Verne I agree, this triangle is not complete if it’s actually
A true triangle .
Joe
Hi Peter, If we whipe out the panic low on the 29th (caused by Italy) we still could make the pattern. D= 4th, E= the 15th or the 18th and 5 is 11/12 july.
I don’t have any experience but my indicators support it.
http://www.prognoseus500.nl/
On monday I remove the pattern from the site.
This week starts to decline into Thursday/Friday and then up to 11/12 june.
Later Willem
Wilem may be right. The more I look at the pattern and price action, the I think the call I made for a completed D wave was simply wrong and D may have extended higher. Futures will tell ig Wilem is right..
A new post is live at: https://worldcyclesinstitute.com/underlying-market-weakness/
This website is for educational purposes relating to Elliott Wave, natural cycles, and the Quantum Revolution (Great Awakening). I welcome questions or comments about any of these subjects. Due to a heavy schedule, I may not have the time to answer questions that relate to my area of expertise.
I reserve the right to remove any comment that is deemed negative, is unhelpful, or off-topic. Such comments may be removed.
Want to comment? You need to be logged in to comment. You can register here.