
I hope nobody was thinking this was going to be easy! Cause it’s definitely not. This is about as muddy as markets get from an Elliott Wave perspective. Even cycles aren’t giving me a clear indication of where we’re going, other than the short term (tomorrow—Friday, July 24).
Short term, we’re going up. This is the last wave. How far we’re going up is the question. It’s a broken market, with various US indices in various stages of completion. So I’ll take you through each index and tell you what I see. I also ran a cycles analysis twice on SPY (SP500) and I’ll share the results with you, as well.
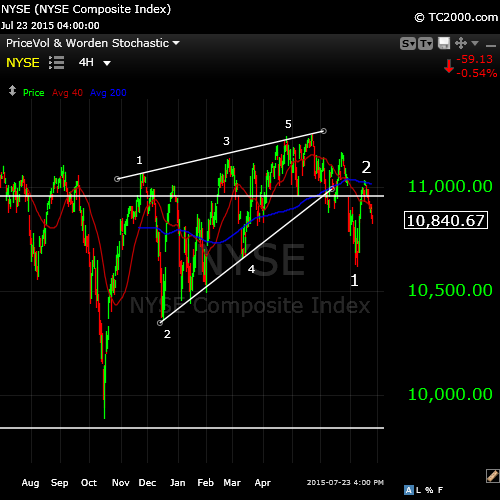
Here’s the NYSE (above)—what I always look at first, due to its size. On the four hour chart, I’m counting the cleanest ending diagonal of all the US indices (that look like they’re either completing one or already have). The last wave of the diagonal pattern is even sporting a double top. An ending diagonal consists of five waves, each wave in a three wave (abc) pattern. An ending diagonal is a final wave and so we should be in a downtrend if this count is correct.
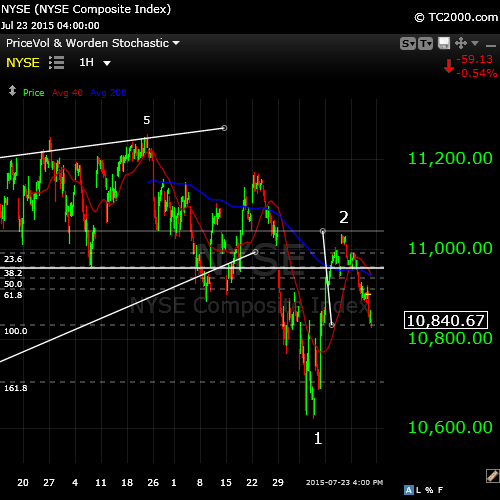
Zooming in using a one hour NYSE chart (above), you can see the most recent wave down (the start of the the third wave by my count). This wave down seems to be in five waves. If this is correct, we should retrace up only to the horizontal line (62%), which means the other indices will be somewhat limited in their ability to rise above the most recent high. If we go above that horizontal line by any great amount, this count is wrong and we could see a bit of a “blow-off” from the other indices.
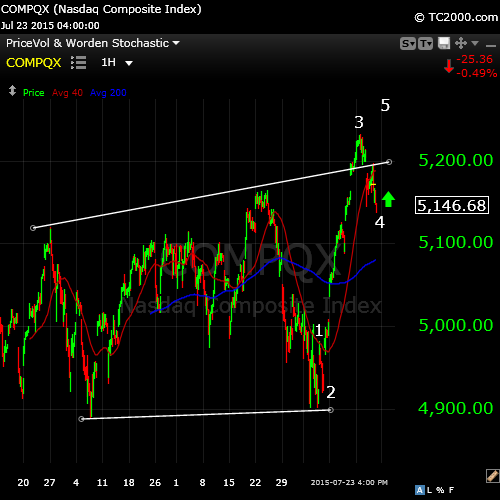
The Nasdaq is in the lead! There’s no question where it’s going. If this was the final wave of an ending diagonal, it would be in three waves. However, as I’ve said from the start of the wave, it appears to be going up in five waves, so it’s simply a fifth and final wave up. The most recent wave down is definitely in three waves and must be retraced. The final wave of a wave 5 pattern is typically is 1.6 times the length of the first wave. However, the third wave is an odd length and this brings into question the lengths of the other waves in this pattern. So the market is not giving us much to go on in terms of what’s in store.

The SP500 is similar to the Nasdaq in that this final wave is up in five waves (an ending fifth wave). The most recent wave down dropped exactly 38% which suggests that it’s a fourth wave. This means we should head up tomorrow (Friday) in a fifth of fifth wave to a top.

The DOW is the weakest of the major US indices and isn’t providing much of a clue as to how high it’s going, either. The most recent wave retraced down 62% Thursday and looks like it came down in 3 waves. That suggests we’re going back up to the top. What usually happens when the US indices top is that they all go up to a new high together so that they’re in sync when they turn down. However, the strength of the DOW isn’t as great as the others and so I question whether it can make it to a new high. Tomorrow is going to be an interesting day (which may carry over into next week).
Cycles Analysis Weighs In
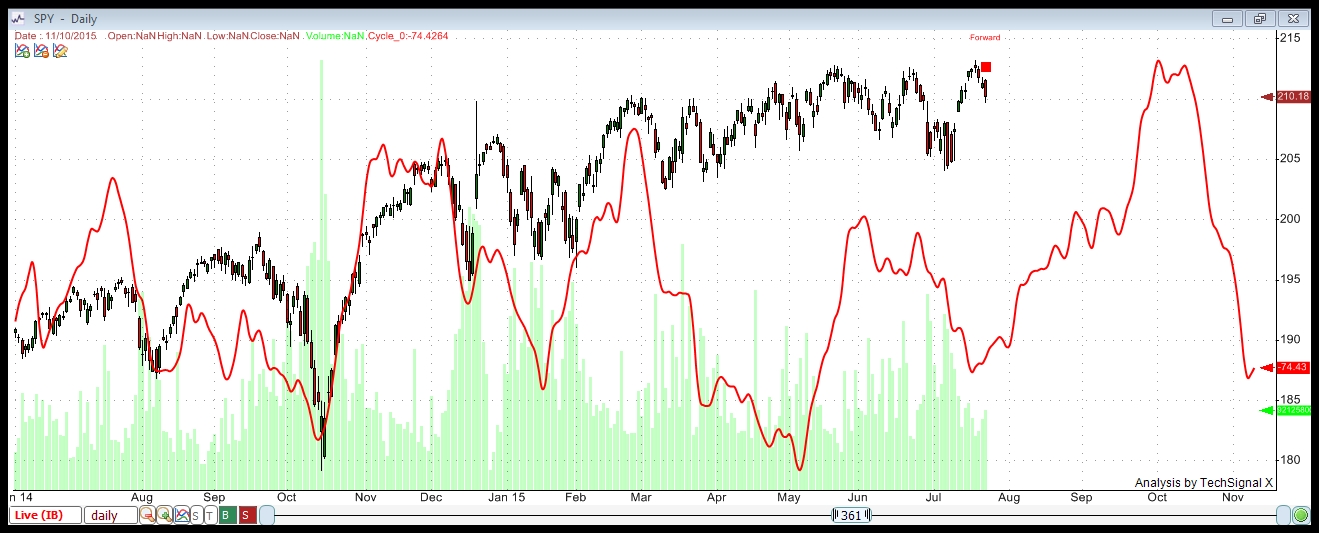
This is the first of two cycles I analysis I ran. I’m using data going back to 2002 for both. The software finds all the cycles inherent in this asset and then I typically order the resulting cycles by the highest number of trade wins or the highest percentage ROI over the entire period. Cycles repeat and so the past is a good indication of the future. This chart combines all the cycles found to provide a compilation wave. You can see how close-fitting it has been in the past. The summer, with its extremely low volume is not fitting as well.
This first chart uses all of the cycles found to project the cycle path forward. What concerns me is that we’re losing the window for this projected down cycle and it shown heading up at the beginning of August.
In any event, you see the dramatic drop starting in early October. The question is whether this summer cycle is strong enough to create a first wave down over the next couple of weeks.

The second cycle I ran is the same as the first from a data set perspective. The only difference is that I used only the top 8 cycles (by percentage wins) to result in a compilation wave. Choosing only the top cycles historically for this asset should provide a better forecast. The result is a forecast drop into September and then a rise into October. This down cycle is weak and therefore the probability is less than the following cycle, which shows a very dramatic drop starting in October. At least in that projection, there’s some consistency!


Nice analysis Peter. I am sure the dramatic drop in October will come. The trouble is what comes before that. My own cycle analysis (not curve fitting, but natural cycles) indicate that the market is increasingly weak. So I think the bullmarket is over. We could do a little consolidation into September but there isn’t energy enough to get a genuine w5.
The next few weeks should provide some answers and could do some serious damage to the long term perspective.
Tuesday another severe weakening in natural cycles.
We’ll see.
Thanks for the analysis.
André,
Looking much more like a bear market this morning. We came down just enough to hit some measured first wave targets. I think the NYSE side will retrace to a second wave, while the Nasdaq does a double top.
A little intermezzo on cycles.
The mayor problem with cycles is that the cycle period is variable. Mean reverting, but variable. Fixed cycles don’t exist. Many people make that mistake – not meaning you 😉 . That’s why I created an indicator that is adaptive. It analyses the cycle period with every bar. John Ehlers did a lot of sophisticated work on this.
When a cycle turns in sync with a larger cycle, it’s period grows and visa versa. This means the period can easily run from 20 to 40 bars.
This weekend I’ll do some long term analysis with this indicator and show it here. Just for fun.
I look forward to it. Thanks.
well,
No pullbacks just straight down Like the Daxi-Taxi….
I also follow Peggy on Sollar SHe has a good trackrecord with the spiral updates next bottom august 9?
But I think July 29/30 first
SPX not even 1,5% down from the top that is ridiculous … 10% we need as a mininum so looking at 1.980 for a start … that is about 7%
Hi all!
@Andre, I am also very curious about your analysis! 🙂
Don’t know if you guys even look at the AEX since it is just a Mickey Mouse Index with 4 stocks (Shell, ING, ArcelorMittal, Unilever) being boss for about 40%, but I see a low around 3-4 August. For now I think monday will be an up day (494,50 is my target, we are at 488 right now after market) and after that we will go back down hard 482 if you ask me. Maybe even a little lower 474. I will go long around 487,50 and sell on monday and wait a little to see where I will enter for a short position.
@John vd Meer, I guess you are Dutch too right? Do you also analyze the AEX and what do you see for the coming 1-2 weeks?
Greetings,
Wouter
I can’t edit my comment I see. Well my target should be 491,50 (38,2% retrace wave 4 of C down).
Greetings,
Wouter
Hello Wouter,
Yes I m dutch too I live close to Amsterdam I follow the markets from 1987 and I am a strong believer in cycles and astrology..
Curently I think we are in for a July/august Black Swoon … We are down till 29/30 July after that little up and from that point it depends how low we are I will look again I m short AEX with put options… And hope to be lucky like last year sept 21-okt16 But I never thought we could bounce up afterwards and lost it all…I followed Solar Cycles… so I had to learn again follow your own guts and system…
Cheers
Hey John!
It seems we live close to eachother (Utrecht overhere). When you started following the markets, I wasn’t even born, haha. I am from 1988. 😉
Just like you, I am a strong believer in cycles and astrology, I just don’t understand how astrology works (planet this opposit to planet that etcetera, I got no clue), I just use it in my analysis because I know there is a greater power that influences people (emotions) and makes us act (actions). I also see that people like Andre and Valley (on solarcycles.net, I wish he would just reply here) are a lot of times spot on. So I am convinced we are ‘being controlled’ by the planets, sun, moon etcetera. 😉
Thanks for sharing your idea John. I was thinking of a little up this monday and than sell short again till 3-4 August. Black Swoon doesn’t mean a lot of good I guess???
In the end I still see 520 (at first) coming for the AEX, the top isn’t in yet if you ask me. What do you think?
Yes you are so damn right when it comes to just do your own thing… However, if you know the right people (like people on this blog), you can be a lot more sure that there is good stuff being said and use that next to your own interpretation as well. 😉
Have a good weekend gents!
Greetings,
Wouter
I see there is some interest in cycles. So maybe a bit of background. Above I wrote about adaptability. But another concept is equally important : filtering. At any time we have an almost unlimited number of active cycles. Some long, some short. Some up, some down. And everything in between. Price reflects the average. But there is only one cycle we are looking for : the dominant one. I won’t go into detail about the code I use, but I can say this : without filtering and without adaptability there is no way you can find cycles. Looking at the most popular standard indicators out there – rsi/stochastics/macd – you can see the problem; they all use fixed periods (14) and only macd does some filtering (ema’s are filters). Amazing they are still in use, now everyone has a powerful personal computer.
My procedure for finding cycles is this. You can set your frames to use 1 day candles, 2 day candles and so on. Most don’t show stable cycles. So I just adjust the setting of the frames until I see stable cycles.
Tomorrow some results. At least you now know how I do this so you can see if it has any value to you.
Cheers,
André
Hey André!
Thanks for sharing, but this is still all hocus pocus for me. I like to see the results. 😉
Greetings,
Wouter
What the heck; why wait for Sunday. I’ll post my findings now so Peter has the opportunity to reflect on it from an EW perspective. All concerning S&P.
1) 80 bar cycle. Was up from early 2009 until mid 2015. (hard to pinpoint on 80 days). Want to remind you this is NOT an 80 day cycle. It is just a cycle I see in the 80 day-bar chart. Could run from 1600 td’s until 3000 td’s.
2) 39 bar cycle. Turned up in sync with 80 day early 2009 and has now completed 5 cycles up (and turning down)
3) 17 bar cycle. Did 7 cycles up from sept 2011. 7 cycles indicate an extension.
4) 10 bar cycle. Did 3 cycles with the last 17 bar cycle.
You’ll notice some kind of harmonic structure (roughly times 2). I didn’t look for that; it just emerged.
These cycles come from the market. But I also have a gravity cycle and a planetary cycle. The gravity cycle basically peaked by the end of 2014 but gave an inversion in February up into June 2015.
The planetary cycle saw a long term cycle turning down early 2014, but a shorter cycle was up from December into June 2015.
Let this sink in a bit. What are the chances that 3 different systems all say the same?
I said earlier that 20/7 was a very significant Gann timing. Seeing the weakening of natural forces, together with a synchronous turning of market cycles I can’t shake off this idea that the market did one last effort to test the major Gann date.
If this all would be right the bearmarket has started, probably into mid 2018. My own 19 year cycle analysis says it peaked in June 2015. I know I stand alone in this, but this is the best I can do. My 19 year time comes from the synchronization of the new moon cycle with the start of my Galactic year.
Short term analysis to morrow.
I would welcome any comments on this.
p.s.
My Dewey algorithm based on a 19 year cycle (unlike Dewey), starting from the 2009 low gives July 6th 2015. Yet another calculation is 177 days squared from the 1929 high gives June 13th 2015. 10000 times PI from the 1929 high (Armstrong) gives September 7th 2015.
No matter what I do; all timing tools point to mid june til mid July as a major time frame for a reversal.
Andre ,thanks for your effort putting all the information here on the site
And Peter thanks for your clear updates and pictures I m looking forward in the following up of the Barydyne chart (if you want to share of course).
And for Wouter becarefull with longs I almost never trade against the trend but still wait for new shorting possibilities .
For now I would now I think there is a good chance to see a repeat of 2011 top arround 20 Juli and bottom august 9…
I read this on Marketwatch yesterday and it makes sense to me :
http://www.marketwatch.com/story/this-ominous-chart-pattern-warns-of-selloff-in-bank-stocks-2015-07-24?siteid=nbsh
Nice weekend…
John,
The Barydyne signal is very similar to Bradley. It really only gives the turns. They’ve been trading with it for months but the results are only in the 50% range. I find my cycles software far more accurate and certainly much faster. I will post a link to Bradley shortly. I have more videos coming on cycles over the next few weeks.
Thanks Peter,
The bradley is making a lot of tiny switches in the near future but my gut feeling says stay short just like the sept 21-okt 16 2014 periode big moves up and down with a big sell off in the end …I think bottom short term August 5 or August 9 ….
Interesting is the view from Martin Amstrong for the month oktober he has a lot of accurate predictions.
http://www.prisonplanet.com/top-economic-forecaster-warns-have-cash-on-hand-to-survive-for-three-months-no-institution-is-safe.html
Great article Peter ! I have been following Mr Armstrong since the early 1990s. I have a very high respect for the man. His cycle work doves tails nicely with my own cycle work. Many cycles are at play right now, all pointing towards a very Topsy tury time. It will be a time, where both the bulls and bears will lose money due to the wild ride we are about to play out. Bottom line, Bulls and bears will make money, Pigs will lose out. Have a short and medium term plan and stick with it. As of right now, I am short the market. From (2110 sp futures) I have a combination Put options, leveraged ETFS. We may or may not have a upswing in the markets Monday. I am looking for a minimum 2045 before we head up a gain for a retrace. Than back down to the 1985 – 1945 sp level by some time in the middle of Aug at the latest. Another retrace back to the 2105 level before a 18 – 22 % correction in the markets in to the middle of Oct at the latest. All of the above is invalid if we for some reason we reach new highs ( HIGHLY UNLIKELY)
Please note, this is not investment advice. Use you own intuition in knowing what your next step is. All the best every one !
Sorry John, it was you who brought the Armstrong article to my attention.
Thanks, Dave.
Martin Armstrong was involved with the Foundation for the Study of Cycles way back when (which I also had an affiliation with) so I’ve heard the whole background story in detail. Once we get this next wave down out of the way, Elliott Waves will get very specific in terms of price levels, so I have high confidence in being able to pinpoint entries and exits once we’ve confirmed the downtrend, but we’re not quite there yet. I called the top on May 20 in the NYSE and I’m stickin’ with it … we’ll see 🙂
Hi all!
Wow André, really cool to see your analysis!!! If we indeed will not make a higher top in Europe, than I know one thing for sure: YOU ARE RIGHT, LET THE BEARS OUT! 😛
I have been thinking from mid 2014 that the bearmarket would start soon. Uptill now, I am so wrong, but that doesn’t matter cause even a bearish guy like me can still take trades long and short. 😉
@John, ty for the warning, I know it is a VERY bold move what I am trying to pull here. Let’s hope I can make a small move and than go back to shorts like you!
@Peter, when I look at your EW count, I see you having way different counts from my own counts. I must say, I have just started with EW (for about a month now, however really intensive), so you are probably a lot better than me with this advanced technique. All I would like to add is that the strange up move into 20 July, is a Wave 1 in my count. I’d say we are making a 2 right now, but again, you are way more experienced than me. 😉
Greetings,
Wouter
Let’s get it over with so I don’t have to spend my Sunday behind my desk.
Short term I’m inclined to change my forecast – with your permission. August 8-10 still will be an important turn window. But I think it will be a high. So next week is down – no doubts there- after a little pull up into Monday/Tuesday. And then down into 7/31 – 8/3. Then up into 8/10 and severe decline into 8/20-21. August 22 we have a full moon in the natal Nyse-chart and HC venus will be opposite Jupiter. August 27th we have a long term bradley date. Long term means outer planets, so +/- a week is acceptable. Given the general down trend I see it make more sense to expect longer down waves than up waves.
Hi André!
I am very glad that we both think that Monday there will be a little pull up. 🙂 I will sell my longs on time so that I can go full short again like John!
Looking at my time cycles, I fully agree with a low in 3-4 August. After that, I would like to see a Wave 3 up, but it will totally depend on how low we will go now with the down move that is doing its work right now. For the AEX I would like to see 482 (maybe an overshoot to 474). So we have different views after 3-4 August. I am very curious what will happen, fast forward the time please!!! 😛
And last but not least, THANK YOU FOR SHARING ANDRÉ, PETER AND JOHN. If the people in the world would all be sharing like you guys, what a nice place would it be hè? But hey, what do I know about stuff like this? I am just a ‘snotneus’ = little kid as they say in The Netherlands. Well I can tell you this, only 27 years of age and only 1,5 years very active in the markets does not say it all. 😉
Greetings,
W
PS: @Peter, I had to make a new Comment since the other one ‘timed out’ and I did not get it back. 🙁 This happens a lot, maybe you could look at this some time or is it just me?
Wouter,
I do have a cache plugin active on the site, but it shouldn’t affect comments. I haven’t heard of any issues from anyone else and I haven’t had any.
Yes, I expect we head up Monday in the US Monday. We look like we’ve done five waves down (almost – I expect futures to finish up Sunday). I’ll post charts on Sunday.
Hi Peter,
Let’s hope the drop down is over for now and we will go a little higher on Monday! 🙂 I am looking forward to your charts on Sunday!
Greetings,
Wouter
PS: I just read your post and responded within 2 minutes. Again I got this message: ‘Your request timed out. Please retry the request.’. So i pressed the ‘<–' button and I had to type my message again. 🙁 Yesterday when this problem occured, I just had to press the '<–' button and my message would still be there, but now…
I really love the discussions on this intelligent board. I’ve always admired Peter’s great work from your posts in solarcycles. And andre’s astro approach is second to none. So happy to see you two joining forces and I’m leaning a lot from you.
Curious to know your thoughts on gold/miners. It looks like the intermediate cycle has formed last week, and gold is ready for a bounce imminently. Not sure how you see it from the EW and astro perspective. Any feedback will be appreciated.
Thank you,
Erik,
You’re absolutely right about gold. I’m going to post a chart on GLD tomorrow. Both cycles and Elliott Wave forecast a bounce right now. It’s a countertrend move, but a good one that will last a while.
Hi Guys,
I don’t have the habit to contribute to the forums (may be because I’ve nothing to say), but this post of John Hussman is really interesting:
http://www.hussmanfunds.com/wmc/wmc150727.htm