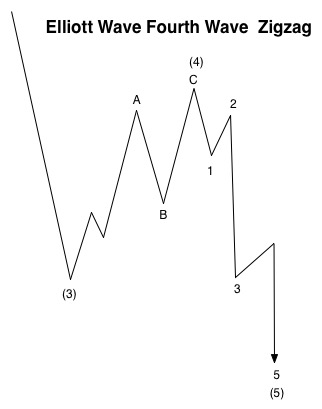
 The “fourth wave kiss” has to do with the face that fourth waves always retrace 38% of the path of the wave pattern so far, or to the previous fourth wave (of the third wave coming down). Let’s take a look ahead of the Fed meeting to see the market’s handiwork to date and gauge where we are …
The train is finally in the station.
On the charts below, I’ve presented the 3 wave path down (we have one more wave down to complete the pattern) and the long, drawn out 4th wave, which is an ABC corrective wave—certainly no question about about THAT! And certainly not a surprise.
However, it’s been a frustrating journey as fourth waves always are (the reason I like to stay away from them, in terms of trading). They always get to where you expect them to end up, but they do in in the most unpredictable manner!
Here are the time spans of all the waves in this first motive wave series down:
- wave 1: 5 days
- wave 2: 3weeks
- wave 3: 5 days
- wave 4: 3 weeks
- wave 5: 5 days?
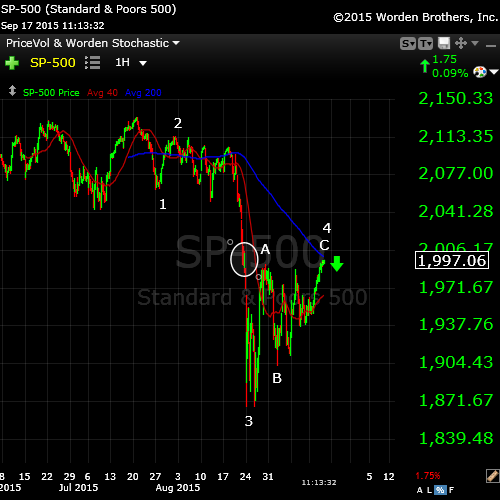
Above is the SP500. I’ve drawn in the circle to denote the previous 4th wave. Everything looks just about right for the 5th wave to come.
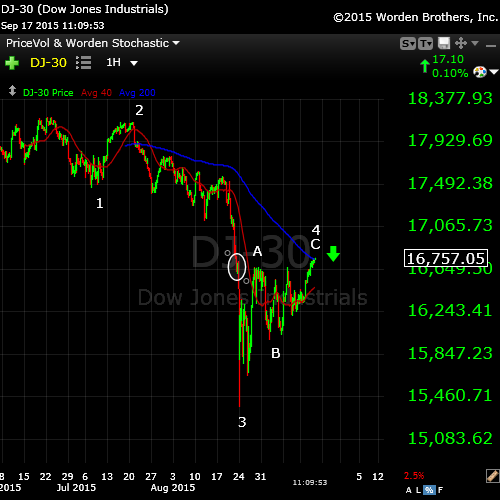
The DOW looks pretty much the same as the SP500.
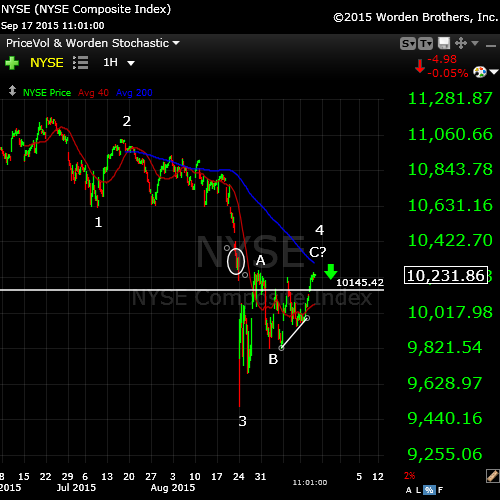
The NYSE is just shy of a new high in the ABC configuration. That’s why I’ve placed a C? marker on the chart. It has about another $10 to go before it tags the previous 4th wave high, which I would expect it to do before we head down into wave 5.
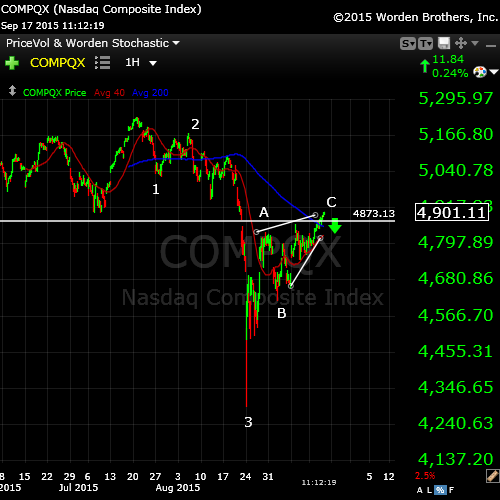
Finally, the Nasdaq has retraced all the way up to 62%, filling a gap. The rule in Elliott wave is that a fourth wave can retrace as far as it likes, as long as it doesn’t cross into the area of the first wave.
This also sets up the option of the Nasdaq only having completed a first wave down and having to go into a third, fourth, and fifth wave as the other indices complete the 5th wave. This option is not as likely as this being just a large retrace of the fourth wave, so I’ve labelled it as such. The horizontal line denotes the 62% retrace level.


Thanks, Peter,
very interesting.
I can’t imagine how Nasdaq will complete 3, 4 and 5 while the others should make only 5.
They move all together. The difference is only the amplitude
Well … think about it. It’s exactly the same pattern.
This is where things kinda break down. We’ve morphed into another wedge, which is a three wave pattern. When it stops, it stops. It will be a dramatic reversal.
So, the SP500 could get up to my original target of 2008 …
May be. They have taken out 2000 and chased the stops up to 2004.
Now with Fed it can spike up or down strongly
you weren’t bullish at $SPX 1900, but are feeling bullish now at $SPX 2003, you may be trading backwards…
Haha … certainly not bullish! I just measured. 2003 should about do it. We’ll see.
Well, no big surprise with THAT announcement!
You’ve got your 2008
Well, then … haha … my work here is done.
I measure 2003 for the SPX but yeah, could be quick spike.
There’s usually 3-4 fake out moves so take care.
Rates will never go up that ‘s killing for the dollar Europe has a big problem now and Mario have to throw money on the table…. the deadly spiral of currency devaluations continues..
I will go short tomorrow..
You’re smart. You should always get in the day after. I’m in early and will suffer some pain as a result.
The market has gone over 2020.
What’s your feeling?
Does it change the plan or it’s just a stretching?
This is what we call a throw-over in EW. An ending diagonal (or wedge) always has a spike at the end that dramatically reverses. This was more of a spike than I had planned for, but so far, nothing out of the ordinary … so far. I can’t see the wave structure down (too small), so we’ll see what happens. There’s usually follow through on the day, but the day after usually goes in the opposite direction (hence my comment to John).
It’s turning into a first wave down. We want to see a 62% retrace (wave 2) to really set us on our way …
Thanks, Peter, I see
I think this is the fourth wave of the first. In terms of timing, I’d expect to do the first wave down today and then let the market retrace overnight the 62% (so no gaps) and then head down from there in the morning. Pure speculation at this point.
We also could still put in a double top …
ES to a new low. Good. 🙂
This could be the end of a first wave down in ES so we could see our 62% retrace from here.
Peter,
I am really impressed and appreciate very much your job.
My only question is if the decision of FED was different the reaction of the market would be the same?
Does not matter what happens the market goes where it should when it is ready?
Thanks, Dmitri, for the kind words.
Yes, the market path is already predetermined. The market moves based on social mood (you can go look at my video “Puppets on a Sting”). If you think about Elliott waves and how they move in a regular pattern to specific lengths (more or less), you can understand the concept that events do not determine the market. Rather the market and social mood determine events.
So, to me, today was interesting from a Fed perspective (in terms of the decision), but I already knew the market was going to tank. EW told me that. And that’s why I can look at the larger picture and predict that the DOW will go eventually under $1,000. Because as we saw today, the fourth wave reverts to the previous 4th wave.
In 1974, the larger fourth wave of one degree lower happened (the 1974 recession). The market was under $600.00 at that point in time.. This bubble we’re in should eventually take us back to the previous 4th. Initially unbelievable, I know (when you first start to learn EW). But I’ve seen this work over and over again …
The really interesting thing to me, that I will include in a video in the future, is the ratio of the distances of the planets to each other. They average out the 1.618. We live in a world that’s like a German clock.
Concerning the forth wave that you’ve drawn in the circle to denote the previous 4th wave on the SPX chart, it is between 2010 and 2030.
The market has spiked today right in the middle of this area to 2023
That’s interesting. I hadn’t checked the numbers that closely. It either reverts to 38% or the previous 4th, but has to go at least 38%. In EW lingo it reverts to “the area of the previous fourth.”
My last note of today, as I’m out later: I don’t really like the look of this first wave down (it kinda looks like 3 waves – the fourth wave is way larger than the first). We could go up tonight test to top. It’s either that or 62%. Tomorrow should be a nice, negative day.
Peter,
tomorrow is four witches day.
So, they may contribute to the volatility
In SPX there is a small first wave done from the top of 8.5p., which was retraced by 4.5p. (not enough?), that was followed by huge third wave of 32p. in five waves
Just being cautious.
We have a first wave down forming. ES should go to approx 1947 and then bounce 62% to the fourth wave again and then we’ll head straight down. The bounce will happen after the bell so we get rid of the gap.
Peter
Do you mean 1947 SPX or ES Dec ?
ES
Don’t you think that they may do the same like Monday 24 of August?
But we’ve touched it already at the open
Well I had al lot of doubts.. but this is one of the trading rules of Paul Tuder Jones..
Turbo cycles has a turn tomorrow..
So Peter,
Tomorrow in the morning European time futures have to be higher a good time to short the AEX ans DAX… euro dollar moving up fast… ?
62% level for the eurodollar is 1.148. Not saying it will turn there, but it’s a likely turning point. Otherwise, it goes to the top (previous high) and maybe a bit beyond – to the 38% retrace line from the very top.
DOW broke the low. A good omen.
GLD up another buck.
A good start, I’d say. Until I see a second wave, I can’t really give any price projections.
As I warned earlier, watch out for the fake outs. I still have the 1985 SPX shorts
Good Luck every one.
Peter, you nailed that pivot point 1947 spx for a bounce.
That’s Elliott wave.
Now we bounce 62% and we’ll turn down in a third wave. Off to a meeting …
What is the target for the bounce?
Should we count 62% of the wave from the very top at 2022 ?
Yes. In SPX 1999 or so.
We’ve retraced 62% of today’s wave down from the high of the night and turned down now.
May be we’ve done the first yesterday, then the second during the night and now we’ve finished 1 and 2 of the third.
Peter, what do you think?
I’ve already told you what I think.
Sorry, Peter,
just wanted to have your opinion on the alternative count
I don’t have an opinion on it. It’s not a valid EW count.
Dmitri,
First wave down. https://worldcyclesinstitute.com/first-wave-down/
If we hit a new low or this otherwise become invalid, then I would look for an alternative. Until then, this is the pattern I see.
Dmitri,
Now my count is having an issue on the SP500 and it’s come down in 3. We might be heading for a much longer first wave down.
We’re still in a first wave. Until I see more, I can’t give a downside target, but I’d expect us to keep on truckin’. Everything’s following the SP down.
If 199 is more or the less the SPY retrace target then aAt the rate we’re going we might get the 199 near the close, just a tad bit below the SPY 200 strike which has the most number of OI for calls & puts for today’s expiry.
Liz,
I’m seeing 200.15 or so as the SPY target. You’re right about the speed. EW isn’t good on predicting timing, just price. I’m leaning towards this bounce lasting right through Sunday. If that happens, Monday morning will be a GREAT short. 🙂
Thank you, Peter, it’s clear now.
I’ve just seen that alternative count like the probable one if the market takes out today’s low
Dmitri,
If you know EW rules, you know that a second wave must retrace at the very least 38%. The futures have not done that. Therefore, we are in a first wave. The cash indices have, but they SHOULD all move together. The most recent wave down in all the indices is in three waves. So we need to see how this plays out.
The most recent bounce in the indices didn’t even retrace 38% so it can’t even be a fourth wave. Just by process of elimination, we’re in a continuing first wave. I would guess we’re going into the middle of the first wave down, but we’ll have to wait to see more before I can figure out a target.
Somehow the futures and cash have to end up on the same page. So, there’s also the possibility that cash has done a very small (but still legal) second wave and we’re now in a third, and that futures will bounce and complete a valid second wave on the weekend. I’ve seen that happen before …
It’s odd for them to be out-of sync and that’s making the figuring out of the count difficult. My count was based on what the futures were doing and they seem to be somewhere else right now.
So, Dmitri,
What’s happening now could make your count for cash valid, so my apologies. I didn’t entertain the fact that the futures and cash could by out-of-sync and I tend to base my counts primarily on the futures because it gives me the “full picture.” Lesson for me. 🙂
Except that the second wave has to be at 2000.50 SPX, not the lower wave bounce.
Sorry, Peter,
when you talk about second wave which one do you mean?
There’s only one we can be talking about: The second wave after a first wave down on the SPX, is what I was referring to.
But until I see what happens on the weekend, I can’t be 100% sure of the count right now. I have a good idea of what’s going to take place, but I need it confirmed by the futures. Because right now the counts are different between cash and futures.
If we take out today’s low we may go to 1920?
And after that you mean the second?
I received an email dated the 18th for an update???
Kent, I don’t understand the question.
Sold my shorts from 1985 at 1950 Will re short if we pierce thru the 1944 -47 level. Bought UPRO at the 1949 level.
All the cash indices negated my count, but the futures have not. They didn’t go to a new low. Got me scratching my head a bit as to what the next move is. But the big count is down. Just need to figure out this bounce …
Going into the weekend can mess things up, as the market usually bounces on Sunday (again, it seems to take care of those gaps most of the time, except in the middle of third waves …).
We may see a pop in the spx if we get thru the 1960 level
sorry that was for 1956.5 level for a pop up in the index
I have rarely seen such a large mismatch between futures and cash. Perhaps this has something to do with the fact that everything is moving more or less together as the world tries to deleverage. Hmmm.
The wave down from 1978.78 is in three waves. A wave down can’t just end on 3 waves, so the SPX has to continue down or it could retrace to there (the top of this wave)—which at this point seems unlikely. What seems more likely is the the SPX will continue down.
I would guess we’re going to sit here until the bell and wait for the futures to resolve the mismatch on the weekend.
you maybe right Peter. My 1956.5 level was touched, but could not penetrate thru that level. I may bail on UPRO shortly if we do not get thru 1956.5
I follow the bradley and monday has got to be a big low after that it’s up into the full moon
after that we have the big wave down …let’s see.
John, that could certainly fit with what’s happening. It think we’re stuck until the futures complete a valid second wave, which could happen Sunday and that would clear the way for a big drop.
That was my thinking, that is why I bought UPRO and sell out later today.
Now, if futures go to a new low, then I’d have to rethink this scenario.
Well I just follow the numbers that shape the bradley (helio) graphic.
At the moment they have a high succes rate ..the big drop from august 18-24 was spot on… and the recovery also…
So if things play out this time as well monday will be bloody again
Black Fridays and Bloody Mondays. My kinda world!
Cash looks like we’re putting in a double bottom, which confirms the 3 down wave, so it looks like it will now head up. All the indices. Weird market, boy.
So much for that idea.
They’ve already bounced now in the close.
They’ve done the same with European close.
They pushed Europe almost 0.5% down one minute before the close and bounced all back during fix on enormous volume (never seen such fix)
My concern is that I can’t find a valid five wave count. That means we’re down in three waves and could easily go back and test the top. So I would put that caution out there. If you were short at the top, no big deal. But I would expect a bounce at some point to some degree and so now is not the time to get short, imho. This is three waves down so far—no question about that.
The other issue is that the cash indices are down now close to the previous fourth, so we may have one last wave up to do a double top. An extremely difficult market to decipher.
I have learned over time that when I can’t determine a count, or the market doesn’t look right, it’s time to stay clear. I will likely do that until I have a clearer picture.
Like you see it should bounce up in all the cases.
And it’s likely to be on Sunday-Monday.
The target for ES should be 1985 from current level?
Dmitri,
I think you’re referring to 1985 as being the 62% retracement level. If so, no, that doesn’t work. That’s only in the case of a valid 5 waves down (a first wave). We don’t have a valid first wave down in 5 motive waves. At the moment, I don’t see an alternative other that a trip back up to the top at 2011 or so, but let me think about that for awhile. I don’t at the moment see another stopping point that makes any sense.
You just have to look at the wave on a one hour chart and you see that there’s no second wave, which means it’s not motive and the fifth wave down has to be motive.
I’m looking at the futures now that have done 3 waves up on a 3 min. chart. If they do 5 waves up and then come back down 62% (a second wave), then we’re likely going back to the top.
That could explain the enormous volume and manip at the fix and European futures levitation all the afternoon while US was heading down
Peter,
when you say that we might go to the top it is just to touch it once more or it means that the three-wave move down was corrective and we should make a new high?
Yeah, this is a corrective wave down so far. That’s the issue. So, that leads me to think we need to tag the top. I don’t see how this current wave can become 5 down (motive).
It was when the market went to a new low this afternoon that it screwed up the motive count. Plus the last wave down came down in three waves. So what looked really promising turned into a mess in the afternoon.
If we go to tag the top is it to make a new high?
But doesn’t that invalidate the Fourth wave in ABC?
No. A C wave is a C wave. Doesn’t have many rules. https://worldcyclesinstitute.com/three-down-so-far/
I’ll think about it some more tomorrow, but the three waves down is really obvious. And we’re in this channel.
Sold UPRO Back into the shorts again for the weekend
Yeah, we’re going down. I don’t know if this is still the first wave or we’ve somehow gone to a third. I think the former but I’d like to see what happens on the weekend. Futures just broke to a new low, as well. I would put us in the middle of whatever this wave is. The outcome is the same except that at some point I would expect a large 2nd wave. However, I should be able to see that coming.
This has to be just a continuation of the first wave. There’s no valid second wave that I can see anywhere, so we’ll continue down from here for the near future, by the looks of it. I checked in with Elliottwave International and we’re all confused as to the short term count. The longer term count is down. Somewhere along the line, we’ll get a second wave bounce.
I suspect they will ramp it up Sunday evening to clear out some of the longs before a dump for lower lows Monday.
All the best every one
Planetary angle lunar seasonals:
Monday: neutral
Tuesday: bullish
Wednesday: bullish
Thursday: bullish
Friday: bullish
Summary: Seasonals are negative all week. However, declination, distance, and phase are all positive, especially after Monday (Tuesday to Friday should benefit from Full Moon magnetic effect). Also we are post Venus inferior conjunction which usually sheds some good energy into the next month, and approaching Mercury inferior conjunction which until day of (9/30) has added good energy last few years (tho’ in bear markets the reverse). I exited long at Thursdays rally. Reentered long mid day Friday and am down 1% at the moment. As I am nicely up for the year, and see some upside short term will remain long until next Friday, unless we get overbought sooner than that. After next Friday, post Full Moon and post Perigee is time to be in cash or short.
Very occasionally, for whatever reason, Wordpress doesn’t recognize a previous post and I have to manually approve it, which happened in this case. So I’ll remove one of these. Thanks for posting, Valley.
Valley,
Based on what I’m seeing tonight as I do a full review of the markets, I’m inclined to agree with you. I’ll do a full post this weekend. My cycles analysis also points to the end of the month for a major turn. I think we might be heading up until then.
Peter,
For your new post, is there any way you can take into consideration the puetz crash window from Sept. 18 to Oct. 1? For the SPY, could we have finished wave 1 then bounce into Monday, open up to 199 then head down to 192, bounce a bit the next few days then head lower into Sept 25. Another bounce Sept. 28 then down again Oct. 2?
Good idea. I am also behind in posting parts of an online video interview I did with Steve. So maybe I can get some of that put together for next week. I have the crash info in another, much earlier post. It would be cool to see how that lines up.
In terms of the market, I’m likely to do a complete turnaround and suggest we’re going up to complete wave 2 (not 4) over the next 7 days or so. Which means a much bigger plunge, but more upside before that happens.
So, thanks Liz, great idea!
Hi Peter, thanks for that and your excellent and informative website. EW is starting to make sense to me which is exciting because it is the first tech indicator that seems to have usefulness and is intuitive.
This week “could be” a continuation sell off, yet all of my PALS aspects except for seasonals are good, especially Wednesday to Friday. So, I will probably be careful until Wednesday and then be in the market, risk and all, from then until Friday.
Thanks, Peter. Excellent site and am enjoying learning about EW, and starting to see EW patterns in charts. This week “could” be a sell off continuation based upon technicals and seasonals. Look forward to your next post.
You’re welcome. 🙂
Hi Peter,
what if I propose you the next count for ES:
1st – from the high 2011 to 1975;
2nd – from 1975 to 1990 ( 38% – you told it to be the minimum for the 2nd);
3rd –
3.1 – from 1990 to 1972
3.2 – from 1972 to 1982.88 (almost 62.8%) in the night
3.3 – two alternative counts:
3.3.1 – 1982-1973 with bounce 1973-1979 (62%)
or – 1982-1944 with bounce 1944-1967 (in this case 1982-1973 is subdivision)
So, we might be now still in 3.3
Tell me what is wrong in this count, please.
Hi Peter,
In you post below , you metion that we might test the Top …which top do you mean the major top @ 2137 or the last to around 2020 ( SPX )
===========================
No. A C wave is a C wave. Doesn’t have many rules. https://worldcyclesinstitute.com/three-down-so-far/
I’ll think about it some more tomorrow, but the three waves down is really obvious. And we’re in this channel.
================================
Regards
AZ
The 1929 crash gave us the 122.5 degree crash angle (Gann). On this angle we find the next relevant dates : 6/2/2014 and 5/10/2016. Applying the Gann wheel on this period we can see clearly that 5/22 was 180 degrees in this period and market a significant high. 9/17 is 240 degrees in this period. So 9/17 wasn’t just a date; it was almost as significant as the 5/22 high. That’s the reason Gann gives us for this market move. Trines and squares are the hardest aspects we have. Next date would be 10/16. I think that will be a low.
No new highs now; just a retrace into Wednesday before we race down again into 9/30. Litlle retrace 10/6-ish and further down into 9/16-19.
The next significant date is 4/25/2018; likely the low for this bear market.
Thank you Andre, been wait on your post……Nick
André,
Just reading this now. It fits exactly with the forecast for a double top at the end of the ending diagonal. Thanks for this!
New post. https://worldcyclesinstitute.com/trade-what-you-see/