
 Keeping a “Weather Eye”
I’ve mentioned before that my favourite sport is sailing. I’d much prefer to be out on the ocean more than just about anywhere else on Earth.
There are lessons I’ve learned about the power of nature and the preparation necessary for venturing out in the world that could be very helpful in the upcoming financial crash.
One is the fact that nature is all powerful, and any hope of controlling it is a pipe dream. A good example is the Hawaiian volcano. Erupting volcanoes is how the Earth cools itself and we always get them at climate extremes. We have more of them on Earth right now than normal and there are warnings of some potential super volcanoes to come. No big surprise if you know about climate cycles.
It’s also no big surprise that we’re apparently stunned that they’re occurring at this point in time.
I have a healthy respect for the power of Mother Nature, as does any sailor. We know the importance of preparing for a storm, no matter the weather report. However, few people on land (except certainly in hurricane-prone areas) prepare for a “rainy day.”
A storm is coming and it will envelope the world starting later this year.
 In sailing, you always have to plan your journey using charts (maps) that provide ocean depths, underlying rocks or other potentially dangerous underwater terrain, and currents. I typically plot my course by drawing the route right on the charts and writing down compass directions and important landmarks. Looking ahead is key to a safe journey — having a big picture view of what’s to come is important to your safety (and that of your passengers).
There might be surprises, but if you plan for most of them, your chances of success are that much greater. That’s why old ships had a crowsnest, the highest point on the ship, a place from which you could peer into the fog and attempt to find some familiar landmarks.
Using something we call “dead reckoning,” if you find two points you recognize and know the compass angle between those two sightings, you can easily figure out exactly where you are on the water.
For the stock market, for me, it’s Elliott Wave that replaces dead reckoning.
With where we are now in the SP500, coming to the end of the final pattern of a contracting triangle, let’s look ahead from a time perspective and attempt to predict when we might sight the end of the trend. (Triangles are in a fourth wave are an important “landmark.” They warn of only one more smallish wave before a trend change)
The Elliott Wave Principle is based on price cycles, not time cycles, so my “predictions” here won’t be as accurate a dead reckoning, but I think it’s important to try to get a sense of when the coming financial hurricane might start beating down our door.
For over three weeks, we’ve watched the US indices stretch out the patterns they’re currently in. Most notable are the SP500 and related futures, which have gone sideways for over three weeks. This sort of action makes it almost impossible to project a date for the top, but let’s speculate.
Bullish contracting triangles get confirmed at the top of the D leg. In other words, you can predict them earlier, but the actual confirmation that you’re in one doesn’t actually happen until the stopes of both the upper and lower trendlines are in determined (at the apexes of the C and D waves). With a turn down this coming week, the triangle I’ve been projecting for several weeks now, will be confirmed.
In contracting triangles, the C leg is most often the most complex wave. When that doesn’t happen, the responsibility usually passes to the D leg, something I warned about earlier on. We have indeed completed that complex D leg. The E leg, on the other hand is usually simple and drops much more quickly (in the usual ABC pattern).
The B wave of the SP500 triangle dropped in a little over three weeks, as opposed to the D leg taking over two months. So, let’s say the E leg takes a similar timeframe of three weeks starting Monday.
This would bring us to an E wave bottom at around July 1. What this suggests is what I’ve been fearing (and have mentioned on at least a couple of occasions): a long fifth wave to a new high during the summer doldrums. Volume is already very weak, and this will only exacerbate the volatility issues.
That fifth wave up may last two months and take up to late August/early September for a top. After the top, it usually takes about 60 days to get into the third wave, which is where we always experience “the crash.”
Based upon this speculative musing, we’d see the crash in mid to late October. That also happens to be the most usual timeframe from crashes, from an historical perspective.
We’ll just have to see how this thing plays out.
US Index Review (revised Jun 8)
I’m including these two indices again this week, as particularly in the NYSE, there was a interesting development.
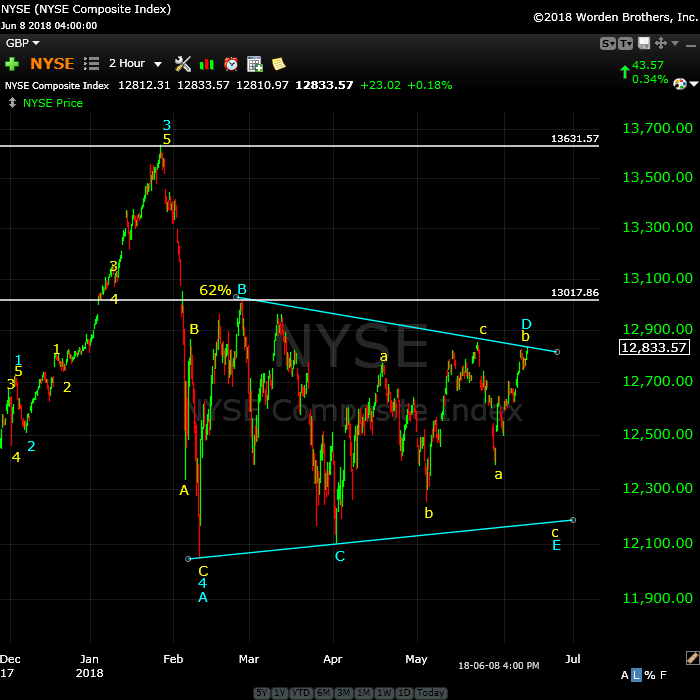
Above is the two hour chart of the NYSE. This is the mother of all indices, and if you have any doubts about where we are, just take a look here. It doesn’t have the typical “animal spirits” attached to it (as it’s not traded directly) and comprises all the other traded indices (SP500, DOW, RUT, RUA, etc.).
We’re in a fourth wave contracting triangle, currently in the E wave, with one more leg down to go (a ‘c’ wave). What’s interesting here is that the yellow b leg (labelled as the top of blue D) has returned to the upper trendline after a very big drop. This is highly unusual and show how we’re “getting pushed around” by the US Dollar, which is controlling the movement of just about everything out there.
We are all set for a turn down into the E leg. Technically, the NYSE is already in the E leg (unless we have a final movement above the previous high (the yellow c top at 12,853.33, and we’re only 20 points away from doing that). In any event, I expect a top here, and possibly a double top.
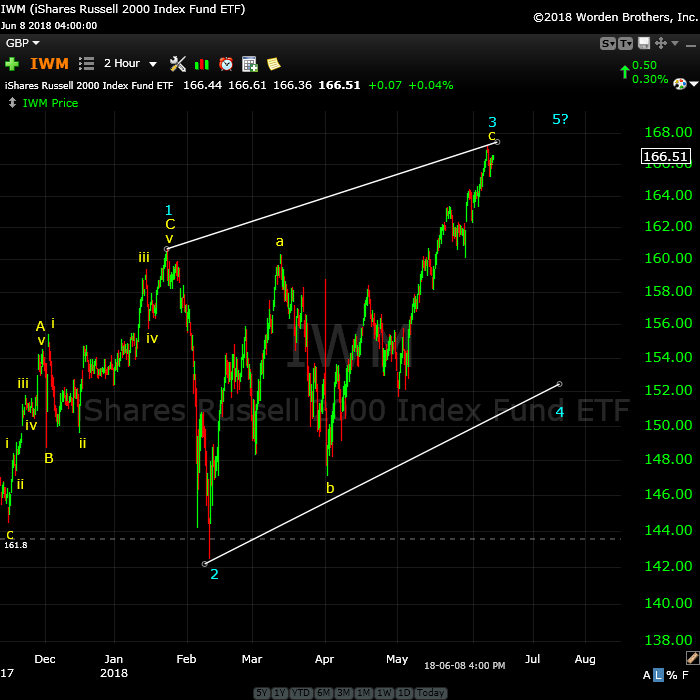
Above is the two hour chart of the Russell 2000 (RUT), showing the ending diagonal in play. In the Elliott Wave Principle (Frost & Prechter), the lump ending diagonals into the motive wave section of the book, but it’s really a corrective pattern.
The pattern has overlapping waves; it’s too weak to rally in a clean third wave. The waves are really collapsing on each other, due to the inherent weakness. You’ll find that pattern at the ends of trends, either corrective, or motive.
The ending diagonal will have a large fourth wave down to the lower trendline and then and final fifth wave up to a new high and I would expect a throw-over (a 5th wave that extends slightly beyong the upper trendline). When it does so, it will mark the end of the five hundred year trend that I’ve written about extensively here.
Website Notice (I’m moving servers)
For some time, I’ve been having intermittent problems with a variety of functions on my site. It’s seems to be a server problem at my current host (Bluehost — I can’t recommend them anymore after this experience) and so I’m moving the site to a different server. I’ve been testing the new site for the past couple of weeks and everything seems to be working perfectly.
The biggest frustration has been the issues with emails not being sent for people wanting to be emailed whenever a new comment goes live. I won’t actually know that the email comments problem is fixed until the move takes place. I’m very hopeful this final move will fix the problem.
It should be seamless and it will take place over the weekend. By sometime Sunday, we should be on the new site. The only issue that might arise is that comments left on one site may not show up on the new site (if the comments are made over this weekend).
_______________________
Elliott Wave Basics
There are two types of Elliott wave patterns:
- Motive (or impulsive waves) which are “trend” waves.
- Corrective waves, which are “counter trend” waves.
Motive waves contain five distinct waves that move the market forward in a trend. Counter trend waves are in 3 waves and simply correct the trend. These patterns move at what we call multiple degrees of trend (they are fractal, meaning there are smaller series of waves that move in the same patterns within the larger patterns). The keys to analyzing Elliott waves is being able to recognize the patterns and the degree of trend that you’re working within.
The motive waves shown above are typical in terms of their look and length. Subwaves of motive waves measure out to specific lengths (fibonacci ratios) very accurately. Motive waves are the easiest waves to trade.
Waves 1, 3, and 5 of a motive wave pattern each contain 5 motive subwaves. Waves 2 and 4 are countertrend waves and move in 3 waves.
Motive waves also travel in channels. The red channel above can be drawn from the apexes of wave 1 and 3 on one side and waves 2 and 4 of the other. The end of wave 5 typically meets the trend line on the wave 1 & 3 side before it reverses.
Countertrend waves move in 3 waves and always retrace. You’ll find much more about them in the countertrend section and the page on “The Right Look.”
To use Elliott wave analysis accurately, you must be able to recognize the difference between a trend wave (motive) and a countertrend wave (corrective). There’s very much more to proper Elliott wave analysis, but this gives you the basics.
____________________________
Registration for Commenting
Want to comment? You need to be logged in to comment. You can register here.
If you register, it protects your information. It also allows you to comment without filling in your information each time. Once you’re registered, simply go to the home page and click on the login link top right in order to log yourself in. Usually, you’ll be logged in for several days before needing to be logged in again.
______________________________
Problem receiving blog comment emails? Try whitelisting the address. More info.
______________________________
Couldn’t be happier … KK 2
Couldn’t be happier …The analysis and insight you provide is simply amazing! I’ve been trading the futures and equity markets for well over thirty years and usually average around 5% monthly. Since joining your Traders Gold Service two months ago, that number has better than doubled. I couldn’t be happier.—KK |
Rise above the rest … SM 2
Rise above the rest …I have only ever met a few people who, in their chosen fields (astrology, medicine, music, martial arts, technical analysis), rise above all the rest and you are one of them…you have ‘the gift’…and that’s why I’m a Trader’s Gold member. —SM |
A true expert in Elliott Wave FL 2
A true expert in Elliott Wave …You are a true expert in EW analysis. What you provide is not available anywhere and is priceless. Subscription on your services is the best thing I have ever done. Many thanks for your effort to make me a better investor. I now have more trust in my investment decisions. I hope you will continue the excellent work! —FL |
The best of them JL 2
The best of them …Last couple of years, I subscribed to several ‘market traders’. You are by far the best of them and the personal contact is awesome. Daily and daily updates are very well written! Besides your expertise in EW, I also like your cycles analysis. Best investment I ever made! —JL |
Get an upper hand … JC 2
Get an upper hand in trading …Seeing all the different currency pairs and the wave structures and hearing you explain why this has to do that on a nightly bases gives one a upper hand when trading. Elliott Wave applies to all stock and indices and can be applied to any candlestick chart. If someone ask what you want for Christmas – Tell them a membership to Peter’s “Traders Gold!”—JC |
Have not had a losing week RW 2
Have not had a losing week …I have been with Peter almost a year. The only thing that matters is have I made money with his service. I think I have finally turned the corner using Peter’s EW. I have not had a losing week in the last 5 months. Thanks Peter, for your amazing amount of hard work. —RW |
Tops in your field DZ 2
Tops in your field …You are tops in your field. Tried to follow Elliot Wave international for years. They were always behind the market. After discovering you, I perceive that you are an expert in reading the waves, which puts you way ahead of the rest of your peers. And you can read the Waves like you are reading tomorrow’s financial section. I pray you stay healthy. —DZ |
the real deal SM 2
The real deal …‘Educational, insightful and thorough market analysis for all levels of traders. It’s Elliott Wave at its best….Peter Temple is the real deal’ —SM |
The Market This Week
Here's the latest daily chart of ES (emini futures)
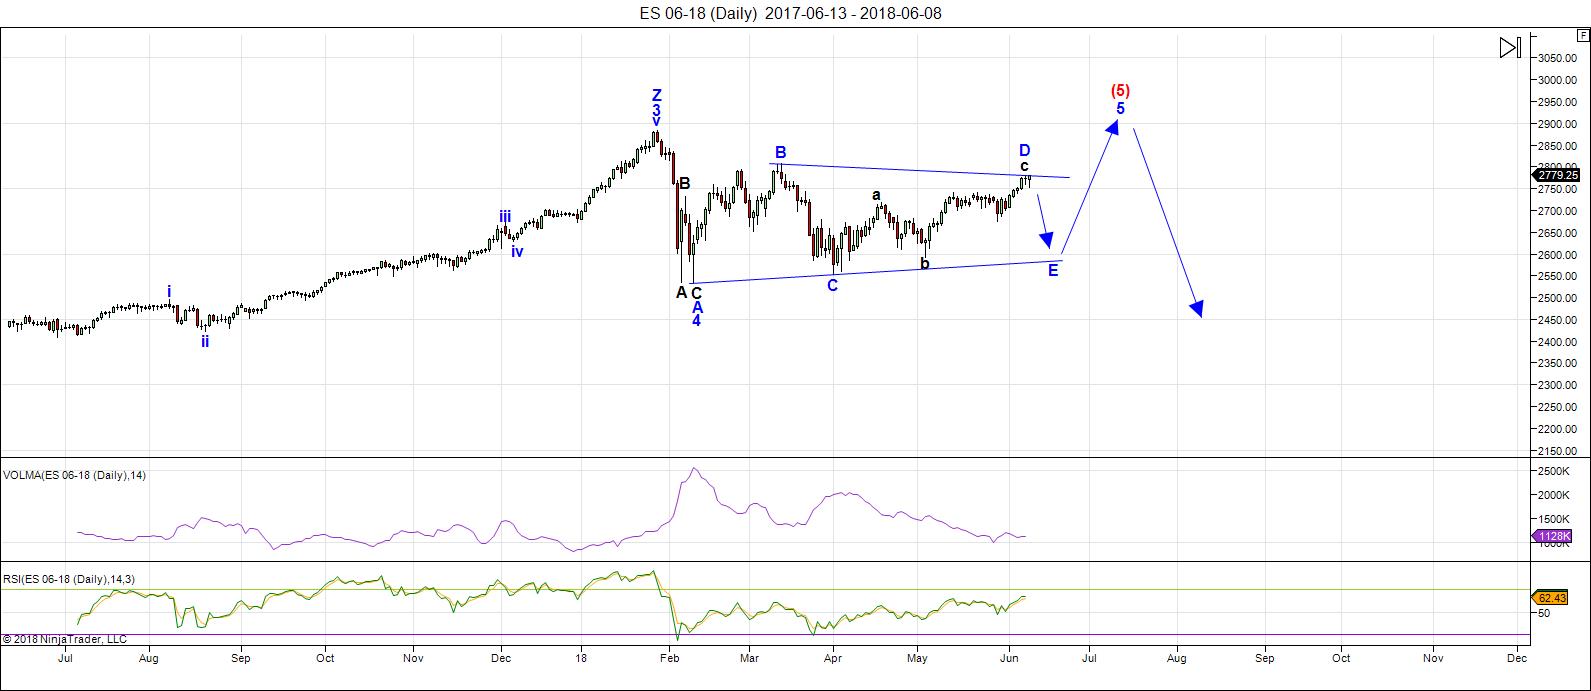
Above is the daily chart of ES (click to enlarge, as with any of my charts).
Last weekend, I complained about the sideways movement in ES for three solid weeks. This past week gave us a very fast resolution, as immediately after I made that statement, the Nasdaq indices (including the emini futures — NQ) decided to rally to create an ending diagonal, sending everything else up with it (see additional NQ daily chart below).
The 2780 level reached in ES/SPX was higher than unexpected, but looking at the resulting contracting triangle, it looks even more "text-book" than it did originally. The D leg top always defines the slope of the upper trendline in a bullish triangle, which this is, so now we should be clear to head down in the E leg.
I don't have a fibonacci measurement for the 2780 level, which is highly unusual. The highest level I had was 2760. We'll have to blame this on the Nasdaq and related indices rallying to the ending diagonal high.
Volume is exceptionally low, which contributes to the volatility and lack of momentum at times.
Summary: We ended Friday at the top of the D leg of the contracting triangle. Topping out will result in a high probability trade to the downside (the E leg of the triangle). Once E leg (down) is complete, expect a final fifth wave to a new high. That fifth wave up to a new high will be the end of the 500 year bull market.
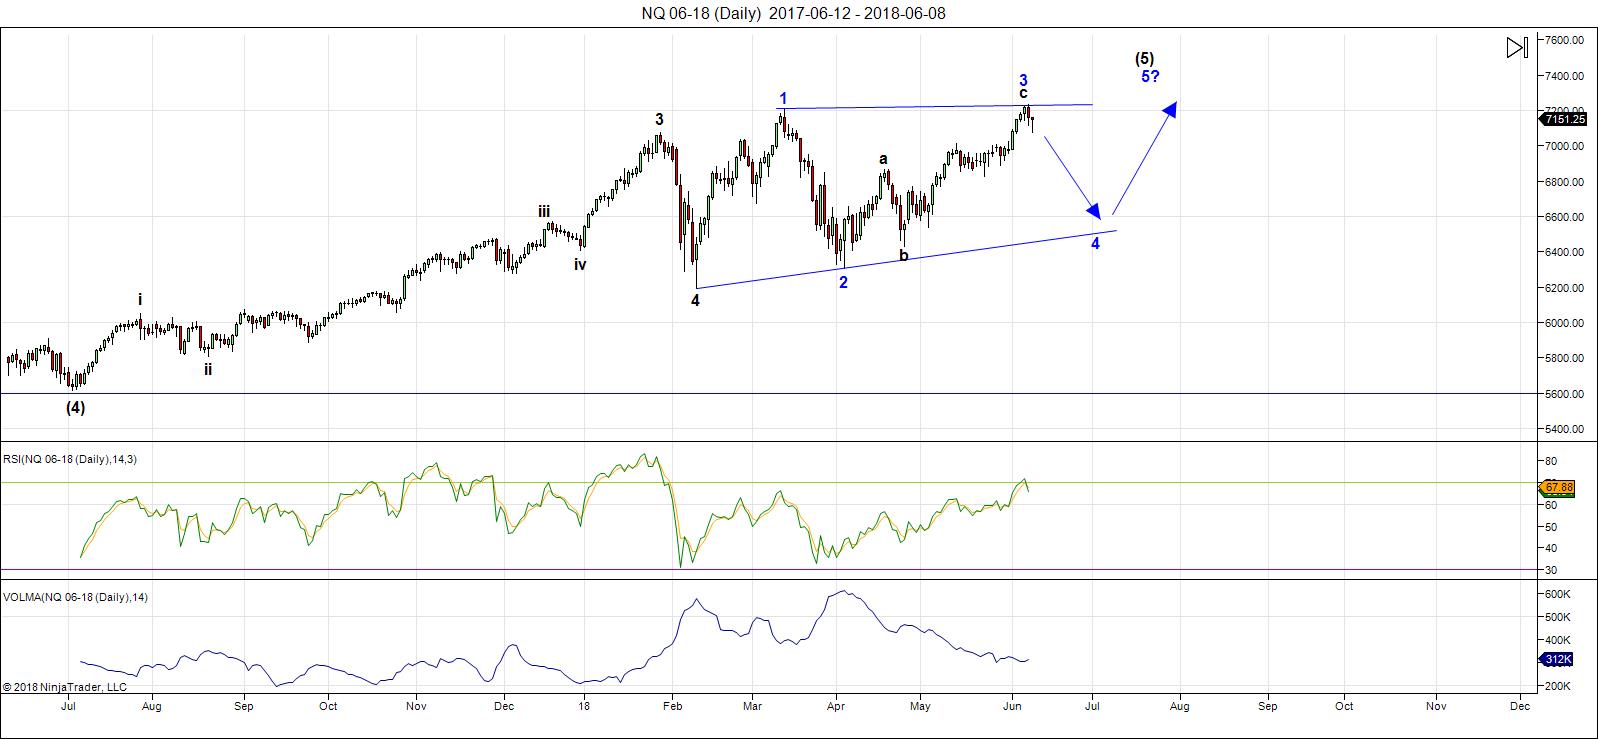 Above is the daily chart of the NQ (Nasdaq futures). You can see that the third wave of what is now an ending diagonal has reached a new high. The next move will be to the downside in a fourth wave that must reach the lower trendline.
___________________________
Trader's Gold Subscribers get a comprehensive view of the market, including hourly (and even smaller timeframes, when appropriate) on a daily basis. They also receive updates through the comments area. I provide only the daily timeframe for the free blog, as a "snapshot" of where the market currently trades and the next move on a weekly basis.
______________________________________
Sign up for: The Chart Show
Next Date: Wednesday, June 20 at 5:00 pm EST (US market time)

The Chart Show is a one hour webinar in which Peter Temple provides the Elliott Wave analysis in real time for the US market, gold, silver, oil, major USD currency pairs, and more. You won't find a more accurate or comprehensive market prediction anywhere for this price.
Get caught up on the market from an Elliott Wave perspective. You’ll also get Andy Pancholi cycle turn dates for the SP500 for the balance of the current month. There’ll be a Q&A session during and at the end of the webinar and the possibility (depending on time) of taking requests.
All registrants will receive the video playback of the webinar, so even if you miss it, you’ll be sent the full video replay within about an hour of its conclusion. For more information and to sign up, click here.


Thank you Peter for your time and effort in trying to tie everything together.
A side note from a sailor .
Cooler weather overall the past few months and more haze on what should be clear days.
Visibility in the 5 mile range vs a typical 8 nm. No doubt the weather has changed !
Obviously it’s area specific yet have been from Oregon to Hawaii as well as Oregon to long beach California
This year . The califonia coast more haze and limited visibility.
An added note : not as much tuna of mahi mahi being caught . We put hooks out on those trips to Hawaii .
Another note : Fukushima , it may not have an effect on temps but 30 years from now who knows
Anyways
Thank you
Many thanks Peter for the bird’s eye view of the markets. Here’s hoping we don’t get a gap down on Monday so I can execute an orderly exit from long positions in anticipation of E down.
I am curious about one thing. Is it required that E tag the A/C trendline?
I noticed it is just below 2600 and was wondering if we could not see a possible reversal prior.
I know we can’t go below wave C. Thanks again for all you do and see ya at the chart show.
E legs can either be short or overthrow the trendline, so I don’t know where it will end up. Based on being in the final wave before a top, I would think it’s going to end up below it (there’s a lot of weakness under the hood), but I’ll know better when we have the A wave down complete (not that it’s got a recent history of working to project the end of the ensuing C wave down. As I think you may have acknowledged, we’re not necessarily hitting fib targets at the extremes of this triangle).
Thks!
Update on the site move: Well, Bluehost (the server company) have completely screwed up the domain transfer and some of the background issues won’t be resolved until Monday. It’s taken me all day to get the website back up again, but my email at worldcycleinstitute.com is not working properly and likely won’t be until Monday.
Hi Peter,
Thanks for the big picture. I appreciate this.
From D->E My indicators (for now):
13th turn DOWN (perhaps sooner caused by trade war discussions)
14th turn UP
15th turn LOW = the LOW
Up tot the top on 20/21th
Down to the LOW on 26/27th = the LOW
http://www.prognoseus500.nl/
Later Willem
Hi Wilem.
Have you ever considered trying to correlate your indicators with possible EW wave counts? Since we are expecting a zig zag down for E to complete the triangle, there might be some interesting insights for how the legs unfold when compared with what your indicators are showing. Just a thought!
Hoi Verne,
explain the EW to the old one 🙂
Where can I find information about that phenomenon?
Sounds stupid, but I don’t use it. What does the EW deliver?
Later Willem
a classic post…prima facie evidence why people should be extremely skeptical of anything they read on public chat forums..
lol! You mean I am mistaken in assuming it was in jest? 🙂
Just to clarify in the event that my post was too subtle, my point was that if someone posts something that contradicts what Peter T is indicating at the very least it ought to come with a modicum of rational explanation. If we are at the top of the D wave, there really is not a lot of upward room for movement to continue before the triangle ceases to be one that is contracting. My assumption is that Willem’s call for a turn down on the 13 means he expects price to continue upward on Monday and Tuesday. Of course we could get some more sideways movement so that allows some possibility of the move down coming later in the week.
Some analysts have us in the middle of an impulse up with the third wave incomplete. It seems to me that unless we get a very short third and even shorter fifth wave, the triangle is going to be negated by that count. For ES that would be the B wave high at 2802.50, which is not that far away, and there is no way an impulse up could continue without violating that number, so somebody has it wrong. Considering the multiple negative divergence (some steep) we are seeing in so many indices at the most recent highs, I suspect we are closer to a turn as per Peter’s assessment. I could be wrong and regret exiting longs but that is my considered opinion.
So far as the value of what is offered on public forums, I think that value is strongly correlated with how effective the self-policing is. Peter T is far too busy to monitor, much less respond, to every single post. It is up to us to politely call out hog-wash when we see it, and do our best to put up information that is informative, useful, and as accurate as we can make it. It is clear to me that some posters have little interest in that regard. Just one man’s opinion.
FWIW, today’s DJIA high to the first 4 significant digits is 2537 (25,373.99). A Fibo .618 retracement of the Jan 26 ATH to the April 2 lowest subsequent low to the first four significant digits is also 2537 (25,366.73)!!
Yer talking big second wave I wager? 😉
When futures opened on Sunday evening we had an initial gap down that was almost immediately filled. Clearly the banksters still firmly in charge. Holding SPXL call until reversal confirmed. So far no signs we have a turn….
ES getting perilously close to invalidating triangle. A break above 2800.00 almost certainly means the B wave high will be taken out.
I have to admit I find it absolutely fascinating that the instance someone tries to constrain the market, whether it be with fib ratios, cyclical forecasts, or even classic TA, the market will proceed to barrel past any and all such attempts. I have been observing this with increasing amazement for years now! It really is remarkable…
I am taking profits on SPXL calls. Although the trend remains clearly up, we may be due for at the very least a correction at minuette degree, possibly minute degree.
Triangle negated imho…
At least a CONTRACTING triangle…
Yeah, now looking at an ending diagonal here, too. (sigh … never ending ….) No pun intended.
Peter,
In that case you are looking for a ramp to 2800/2807 , assuming ending diagnols
Correct.
I no longer pay the slightest attention to these seeming impulsive moves down in the indices. They mean absolutely nothing so far as future price direction is concerned these days. Along with gaps down that get immediately filled in the cash session, it is another example of why I prefer price support/resistance pivots to give the best indication of where price is likely headed. We may have a minute fourth underway at the close which means the move up is not yet done.
SPX 2750 remains my key level for any downside potential and I will be re-loading SPXL calls as soon as the current move down shows signs of reversal. I think the immediate trend remains up. Have a great evening all!
As much as I currently distrust them, I have two possible fib targets for the current impulse up at 2824 and 2916 before we turn for a possible correction.
Joe, I know you said you had some doubts about the triangle pattern but if you look at a weekly chart of SPX, I do think it is possible to count a completed triangle with a clear break above the B/D trend line followed by a long shadow retest. I had some reservations about analysts counting the triangle complete as the move out of the completed E wave seemed too sluggish compared to how I remember them. I may have been very mistaken in that assessment.
I know you mentioned the possibility of this being a B wave up, so I take it you would then have a big zig zag down ending at where some saw the C wave of a smaller triangle completed?
If that is right, the we would be looking at the B wave of a flat, and that means this
upward move has quite a ways to go to re-trace at least 90% of the A wave down. Yikes! Did I exit way too soon?! 🙂
Verne
My questioning the triangle was more because of timing initially
And as of today we do not have confirmation of a simple B wave
Even though it is something I have allowed for since near the Feb or April lows.
What matters moving forward is next weeks market moves .
We have a Fed meeting this week a Bradley turn date a few days ago
And a new moon on Wednesday June 13 . Option expiry I’ll consider as
The wild card yet if I’m going to be strict then next week must be down.
If I’m going to be strict and call for a B wave high ( I’m not forecasting anything )
Then the Dow needs to break above its Feb high at 25800 roughly and the spx
Would need to break above its March high and nya would need to as well
All by Wednesday which is a very tall order .
So I’ll give the market this week to sort itself out and I’ll see how option expiry
Goes.
I posted a chart link in last weeks thread showing some notes of the Dow
In 1999. The point was the New moon highs to New moon lows
And that even though 1999 was an overall bullish year those crash windows
That were in effect did work even if not exact .
You will see the word crash on the chart . There was a swing low a few days before
The exact crash forecast date and a lower low several trading days later which
Marked the low .
As I have said before : there is no guarantee a crash will come when these cycles are
In play but if there is to be a crash then when these cycles exist you should allow for one!
I always watch for a high on the new moon one month prior to the solar eclipse and
Look for a low on or near the day of the solar eclipse . That initial move is what I call
The initial set up . It’s typically a choppy sloppy move . It’s trend can be upwards or downwards
That choppy move becomes my bias on direction . It’s not perfect 100% of the time
Yet it’s what I look for and when the set up comes I trade off it .
As for your other posts above I think you nailed it
You began : just to clarify .
Peter T ——- I can’t thank you enough for allowing us this message board
And I’ll thank you again for your time and effort putting these weekend updates together .
I’m leaving my comments for next week . Letting the market prove itself
Thanks Joe! Very helpful.
And yes, thanks to Peter T for the forum. Looking forward to his insigjts on what might be coming next on Wednesday.
I think I was looking at a minuette fourth wave earlier. I think this now the minute degree fourth unfolding. This week we should see at least one more high brfore a larger correction if that is correct,
Well Willem, this is the day you called for a turn. From the EW count I am following that is entirely possible if we can complete small fourth and fifth waves today. I think it improbable though as it looks like we need another low for this fourth and then a fifth up. I find it quite remarkable how little intetest most posters have in trying to follow an EW count when commenting.
Misplaced expectations I guess. Time for a break….
Hi Verne, I am still at work. After 3-4 hours I update the site again.
This week stays the same.
Next week Monday the 18th from Low to the High and the same day a decline to 19-20th. Then a little up to 21-22th The High and then the decline to the Low on the 26th. etc
The 29th looks a very high.
So if correct
From D= 13th tot first Low = 15th Friday
The little up only Friday end of Trading and Monday
To E= From Monday 18th end? of the day a decline to 19-20th Then a little up on the 21-22th and the last decline to the LOW On the 26th
http://www.prognoseus500.nl/
Later Willem
Following up on this comment. https://worldcyclesinstitute.com/complexity-at-the-top/#comment-30347
Presuming tomorrow will be a swing low to finish today’s fade or higher lows from hereon, anybody seeing /ES 2850, maybe by the 25th? All this based on a bullish fractal. The outside day bar printed today was similar based on the timing of the fractal but it was a bear trap signal
And…if /ES pattern turns out to be a bearish butterfly that means D will be > X:
X = 1/29/2018
A = 2/6/18
B = 3/13/18
C = 4/2/18
D = ???
April new moon may new moon and now the June new moon
I think it’s worth paying attention to this going forward .
On another note , AMD has resistance near 20 and in general
With my limited data appears to have a 5 wave structure off of
The year 2015 lows. That stock now on my watch list if we see
A fairly large decline going into year end .
Sticking to my overall bearish bias for this year . Looking
For the Feb – April May lows to be broken on the Dow and spx
It’s to soon to call the past few days the top of this reaction
.
SPX on the 1-hr chart, if it breaches 50sma, I’m going to switch to the bearish fractal.
One more small fifth up out of fourth “Y” triangle…
I see some potential issues with relative sizes of waves 1 and three, and now 2 and four if we don’t head up from here. Four already looks somewhat larger than two…hard to tell with all that over-lapping price action…what a mess!
On the other hand, if a simple impulse we go a bit lower tomorrow before heading up to complete wave five…
I have got a lot of astro pointing towards a top on June 20/21, I will short the market if the vix is low and we are in top off the BB band.
Good luck to all.
Peter T,
Are you expecting we go back up or its the start of your anticiapted decline. Also wanted to get your thoughts on SPX triangle has it been invalidated or its still validate. As always thanks and appreciate you sharing in free blog.
Bill,
I mentioned sometime earlier this week that the contracting triangle is no longer. SPX is attempting an ending diagonal, as are so many other indices and stocks. More on the weekend, but we’re close. And the dollar is about to turn, so we’re at a major inflection point right across the market.
After doing some testing and after this recent move, it appears emails from comments are working, so you should be able to sign up and receive them (they weren’t working for awhile).
The site is now SSL secure, which just provides another layer of security.
The next 2 swing periods are July 2 and July 13
Today was a swing period date .
The new moon most likely had an effect on the market
The set up I spoke about begining this week, technically
Began in Wednesday . A new moon high to new moon low
Is what I need to see before getting excited about planning
For a larger decline.
The early Feb 2018 lows surrounded a new moon solar eclipse
which was on Feb 15. That previous 9 trade day drop if I remember
Correctly had a few things in common to similiar steep declines
In history. The lunar eclipse on Jan 31 .
July 27 lunar eclipse Aug 11 solar eclipse is where the rubber
Meets the road .
Aug 11-Sept 3 is preferred as a top yet July 27-Sept 3
Have mentioned .
End of the day :
A low on July 13 followed be a high July 27 sets up the crash
Phase and if you take in the fact that we had a steep
Decline from the Jan 31 lunar eclipse into the Feb 15 solar eclipse
I would focus more on the set up going forward and get SHORT
There will Be a total of 3 of these set ups taking place between
Now and January next year which give projections into March .
I have previously stated my bias as bearish into January 2019 .
For now that view stays .
Good luck everyone
Enjoy your weekend
Hi Peter,
Difficult …. But I will try to make sence of the traject High D to between low, to between high to Low E.
From D = 12th? (Highest close) to between low = (15th) 18th by open or down by trade war into the 20th.
Then up to 21th high and then the decline to the Low E = The 26th/27th.
Later Willem http://www.prognoseus500.nl/
For some reason my earlier post did not show up, but I said it looked like we finished a small fourth on Friday with tag of bottom of price channel. A fifth wave up would agree with John’s astro projections for a high next week.
I agree with Joe’s strategy of getting positioned short on moves up over the next several weeks.
Have a great weekend.
Peter G,
How is that 45 minute ES Futures Continuation Chart looking that you posted back on June 7th? My stockcharts.com charting site does not give me the 45 minute option.
My guess is with the “slope” of the upper channel line…we are most likely back in the channel. Your 61.8 Fib measurement on the Dow…halted that advance after a brief excursion above that Fibonacci retracement level.
A new weekend blog post is live at: https://worldcyclesinstitute.com/elliott-wave-ending-diagonals-2/
This website is for educational purposes relating to Elliott Wave, natural cycles, and the Quantum Revolution (Great Awakening). I welcome questions or comments about any of these subjects. Due to a heavy schedule, I may not have the time to answer questions that relate to my area of expertise.
I reserve the right to remove any comment that is deemed negative, is unhelpful, or off-topic. Such comments may be removed.
Want to comment? You need to be logged in to comment. You can register here.