
The “Man” that Affects Us Every Day
 This Sunday (August 26) marks another full Moon event. Below is an updated version of a chart of the SP500 since the beginning of the year showing every full Moon since that time and the effect on the stock market. Each one has resulted in the turn (to the upside in every case).
Could this full Moon trigger a turn to the downside?
The market is certainly ready, and we’re in the final wave subwave (5th of the 5th) of the large B wave up since April of this year (also a full Moon turn).
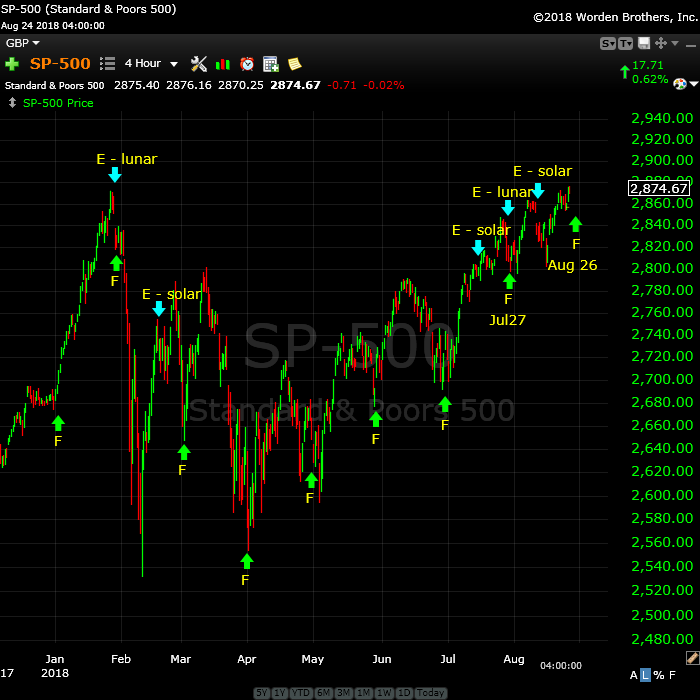
The chart above is a 4 hour chart of the SP500 from just before the beginning of the 2018 year. The green arrows with an ‘F’ below them show full Moon events, while the blue arrows are eclipses.
The Moon and Us
Every large body in the Universe gives off electromagnetic waves. That includes the moon, and more particularly, the Sun and planets in our Solar System.
Ever heard of the crazies coming out with the full moon. It’s real. You just have to ask a nurse or a cop. Or ask this guy.
At the University of Miami, psychologist Arnold L. Lieber did a study over 15 years with almost 2000 murders. As the new or full moon approached, the murder rate rose sharply … for the entire fifteen years.
I would suggest we’re affected because our brains are electrical – they’re energy fields—there’s no question about that. We get affected by even the smallest of electrical fields.
Circadian Rhythms
Circadian Rhythms are the rhythms we use to set our body clock. When we get and up go to bed. You might think it’s all dependent upon when the sun comes up.

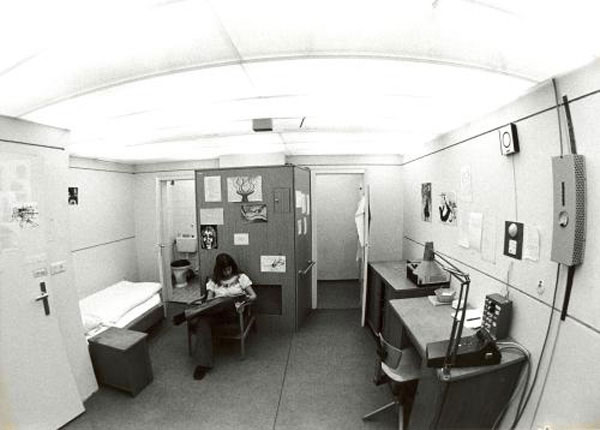
Rutger Wever, a German scientist did experiments over a 25 year period in a couple of underground bunkers. This is the actual bunker from the outside … and here’s the inside … homey. My video on his work is here.
 In one experiment, he analyzed the habits of two hundred people over two months.
He kept one bunker free of changes in outside light, temperature, sound, etc. but not electromagnetic fields. The second bunker was the same except that he blocked out electromagnetic fields.
In the first bunker, the subjects became a bit unsychronized, but gradually developed their own rhythm close to twenty five hours — that’s one lunar orbit.
However, the people in the completely shielded room became completely desynchronized. They developed rhythms of varying lengths – usually about a 36 hour day and a twelve hour night.
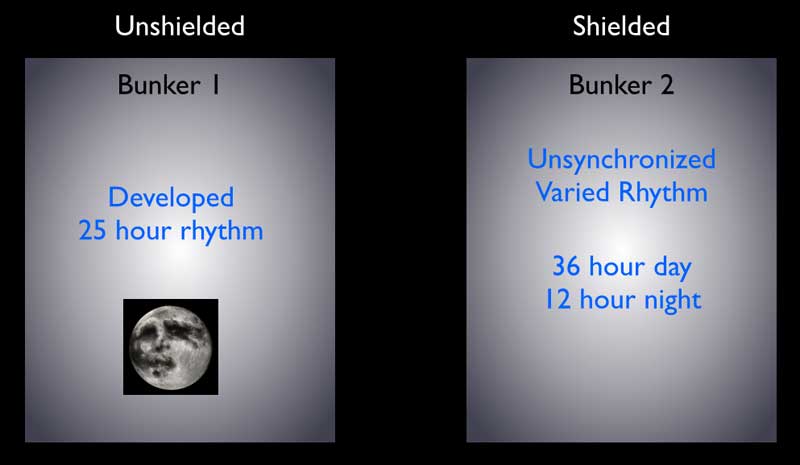 He then introduced a tiny electric field to the room (0.025 volts per centimeter) at a rate of 10 hertz and most of the subjects became synchronized again – to that 25 hour day.
So, we’re effected psychologically by electromagnetic fields, and we appear to be regulated by the Moon, not the Sun.
The Sun
The Sun has its own rhythm. Every 11.2 years, it reaches its solar maximum, when it throws off huge solar flares. Here’s a picture of what they’re like—you can see how tiny the Earth is as they throw out these flares. They can disrupt electrical grids, radio and television signals, cause plane crashes, and wreak general havoc. And they throw off huge electromagnetic waves.
Here’s a chart showing the solar maximum and the extraordinary events that happen when we get solar spikes.
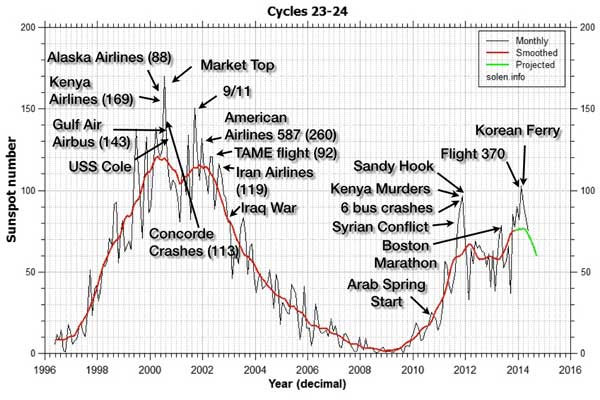 You can see that 9/11 happened right a the top of the solar maximum in 2001.
In the 1920s, a Russian scientist named Alexander Chizhevsky named the effect of sunspot maximums on humans as “the mass excitability factor.”
Now … there’s a reason history repeats itself. Humans around the globe are influenced by electromagnetic waves. I’ve talked only about the Sun and Moon, but there are eight planets in our solar system. They all throw out electromagnetic waves and that’s why history never repeats the same way twice.
So next time there’s a full moon or you think about what’s going on in the world, think about how we’re influenced as humans all at the same time around the world by forces beyond our control.
And think about what’s going on in the world in general: migrations, corruption, extreme climate, authoritarianism, and a coming financial collapse and social revolution. The same traits have appeared every 172 years throughout history. 171.4 years just happens to be when Neptune and Uranus conjunct. Typically, fourteen years after the actual conjunction, we experience a financial collapse.
That collapse also usually happens when the climate turns colder and drier (as it’s doing now).
At the very least, food for thought.
______________________________
Elliott Wave Basics
There are two types of Elliott wave patterns:
- Motive (or impulsive waves) which are “trend” waves.
- Corrective waves, which are “counter trend” waves.
Motive waves contain five distinct waves that move the market forward in a trend. Counter trend waves are in 3 waves and simply correct the trend.
All these patterns move at what we call multiple degrees of trend (in other words, the market is fractal, meaning there are smaller series of waves that move in the same patterns within the larger patterns). The keys to analyzing Elliott waves is being able to recognize the patterns and the “degree” of trend (or countertrend) that you’re working within.
Impulsive (motive) waves move in very distinct and reliable patterns of five waves. Subwaves of motive waves measure out to specific lengths (fibonacci ratios) very accurately. Motive waves are the easiest waves to trade. You find them in a trending market.
Waves 1, 3, and 5 of a motive wave pattern each contain 5 impulsive subwaves. Waves 2 and 4 are countertrend waves and move in 3 waves.
Countertrend waves move in 3 waves and always retrace to their start eventually. Counrtertrend (corrective waves) are typically in patterns — for example, a triangle, flat, or zigzag. Waves within those patterns can be difficult to predict, but the patterns themselves are very predictable.
Fibonacci ratios run all through the market. They determine the lengths of waves and provide entry and exit points. These measurements are really accurate in trending markets, but more difficult to identify in corrective markets (we’ve been in a corrective market in all the asset classes I cover since 2009).
To use Elliott wave analysis accurately, you must be able to recognize the difference between a trend wave (motive) and a countertrend wave (corrective). There’s very much more to proper Elliott wave analysis, but this gives you the basics.
____________________________
Registration for Commenting
Want to comment? You need to be logged in to comment. You can register here.
If you register, it protects your information. It also allows you to comment without filling in your information each time. Once you’re registered, simply go to the home page and click on the login link top right in order to log yourself in. Usually, you’ll be logged in for several days before needing to be logged in again.
______________________________
Problem receiving blog comment emails? Try whitelisting the address. More info.
______________________________
Have not had a losing week RW 2
Have not had a losing week …I have been with Peter almost a year. The only thing that matters is have I made money with his service. I think I have finally turned the corner using Peter’s EW. I have not had a losing week in the last 5 months. Thanks Peter, for your amazing amount of hard work. —RW |
A true expert in Elliott Wave FL 2
A true expert in Elliott Wave …You are a true expert in EW analysis. What you provide is not available anywhere and is priceless. Subscription on your services is the best thing I have ever done. Many thanks for your effort to make me a better investor. I now have more trust in my investment decisions. I hope you will continue the excellent work! —FL |
the real deal SM 2
The real deal …‘Educational, insightful and thorough market analysis for all levels of traders. It’s Elliott Wave at its best….Peter Temple is the real deal’ —SM |
The best of them JL 2
The best of them …Last couple of years, I subscribed to several ‘market traders’. You are by far the best of them and the personal contact is awesome. Daily and daily updates are very well written! Besides your expertise in EW, I also like your cycles analysis. Best investment I ever made! —JL |
Rise above the rest … SM 2
Rise above the rest …I have only ever met a few people who, in their chosen fields (astrology, medicine, music, martial arts, technical analysis), rise above all the rest and you are one of them…you have ‘the gift’…and that’s why I’m a Trader’s Gold member. —SM |
Couldn’t be happier … KK 2
Couldn’t be happier …The analysis and insight you provide is simply amazing! I’ve been trading the futures and equity markets for well over thirty years and usually average around 5% monthly. Since joining your Traders Gold Service two months ago, that number has better than doubled. I couldn’t be happier.—KK |
Tops in your field DZ 2
Tops in your field …You are tops in your field. Tried to follow Elliot Wave international for years. They were always behind the market. After discovering you, I perceive that you are an expert in reading the waves, which puts you way ahead of the rest of your peers. And you can read the Waves like you are reading tomorrow’s financial section. I pray you stay healthy. —DZ |
Get an upper hand … JC 2
Get an upper hand in trading …Seeing all the different currency pairs and the wave structures and hearing you explain why this has to do that on a nightly bases gives one a upper hand when trading. Elliott Wave applies to all stock and indices and can be applied to any candlestick chart. If someone ask what you want for Christmas – Tell them a membership to Peter’s “Traders Gold!”—JC |
The Market This Week
Here's the latest daily chart of ES (emini futures)
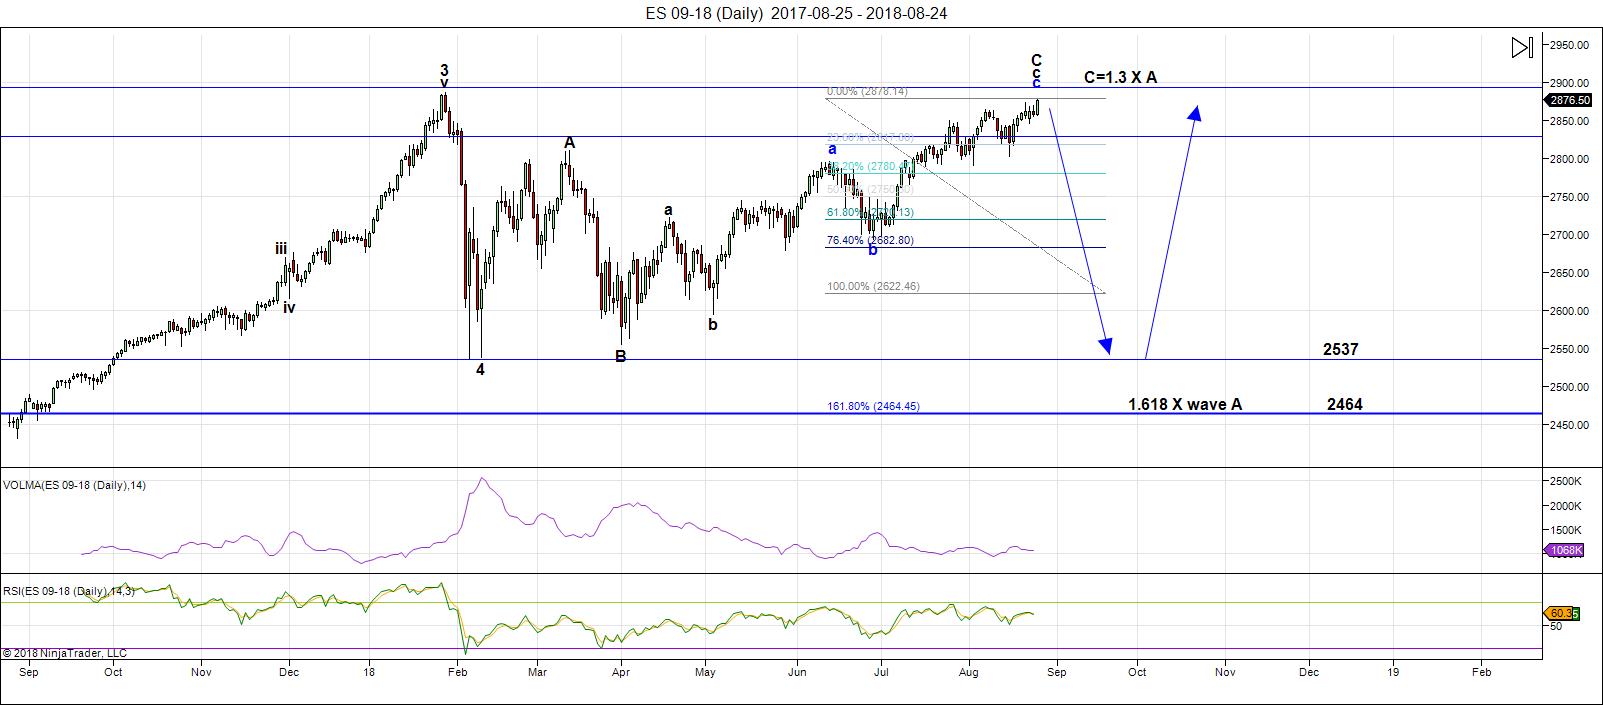
Above is the daily chart of ES (click to enlarge, as with any of my charts).
My preference is for this unfolding fourth wave pattern is that of a regular flat. However, technically, it could also be and expanded flat. It could also be a running flat (an extemely low probability, as the fourth wave hasn't retraced anywhere near 38% of the larger wave. The first two options depend upon what you select as the A wave.
That means that the ES/SPX has multiple possibilities as to a target on the downside. Accuracy (in determining the most probable target) is going to depend upon both counting and measuring the waves to the downside. It's impossible to pick a downside target at this point in the process.
If we select all of wave 4 (on the chart) as the "A wave," then we're looking at a regular flat. In that case, this outcome is the most probable:
- the C wave of a flat is typically 100 - 165% of the length of the A wave (so the target would be from 2537 - 2323)
However, if you consider the smaller A wave as marked on the chart as the "A wave," then we have an expanded flat. The traits of the C wave down will be the same, but because the A wave is shorter, the target on the downside will not be as low (these targets are shown on the above chart):
- the C wave of a flat is typically 100 - 165% of the length of the A wave (so the target would be from 2537 - 2464)
There are other options:
- a running flat would trace out a C wave that is NOT longer than the A wave (in other words, it would not go to a new low). I regard this option as very low probability because of the structure of the other indices (NYSE particularly, which is not in a flat pattern and will most likely trace out a simple C wave to the downside, which will have to be a minimum of the same length as the A wave —the A wave in this case starts at the January 29 high). On a larger scale, we still haven't retraced anywhere near the 38% expected for a fourth wave.
- a simple C wave (not a flat) down the same length as the A wave (most likely in 5 waves) would target roughly 2537
- a simple C wave (not a flat) that is 1.618 extension of the A wave would target about 2323.
- we could go a bit lower, but we'll look at that option when we have more information.
Summary: We're waiting for a top in a B wave, which will result in a C wave to a new low. My preference is that this structure represents a regular flat, but there are other options. Once the c wave (down) is complete, expect a final fifth wave to a new high. That fifth wave up to a new high will be the end of the 500 year bull market.
___________________________
Trader's Gold Subscribers get a comprehensive view of the market, including hourly (and even smaller timeframes, when appropriate) on a daily basis. They also receive updates through the comments area. I provide only the daily timeframe for the free blog, as a "snapshot" of where the market currently trades and the next move on a weekly basis.
______________________________________
Sign up for: The Chart Show
Next Date: Wednesday, September 5 at 5:00 pm EST (US market time)

The Chart Show is a one hour webinar in which Peter Temple provides the Elliott Wave analysis in real time for the US market, gold, silver, oil, major USD currency pairs, and more. You won't find a more accurate or comprehensive market prediction anywhere for this price.
Get caught up on the market from an Elliott Wave perspective. You’ll also get Andy Pancholi cycle turn dates for the SP500 for the balance of the current month. There’ll be a Q&A session during and at the end of the webinar and the possibility (depending on time) of taking requests.
All registrants will receive the video playback of the webinar, so even if you miss it, you’ll be sent the full video replay within about an hour of its conclusion.


As always Sir PETER this is fascinating and VERY informative. I most sincerely appreciate the time and effort you put in each week. Your work is both entertaining and enlightening. From the bottom of my heart, thank you for this amazing blog.
Quick question: if EVERY time there is a turn up on a full moon, why would this one be different? Ive been tracking all of the U.S major averages and looks like we are just waiting on the NYSE and Dow to make new highs then we have all of the markets small caps..large caps..techs..industrials..bigger market..etc all near the same point. Also if Dow and NYSE get to new highs SPX would be near the magic 3k level. That would seem a good place to tank the market. Do you think it’s possible in any of the flat scenarios for SPX to move up another 3-4% as NYSE and Dow top? This would also give credibility to another full moon turn up. Im long since 2600 and using your 2790 as an exit. I took some profits at my own target of 2875 which it hit but thinking we could have one more extension up to 3000 on spx. Is this possible Mr Temple or just a pipe dream of mine? TIA
This one’s different because we’re at a top with a full EW count. We’re going to turn down very soon whether the Moon likes it, or not.
Seems like another turn up..quite remarkable. Dow futures up almost another 100 and S&P now above 2880. Wow! Looks like you can trade on the full moons. Seems 100% based on last several.
Peter
I wish I could post a chart yet I cannot .
I agree with your update and this being a B wave .
You focus on spx ES while I’m focused on the Dow .
The Dow has not made a new all time high .
I have the June lows as a B wave low of sorts .
while you may not agree and I can’t post my reason
It still appears to me that the cash Dow has 3 waves down
To its low of this year and since that low it has 3 waves up .
So A down followed by B up . Your update gives the various
Patterns which I understand and get what your saying .
The cash Dow to me anyways still fits as a potential triangle formation
Yet has a long ways to subdivide to prove itself .
With only waves A and B there would still be wave C to below the June low
Followed by wave D and E .
Someone posted in the previous thread that it feels like the year 2006
I tend to agree .
Regardless of the pattern I must stay bearish and give the market until Sept 9
To top . I prefer though that it turns down sooner .
I have to admit this market has been fairly strong despite the divergences
thank you for your time and efforts and I’ll try my best not to rant
It’s all good
Joe
Joe,
At one point earlier in the year you were thinking that the Dow Utilities could be showing you the way we move forward…Do you still believe that is possible?
Thanks for the Moon chart. I think the fact there were 3 eclipses in July-August caused a wobble in the usual oscillation. The August 11 New Moon Eclipse did give a typical pullback but it was very short, ending Aug 15 instead of going low into the next Full Moon as usual. Today’s Full Moon normally should be a low so it may have a few days of pullback. The next high should be at the Sept 9 New Moon especially because that Sun degree is conjunct the Emini natal chart Sun and exactly opposite the SPX natal chart Sun. It could run up to say 2920 on SPX.
Yes that is why I’m uber bullish. IMO S&P could get close to 3k.
You are uber bullish? Thats probably another sign of an imminent top. I agree with Peter and the final rally will take us into next year quite easily. We should get a great trade to the the downside and then I will be placing a very large long for the final parabolic ending to this shambles of a market
Until proven different I will keep eating my veggies.. bull markets get euphoric before they fall..we still have not reached euphoria. Loads and loads of upside still.
What is euphoria? Is it a 100% rise in the Dow in a week or is it a 10% rise in a week or are we in euphoria already. Hard to tell what euphoria is. Everyone is saying we need euphoria and that wells me this is the perfect time to slam markets back to earth to wipe out the early euphoria bulls before making the actual euphoric blow off top.
Joe,
The reason I asked you about the Dow Utilities…That Index looks to have retraced a Fibonacci 0.746% of the 5 Wave down move off of the January high. That retracement is on a close only line chart.
New all time highs in ES and SPX eliminate regular flats for those indices.
DJI remains almost a thousand point off a new ATH.
This in no way suggests that deficit cannot be made up, but as long as it holds, the implication is very serious bearish divergence and DOW theory non-confirmation.
The current extremely steep negative divergences in all the indices making new all time highs is a reason for caution imho.
Mr Verne..the Dow all time high is at 26,616.71. Today it is close to 26k. Only another 600 odd points to a new all time high. Watch and see the new high soon IMO. S&P will hit 3000 soon too.
A very interesting situation. A few years ago I thought DJT was too far below its ATH to notch a new one. I was wrong about that so DJI traversing those last 600 or so points is certainly not out of the question.
The market is now the most overbought I have seen it in years. The divergent highs displaying negative momentum divergences are also as extreme as I have seen. I do realise in an era of central bank dominance, these metrics may no longer mean what they used to, but I for one choose not to chase this bull… 🙂
BTW, the lunar cycle price correlation seems askew at the moment. Last month the full moon came on a high but price did turn down, so I considered it an inversion with a full moon high, instead of a low.
Clearly this full moon has not witneses any market weakness, much less a low, and price has in fact continued higher, providing neither a full moon high, nor a low. Since the exception proves the rule, I would have to conclude that the relationship between market price and the lunar cycle is at best inconsistent, and therefore not really suited as a trading methodology, and at worst entirely fortuitous, which would yield the same conclusion. Concededly, the data set is small, but attemtping to trade a high or low this full moon would have been problematic.
With ES, SPY & SPX all at ATH. What does that do to the count? I didn’t think they were supposed to go to ATH until the 5th wave.
I am sure I am missing something.
Clearly that view was incorrect. It is becoming tough to see the current move up as anything but impulsive. If DJI confirms the new highs it means an imminent top is unlikely as that would confirm the ongoing bull run. A failure of DJI to confirm the new ATH would be quite a game changer, so far as where we are in this over-extended move higher.
I think the best trade at the moment is to not be in a trade and remain cash until a change in direction is confirmed or be long with a stop. I might take a small sacrificial long which will guarantee the market turning down and falling 1000’s of points but I’ll do that if the Dow gets to 26100 and that will kill all chances of a new high. I’ll make sure to post it so Charles can exit his longs before I crash the market.
And I’m long Dow from 26050. Stop at 25900. Will keep going long every break of 26k with 150 point stops going forward and this will prevent a new Dow record. I’m not even joking…I have 100% record of switching short to long just before a serious market drop.
The risk reward ratio for going long any of these markets at this juncture is not very good imho…
I know….I’m just trying to reverse the market direction with my 100% record as i mentioned. Its a small trade and I’m happy to lose the 150 points if its happens. Can make it back in a normal sized 30 pip trade… Since I went long i have successfully halted the DOW advance in its tracks. Now…just to wait for the drop.
That is much appreciated. lol
Strong market indeed guys!
Peter T when you get a chance does this change the count on the ES i am thinking that this must be the wave 5 top forming ?
Thanks in advance for any clarity
Hi mdss,
I don’t see anything that drives me to change my prognosis. The waves to the upside are corrective; they don’t just change in midstream. So, as I keep saying, we are not in wave 5 (if that were the case, all the major indices would be in a 5th wave). Flats are difficult devils to catch the top of.
Thanks Peter much appreciated
That interesting that you still see a large drop followed by more one more all time high
Lets see how things transpire
thanks again
Lol! The ulimate contrary indicator! Very funny! Maybe I too should open up some long trades! 😁
The Dow has barely moved since I entered. Do you understand the power I hold over the market!!! I’m as potent as the central banks!
Buy more! Maybe that will kick-start the downside slide!! 🙂
I know the market has continued to march higher on declining volume for many years not but come on people! For what is supposed to be an upward bullish breakout in Nasdaq this is beyond pathetic. Wait….is it just me??!!! 🙂
This is a classic “giddy up” rip yo face off rally. Stop in at 2790 on SPX..going to ride this bronco as high as she takes me.
Yep. Target for SPX is 2920- 2950 and should be met the next few days methinks.
The 64K question is whether DJI will also print a new high before we turn.
We also cannot rule out some sort of extension of this wave up and price continuing higher all week. Yikes! A lot of bears were caught flat footed on this one and quite a few analysts were confident we would not see new ATH prior to the correction. Mr. Market will generally make fools of most of us…lol! 🙂
I am cashing in JDST and DUST puts and JNUG calls. I want to see GLD close above 114.70 before really loading the wagons. It is entirely possible that we need one more move down in the “Yellow Fellow” before we have a more lasting bottom.
I know we are probably close to an interim top but I am taking a risk and holding long positions of this impulse up overnight. I do not yet see a clear sign of a reversal even though VIX is flying a cautionary flag. I am expecting a tag of 2920 and will be exiting long trades the second we cross 2900, probably in the am tomorrow.
Have a great evening all!
Peter t
Some very good information I think you will like to see
https://www.armstrongeconomics.com/international-news/nature/the-hunger-stones-have-appeared/
Ed
I see your question on the utilities yet don’t have time to reply .
I’ll say though if the utilities index did complete a leading diagonal 5 wave decline
Then technically the retrace should go back to wave 2 and then a very very steep
Decline should follow .
As for my bearish trades , the cash Dow hit my stop . I’m still holding yet unless this index
Starts turning down soon I’m wrong . Giving the market until Sept 9 to top but
It’s not acting as I had thought it would .
Off of California coast and about to lose reception
Joe
Thanks for sharing the climate link Joe. Something totally unrelated to markets jumped at me. 540 AD marked the decline of the last of the Ancient empires of India. Historians have pointed to various reasons for its decline, but none of the explanations are convincing. The Gupta empire was considered the Golden Age for India and after its decline, India went through a period of “dark age” with the country splintering into small fiefdoms. For an agrarian society, a sudden global cooling with decline in food production can easily be the reason.
Quite right about anomalous market behavior. The persistent extremes we have, and are seeing truly defies conventional T.A.
Anyone who argues otherwise simply has to look at how difficult it has been for analysts to accurately predict market turns of late, and many of these folk have been doing this a long time. We now have price trading ABOVE B bands in several indices and as extreme as that is in and of itself, I would not be at all surprised to see the relentless buying by CBs keep prices pinned in that region for some time as we have seen that strange price action before. I am personally exiting all long trades on any move back below 2900 even.
I’m buying EVERY dip. S&P to 3K around the corner IMO. No signs of a pullback, I’m still using 2790 as my stop.
Do you realise how much time Peter spends on this website and the free part of this blog Charles? He is laying out some very fundamental EW ideas and all you seem to post repeatedly is how you are buying every dip till the S&P reaches the moon. Yes that might work for you but please try and post using language that doesn’t completely contradict everything Peter says. As far as I’m concerned you should only post if you are well aligned with with Peters view or have good research to share on why things may be different. Simply stating a round number target is NOT research. If you don’t agree with this site I don’t see why you are here really. I made some cheeky posts above but I’m just messing around until the market turns as I overall agree with Peters prognosis. I can refer you to some Uber bull websites where your posts may be more useful if you prefer?
The 2790 stop is from Sir PETER my lad. Until the C Wave is confirmed, yes I’m buying every dip. It is a corrective wave that we are in. I bought calls on today’s dip at .60 and sold at .80. I mostly scalp as Mr Verne has laid out. I’m overall long since 2600, took some chips at my target of 2875 as I laid out numerous times (BASED ON PROJECTED WAVE LEGNTHS and FIB RATIOS). I continue to think that Dow could hit new high like all of other US indices before we head down. If 2790 comes sooner so be it but I do not discount Sir PETER’s work. In fact each week I tell him how much I appreciate the time he has put in. If you are mad at your own trading losses please don’t shoot the messenger. We are STILL a bull market that KEEPS going up, why would I not continue to buy each and every dip until the trend changes? I follow price and price keeps telling me Mr Market is heading higher.
I personally don’t mind Charles’ bullish posts at all. He is clearly scalping the move higher and trading with stops in place which is smart. I do think it would be helpful to other readers if entry and exits were included as we can all learn from one another. I for example have posted my approach of buying VIX calls on each and every dip below 12.
Bottom line? Bulls make money. Bears make money, so long as you know what you are doing, and WHY!
Just my two pennies. 🙂
Mr Verne. I like the BB bands. Buy when oversold then sell when overbought for a good 25-100% ride most of time. I like the 5 and 10 min charts and keep capital and risk in check. Mostly been day trading but keep open some longer term trades where I buy ATM calls and sell when SPY or SPX hit projected targets based on fib ratios and some other projected targets. My 2875 to 2880 spx target as you saw me call in real time while others refused to believe Spx would register a new high. Not trying to put a feather in my own cap just showing I use EW, fibs, and projections to arrive at my conclusions.
Yes Sir! Keep it up. 🙂
Holy guacamole! Took a stab at some 290 calls at open. Made 300%!
This is where I see the markets right now. The reason this market reminds me of 2006 was because of how a corrective looking wave kept going up to new highs and could be labeled as a corrective elliot wave. It is hard to do in real time and the only confirmation of a completion is the break of lower trendline. The break is violent, but may take a while to happen. All I can do is trade the way market is behaving right now…
https://invst.ly/8gq5p
Distinguishing corrective from motive waves is clearly useful in telling us when a move will be fully retraced. As a trader, it seems to me to be less useful in saying anything about how far in a particular direction price will proceed and in that sense can be a distraction from making profitable trades. This obviously particularly true with expanded flats. Once we cleared what looked to me like a minor degree triangle with strong support at 2800, I calculated a target of 2920-2950 for a minor fifth wave up. Concern about “corrective” kept me from taking full advantage of the move although I did finally get in once we passed 2860. Rather than trade what I saw, I missed 60 SPX points worrying about what I thought. I am starting to realize also that my assumption that fib relationships are not working is flawed reasoning. In fact when the fib relationships are not panning out it is one of the clearest pieces of evidence that I have an incorrect wave count. Strange it took me so long to figure that out! I am now expecting based on my assumption of this being five wave impulse up to see a turn in the 2920 -2950 area.
You simply cannot argue with price, and Mr. Market is ALWAYS right!
Agree Verne. The whole point here is to forecast Mr. Market. I was expecting SPX wave B to top out, which it clearly has not. Aug-September have historically been bad months for equities – so I was hoping the correction comes in these two months. Most of us here accepted that a break of 2790 is required for bearish case to work – that never happened and in that sense, at least the critical level was identified correctly. How we each trade this wave “B” will depend on our individual trading styles. As of now, I will have to wait for more price action to figure out alternate counts.
Peter T,
I have a question for you. Would you have a idea/speculation on why the daily trade volume in the S&P 500 went from approx. 2 billion shares traded per day to 7-10 billion shares traded at the 2016-17 time interval? Which has continued to today.
Jeff T
Next turningpoint Sept 4…. so up till next week..
A possible big decline, could happen after Sept 16, so a blow off top SP500 at 3000 is still in the cards.
This information is based on my astro points and tidel work.
Thanks John. 3000 is now only 3% away. At current rate, seems like we get there by Sep 9 (new moon).
Possible, Sept 4 could be a turn or just a day dip, like yesterday, after that I have Sept 11.
If we get a blow off top like the Nasdaq in 2000, we still can go to the moon..I hope this will not happen this time.
Me thinks the Dow will hit that new high soon and SPX @ 3K not too far away. Bought again on dip this am and made 300%!
Dow only needs about 1.8%..470 points to new high. Add 1.8% to SPX and you get 2965. Pretty close to 3K. Loving this market!
What I find interesting is that different EW counts are starting to converge. One analyst that I have found to be extremely accurate and had a upside target of 2910 several months ago is seeing us complete a primary third wave up. The correction after such a move for a primary four will take us in the same price range as Peter T’s expected wave C down. Very interesting!
Interesting can you give us a link or name Verne?
Her name is Lara Iriarte and I subscribe to her service. She has been right on the money on this bullish run which she called three weeks ago due to OBV and A/D line signal. I was skeptical, but clearly wrong! ,🤗
Oke thanks
Yes..sharp downturn will come..soon enough but this wave is up over 360 points thus far. I always agree with trade what “you see” not what “you think”. That has saved me many a thousand dollars over the years. EW is very helpful tool and as you also mentioned fib ratios and wave lengths. I calculated that this wave would only stretch about 325 points using an extension of 1st wave up and my calc came up short…it has extended beyond 350..and now beyond 360..Quite marvelous!
NYAD continues to power on without a hint of negative divergence…
https://worldcyclesinstitute.com/wave-four-from-hell/comment-page-1/#comment-20399
https://worldcyclesinstitute.com/elliott-waves-and-probability/comment-page-1/#comment-17325
https://twitter.com/RyanDetrick/status/1017749230377631745
https://twitter.com/RyanDetrick/status/1033081254063865856
Peter has already mentioned in his Traders gold he barely puts any time on the free blog now because his teachings are lost on the majority. All I was trying to say is let’s try and discuss Peters analysis more than make this blog about your own otherwise I won’t be surprised if Peter shuts down this blog as he has contemplated before. It’s quite evident from peters lack of posting here this is the case.
My own view is that discussions that do not lead to execution of profitable trades are a complete waste of time. I am willing to listen to anyone who actually successfully trades the market if they are willing to share their approach. We all respect and appreciate Peter’s generous contributions. That does not relieve anyone of responsibility for doing their own due diligence.
Q,
Not quite correct. I can only share so much on the free blog because that would not be fair to my paid membership. And with this market the way it is, it’s taking all my time to stay on top of it (I’m really strapped for time). I can share that the US Dollar seems to have topped, NDX is in an impulsive 5th wave, and SP500 is probably still a flat, because it’s corrective. If you don’t believe that, just go look at the NYSE. It’s definitely corrective and you can’t have a sub index that does something completely different than its “mother” index.
In any event, I went through all of this in tonight’s Chart Show.
I thought a B wave that exceeded the A wave would have to be an expanded flat and SPX has done so with a new ATH.
The B wave has to be more than 105% of the length of the A wave to be considered an expanded flat (it doesn’t have anything to do with whether it exceeds the previous high). So yes, SPX now falls into that category (exceeded that length today, I think). It isn’t going to make much difference to the outcome, although it does open up the possibility of a running flat.
https://www.youtube.com/watch?v=KLAtooletp8
Very interesting long term charts. Note his last daily chart doesn’t have divergence yet. This works in well with Pete’s drop soon and then a new high. That would probably get that chart to diverge. Check it out.
A lot of folk are citing only the daily chart of A/D to argue the bullish case and ignoring weekly and monthly divergences
routinely monitor the daily, weekly, and monthly NYAD charts…there are no negative divergences on any of the three charts…
It depends on where you are looking. Index components trading below their 50 as well as 200 day MAs are showing clear, steep negative divergences at the current highs.
NYAD daily, weekly, and monthly charts…there are no negative divergences on any of the three charts…some folk are https://tinyurl.com/ydg9ynhs
SPX will hit my 2920 target tomorrow. I generally do not trade ahead of a confirmed reversal but the steep weekly negative divergences we are seeing argue strongly that a turn is close. I will be opening an initial position at the close tomorrow via SPY
293/295 September 21 bear call spreads. I will be piling onto SPY 290 calls on the first index close below 2900.
I was a bit disappointed we did not see much lunar cycle correlation this month.
I do not subscribe to your charts but from what I see we are in II down correction in the dollar .. so wave I has closed .. correction ending somewhere between 91 and 93…
I saw your note the dollar had topped and was curious how u came to that ..from my charts I see a large third wave coming ..have enjoyed reading your posts
Hi Marie,
Well, you just said the same thing. It topped in either a first wave or B wave. My preference is a B wave at the moment until proven it’s wave 1. From an Elliott wave perspective, it’s too early to tell which it is. A first wave would lead to a second wave, as you say. A B wave would fully retrace. I have two issues with it being a first wave, but we’ll see.
Speaking of the dollar, a C wave down implies further movement up in equities one would imagine, unless they both move in the same direction moving forward. I am curious about that possibility.
Thanks Peter. I did not know that! 🙂
ProShares Announces ETF Share Splits
http://www.proshares.com/news/proshares_announces_etf_share_splits_08292018.html
Those crooks are at it again! Lol!
I cannot believe how they get away with this ridiculous scam.
Just admitting that something is wrong .
Vivek, I believe it was you that mentioned the year 2006 similarity .
I agree yet for most likely different reasons that you.
I’m begining to take in why I’m wrong yet do not have the data
To do the research .
Roughly though the date Oct 11-12 th will come into play .
Going back to 2006 though , if my memory serves me correct
The mars Uranus cycle failed and I correctly stayed bullish despite
The cycle being bearish . Also back then we entered a Venus bear cycle
Which turned bullish in Aug 2007.
Both of those cycles came back into alignment in June of 2008 and the market
Then crashed .
I’ll need to dig further into this when I’m back home and have the time yet
As of today my perspective is one of caution yet still favoring higher prices
Into late 2019 early 2020.
Short tem i still am sticking with some sort of turn in mid Oct ( Oct 12 )
As well as a low of sorts in January ( the 20 th )
Recognising that Oct 11 has been a swing date in the past and recognizing
I’m wrong ( short term ) has not been entirely painful financially as of yet .
The Venus cycle runs for approximately 10 months ( 20 months low to low )
Oct plus 10 months is August 2019 ( a low to high technically ) mars Uranus is almost
An exact 24 month cycle low to low yet not an exact high to high . Jan 2019 is the next
Cycle low with a roughly at this point cycle high Oct-Dec 2019.
I won’t comment further on this until my research into 2022 is completed .
On the surface it looks like we will have a set up for an extended decline
Into 2021-2023 .
At the moment though it is looking like I am wrong yet I have not been proven wrong by
The market as of yet .
Sept 9 will matter to me as will the period ending 6 weeks following the Aug 11 solar eclipse .
Damn ……. It’s looking like Peter t has been on the right track !
Waning Gibbous Moon
Waning Gibbous Moon
The moon is currently in Aries
The moon is 18 days old
Distance: 61 earth radii
Ecliptic latitude: -5 degrees
Ecliptic longitude: 22 degrees
SPX vs Pundits
https://pbs.twimg.com/media/DloRqfCW4AE6EZs.jpg:large
https://tinyurl.com/ybmp4g4p
Waiting on Peter T’s 2790 break. Don’t know if any bears are alive or if they just get swarmed by the bulls on every drop..no follow through. That tells me wave b has some more legs. Wakey wakey eggs and bakey..gobbled up this drop again with more calls.
Calls working like a snake charmer. Looking for target of SPY..291.50 to 292.
Only made 25% today on my calls but still a good day. Love these dips!
Seems my 26050 Dow buy has started the market turn. Great news for the bears. Dow needs to drop below 25k and then it’s short all rallies
I am out of long trades today. Still looking like consolidation to me but I think upside is limited. If we move much past 2095 I think 3000 is going to act like a powerful magnet. I will be looking at VIX for some signals as to when a turn might be imminent.
Market really stretched to the upside. Long GLD with a GDX 20 strike put as hedge on possible current second wave correcttion.
I missed out on the whole rally from 2792. I was short between 2800 and 2840 and stopped out at 2865. I do not have a good count for wave B in its current form. Given that, I am just waiting this one out. I would need the upward trendline broken with strong momentum to get long at these prices. As of now, that has not happened, which means I will wait for better prices to get long or stay out of the market. All this clearly depends on one’s trading horizon. I like playing for moves greater than 5% and as of now, I don’t have a high confidence trade there.
I meant 2950…of course! 🙂
I think we have one more small fourth then a final fifth up to a new high to complete the current pattern. I expect to see VIX continue to diverge on the final move higher.
I agree! I bought on dips below lower Bolinger band today (two batches) and sold at upper BB for avg 8 pt ride. Wash..rinse..repeat. I was going to buy bigger dip later in day..but didnt wanna hold the bag overnight. Made a little over 25% today..a fraction of yesterdays triple bagger..but winning is winning.
Charles, am wondering how many days till expiry you choose for your short term call buys on SPY?
I suspect as for any scalper, the lower the premium the better! 😜
Most scalpers prefer to pay as little premium as possible when trading options. I personally find at least two weeks to expiration offers the best risk reward ratio.
For trend trades like my longer term EW trades I tend to buy 3-4 months slight OTM. I own a lot of UVXY and VIX calls for Potential C wave by Oct..but mostly still long from 2600 in B wave as my target was 2875-80. Sold a good chunk for hefty gains and now have rest with stop at Sir Peters 2790 level. Haven’t positioned fully for C wave because I’m still seeing more upside in B. Im thinking Dow could squeak out a new ATH before the drop.
For bolinger band trades..I use spy 1 or 2 day calls slightly ITM..sometimes I need to do 1 to 3 batches to DCA. For ex today I bought Friday 290.5 calls at just under 90 cents on drop below B.B..at open then another batch at just under .60 around 11am on second stab under bb. So I was in at avg of .80 then when it went above bb I sell. Calls were above $1 at that point and got close to $1.15 so had tight stop in at $1 for 25% gain. Yesterday I used same day contract..bought itm calls on dip and rode the 20day MA up all day for 300% gain.
Finally a nice pop in vol trades. All now nicely in the green. Here’s hoping for some follow through manana.
I took a stab at some uvxy and vix calls because I didn’t like divergence. Figured best to be early for C wave then too late. Bought oct and nov..paid a little more than I like but one good spike and I will be sitting like a happy camper Indian style..with the smile cheek to cheek smoking my peace pipe 🙂
Here is a good reminder from Chris Kimble that there are other ways to measure divergence than the A/D line.
https://kimblechartingsolutions.com/2018/08/sp-creating-topping-pattern-like-2000-2007/?utm_source=ActiveCampaign&utm_medium=email&utm_content=S+P+creating+topping+pattern+like+2000+++2007%3F&utm_campaign=Daily+Kimble+Blog+Posts+RSS
Good stuff Mr Verne. Watching closely and tight stop at a Sir Peters 2790 level
If all the expectations of an impending C wave down are correct, it should be a lot easier to trade than the maddening possible B wave we are completing. First, the move down should be five clearly impulsive waves. Second, VIX should give a very clear signal on its completion by posting its own highest spike at the end of the third wave down, followed by a 25-40% retrace during the fourth wave, and then a generally slightly lower spike higher on completion of the fifth wave.
Although we had what looked like an impulsive decline going into the close, I have seen so many of these entirely retraced I do not have any confidence that we have a top. I still contend that a turn at what could very well be a primary degree top should take out an important pivot on the FIRST wave down of a five wave impulse. If we have started wave one down and are now retracing a two of one, the third wave should slice cleanly through 2800.
If that does not happen, my money is on new ATHs before the turn. Based on what happened today, I expect no help from futures. We could very well witness another intra-day price reversal. Best of luck to everyone!
Yeah im still buying these chips n’ dips until we get some price action to the downside. Slow like a turtle going down but Trix..the mighty rabbit on the rallies. Me thinks Mr Market has much more upside.
Interesting is this Twitter message from Lunatic trader, performance New Moon/Fullmoon this year.
I have a turn date this weekend or Sept 4….We should go up till Sept 11.
New moon on Sept next month Sept 9.
https://lunatictrader.com/performance/
In 290 calls at open near .45 and out at .90 for a double. These dips are a gold mine!
Charles the more I read your comments the more I’m impressed. Have you considered staring your own hedge fund? You might be the best performing fund in the world with your performance. Even Buffett might invest in you.
Lol. You crack me up! The trades arent that complicated. I know youre jealous and all..but all you have to do is buy calls when bolinger band is in oversold territory and then sell bolinger band gets overbought signal. Its that simple Holmes.
Charles I actually used your strategy this morning and it’s working well. I’ll continue to do it whilst we wait for the top and peters drop to happen. It’s quite easy as long as you keep stops in place. Also I’m not jealous of you. It’s easy to make money with your strategy so it’s everyone’s choice whether to use it or not. You don’t have anything secret that others can’t do.
Charles,
So today, 9/3, with the VIX appearing oversold in the bolinger bands (5 day chart) would you be buying calls? If so, what date 9/19?
I sold the rip!
Looking for a five bagger on this move down.
The ridiculous dive in VIX told me that morning ramp was free money. Looking for a double on VIX 11.50 calls….
A new post is live at: https://worldcyclesinstitute.com/non-confirmation-looking-ahead-to-the-top/
This website is for educational purposes relating to Elliott Wave, natural cycles, and the Quantum Revolution (Great Awakening). I welcome questions or comments about any of these subjects. Due to a heavy schedule, I may not have the time to answer questions that relate to my area of expertise.
I reserve the right to remove any comment that is deemed negative, is unhelpful, or off-topic. Such comments may be removed.
Want to comment? You need to be logged in to comment. You can register here.