Update: Friday, March 31, ~10:20am EST
Above is the 60 minute chart of ES. A quick measurement this morning shows an option of reaching up as far as 2376 for the top of this B wave. This would allow the c wave to reach 1.618 X the a wave. It will be down from there.
There are two points now for a top, either 2367 or 2376. The bullishness this morning tends to point a bit higher to the 2376 level.
_____________________________
Market Update for Friday, March 31, 2017
CHART SHOW Signup
Market Update for March 31, 2017 |
_______________________________
Market Update for Thursday, March 30, 2017
CHART SHOW Signup
Market Update for March 30, 2017 |
_______________________________
Update: Wednesday, March 29, Noon, EST
Above is the 15 minute chart of ES. I mentioned in the video last night that we have the option of heading up to the 2366 area, which is the 62% retracement level from the very top. That looks like where we’re headed and it will likely take the rest of the day to get there.
Hitting the 62% level would make this large wave up from 2317 a B wave. So the wave down will be at least as long as the A wave down (the entire flat) and would target at least 2285 (and probably lower).
This first leg up looks like a zigzag (an A wave) and a B wave. Extending 1.618 from the A wave (that would mean the A=C wave length) gives a target of 2366. So there are two different measurements targeting the same spot. Down from there to a new low.
________________________
Market Update for Wednesday, March 29, 2017
CHART SHOW Signup
Market Update for March 29, 2017 |
_______________________________
Market Update for Tuesday, March 28, 2017
A bit longer tonight: my apologies. A market somewhat in disarray, but I wanted to spend a bit of time on the bigger picture and how I see the various markets working on getting aligned once more for the final wave.
Market Update for March 28, 2017 |
_______________________________
Update: Monday, Mar. 27, 1:40pm EST
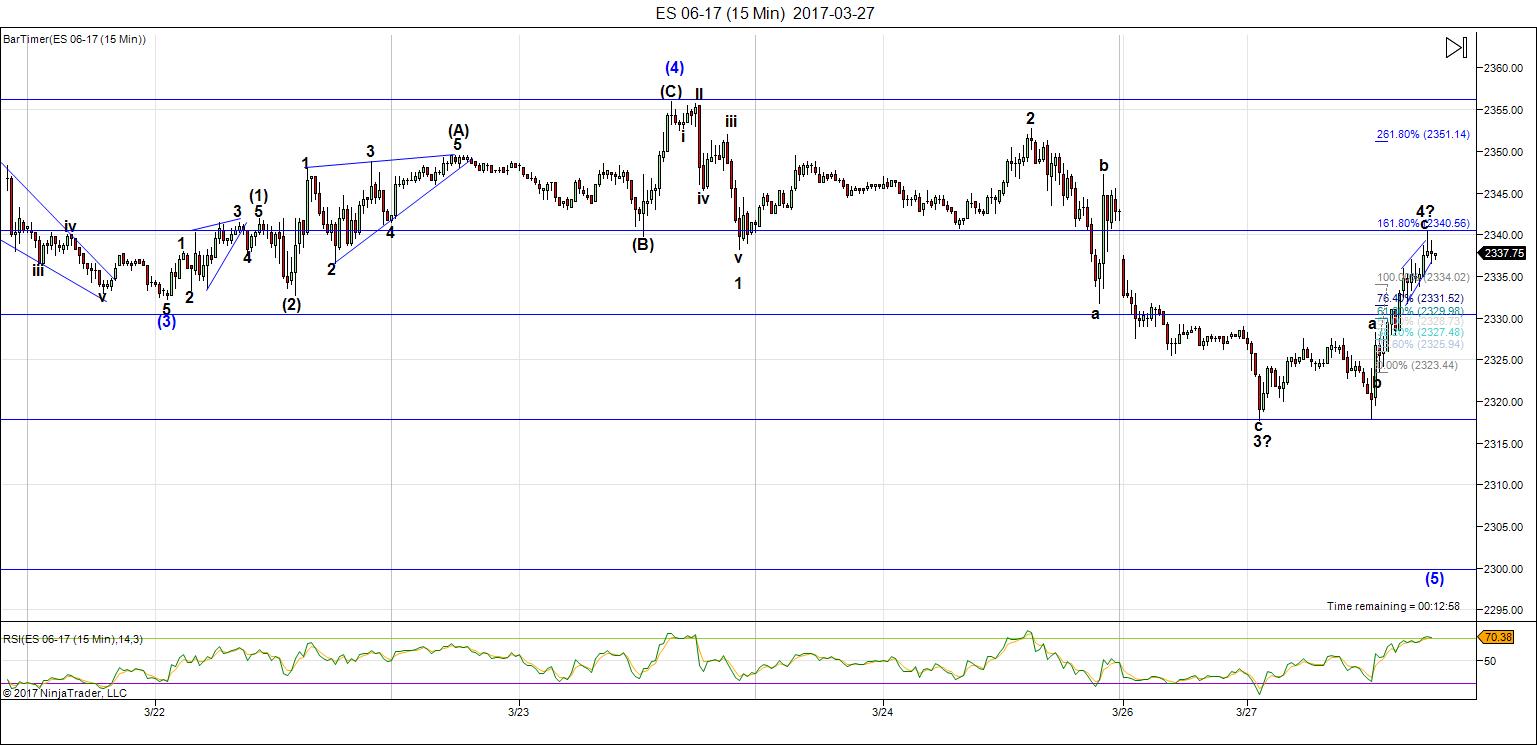
Above is the 15 minute chart of ES, with a revised wave count. I’m not sure of the overall pattern and count at the moment, but the 3rd wave down yesterday and this morning is in 3 waves. I’m expecting another wave down from 2340 and I’ve got a target still of about 2300.
The wave up this morning is in 3 waves, with the C wave 1.618 X the A wave at 2340/1.
Keep in mind that if this fourth wave in ES drops as far as 2300, looking at the structure of the entire set of waves up, that may be all we get. This flat is an abc wave on its own, so we might go right into a fifth wave up.
I put the entire structure in the corrective realm, which means there are no real rules as to wave lengths and the entire structure looks somewhat “wedgy.”
___________________________
Last weekend, I warned of a potentially dangerous trading environment in the US indices. The pattern was uncertain and we could have gone either way.
We only had a couple of options. ES/SPX was either in an ending diagonal, or we had the possibility of a flat (3-3-5) down to a new low. We got the flat—well it looks like a flat, but it doesn’t look complete. I caught the turn and commented on it just as it topped, but it came down so fast that it was difficult to capitalize on.
And now? Well, we’re not much further along in knowing the short-term direction in the US indices. In ES, the flat does not look complete, and technically, the ES/SPX indices are still in a smaller 4th wave, sitting right on the 38% retracement level within the larger wave 3. That means that we’ve completed the fourth wave of the third only so far.
So … we can go up or down at this point—the signals are mixed.
Other US indices are also sporting mixed signals. The flat looks complete in the Russell 2000 and 3000. In the NDX, we look to be tracing out a zigzag after a double top. This weekend, it’s suggesting a C wave down to a new low is next. That would suggest a continuation down for ES/SPX.
So, rather than guess, let’s sit on the sidelines and let the market tell us the next move.
Currencies, gold, silver, bonds … not much of a puzzle there. They’re all in corrections of one type or another.
So here’s my recommendation:
Fourth Waves are my LEAST Favorite Waves. I try to stay away from them, as they’re very difficult to predict, just like the one we’re currently in in SPX/ES and their sister indices. My recommendation is to sit on your hands until we see the next move in the US market.
In this weekend’s video, I go through the options and my concerns. In the meantime, we’re moving towards set-ups in currency pairs. The best ones are:
- EURUSD
- GBPUSD
And there are set-ups now in
- gold and silver
- oil (after the next correction, I think)
Patience will be key as we wait for the rest to US market to show its hand.
The Longer Term Picture
Last weekend, I took many hours to review the market and in particular a look at longer term projections, with measurements of all the key indices and currencies. I’ll be adding a longer term prediction video to the post this weekend, once we see the next move in currencies. I’ll let you know when it’s available through comments.
As you know, I’ve mused that we’ll either top in June or September. I think I have a clearer answer now as to what the time frame may be.
______________________________
Here’s the latest daily chart of ES (emini futures)
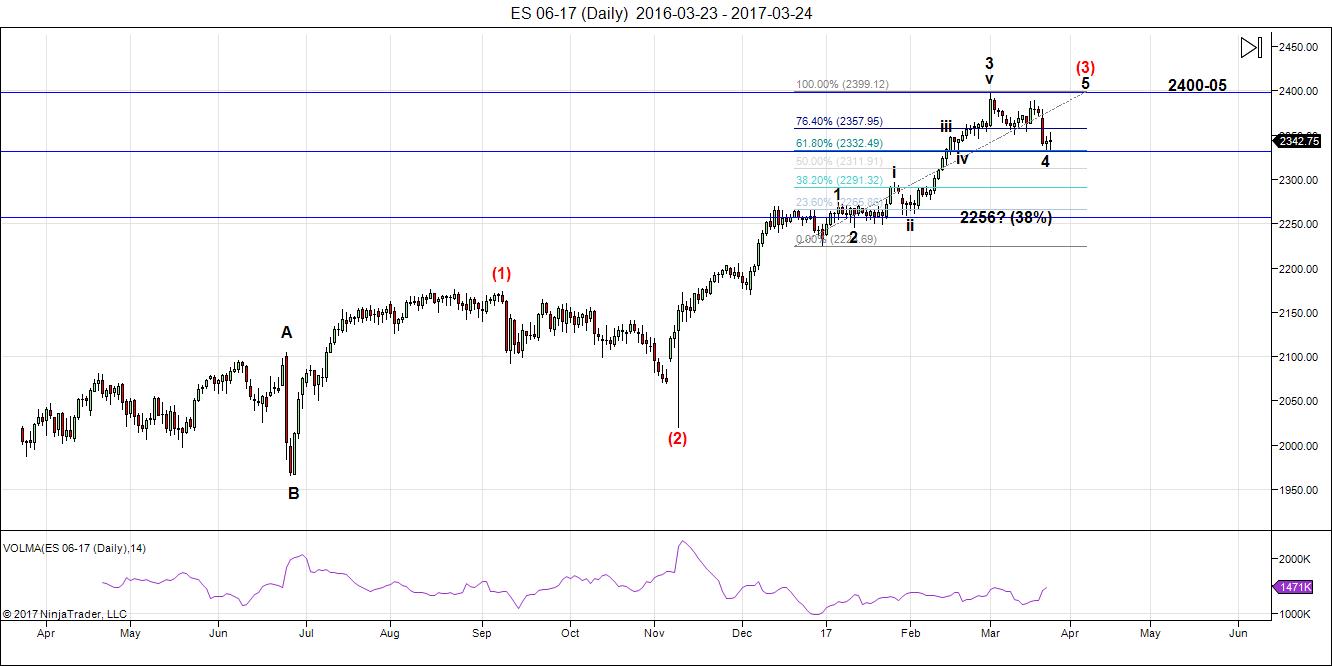
Above is the daily chart of ES (click to enlarge). The big question this weekend is “What wave are we in—the fourth of the third wave or a larger fourth wave of the entire C wave structure up from about 2006 in the SP500 from the turn in early July, 2016?”
As I write this, I’m expecting a further drop in the current wave in ES, with an open lower in SPX perhaps Monday. However, this drop may not be enough to signal which fourth wave we’re in—the fourth of the third or the larger fourth wave.
However, both situations require a rally. If we’re in a larger fourth wave, the rally will likely retrace only 62% before we get a larger C wave down to a new low. The eventual target for a larger wave 4 is 2256, but there are also options for patterns that may not reach that level.
If this is wave 4 of 3, then we’ll head back to the top.
Summary: We’re at an inflection point. We’re either still in wave 4 of 3, or we’re near the end of the A wave of an ABC drop into a larger 4th wave. We should have a good idea which it is early this week.
After completing the larger fourth wave, we’ll have one more wave to go, which could be an ending diagonal as a fifth wave. The long awaited bear market is getting closer.
_______________________
Here’s the latest HOURLY chart of ES (emini futures):
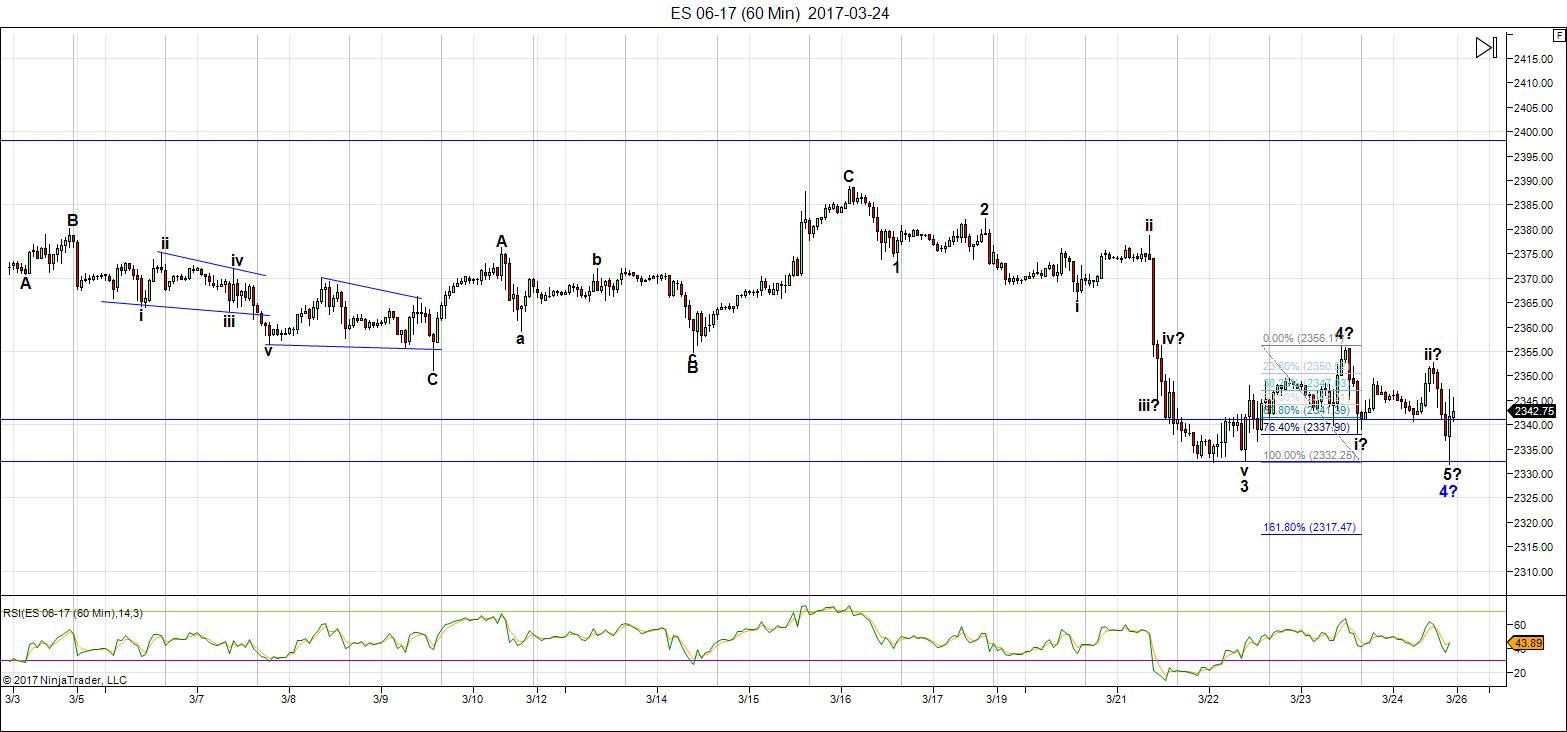
Above is the 60 minute chart of ES (click to enlarge). Please watch the video to get the full story on what’s happening short term.
This past week, the market suddenly came down in a what appears to be a flat, but it’s not quite complete. Technically the C wave has completed 5 waves. However, the fifth wave does not look complete and I expect more downside. The C wave 1.618 X the A wave down would target 2312.50. That’s a typical length for a C wave of a flat.
Flats eventually completely retrace. However, they can also be part of a combination wave, with a triangle or a zigzag as the next following pattern (or even another flat).
There are too many options to be sure of the next move.
_____________________________
Some housekeeping:
Andy Pancholi Turn Dates (March, 2017)
- SP500: Tu28/W29
- EURUSD: Tu21/W22
New Free Blog Post: The Cycle Turns on Canadian Banking
The Chart Show sign up is live for Thursday, March 30. You can sign up now in the usual spot: Webinars
________________________
Here’s a video overview of the market for Monday, March 27, 2017
Market Report for March 27, 2017 |
_______________________________
Charts Going into Monday
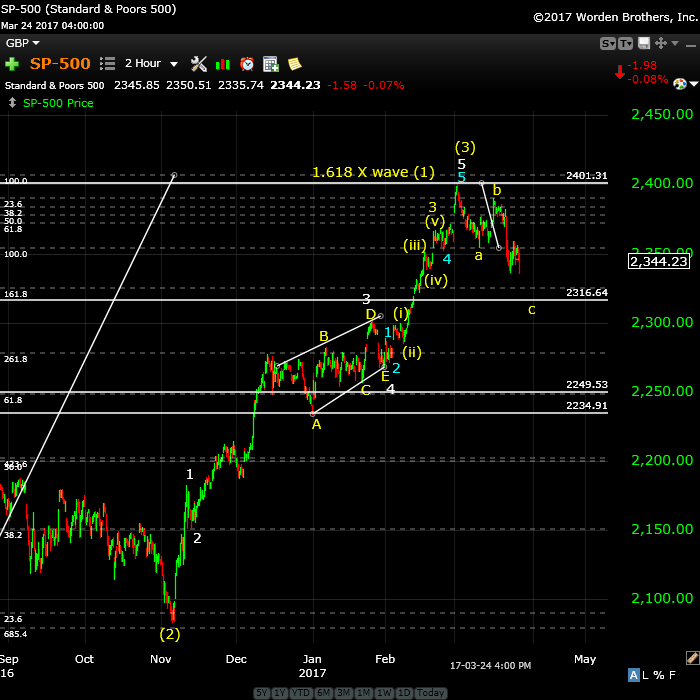
Above is the 2 hour chart of SP500. As with ES, we look to have almost completed a flat. However, the C wave down does not look complete.
A C wave may continue down to the 2316 area. That would suggest that we’re in the larger fourth wave. The next move up would be a B wave correction, which would likely retrace around 62% before heading back down in a much longer C wave. Best to wait for that opportunity, should it arise.

Above is the 2 hour chart of SPY showing the same pattern as ES and SPX. I project a possible bottom for the flat of about 231.95, which would then likely produce a B wave corrective bounce.
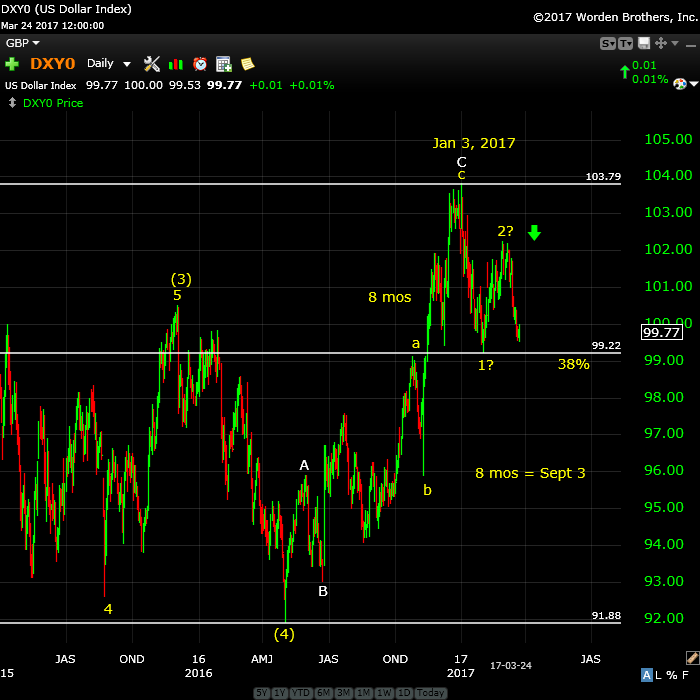
Above is the daily chart of the US Dollar. No change here in terms of my prediction.
On a near term timeline, we may get a retrace here, as I suggested last week. It hasn’t happened yet, but it may still. We need to get to a new low (below 99.22) to confirm that we’re in a third wave down.
Longer term, 1.618 X the first wave, (the target for the third wave) is somewhere close to 94.83. The movement of the dollar determines to movement of just about everything else these days. The longer term target for this wave down is 91.88.

Above is the daily chart of EURUSD. The bigger picture is that we’re headed up towards a target of 1.16 and change before we get a really major turn down. We need to reach a new high above 1.08247 to confirm we’re actually in the third wave up. More in the video.
The wave up looks motive, but very choppy, with lots of overlapping subwaves. However, I can make a case for 5 waves up.
Shorter term, I’m expecting a retrace perhaps as much as 62% (~1.0624). The other currency pairs also are either in a corrective wave, or just entering one.

Above is the 4 hour chart of USDCAD.
I’m expecting a C wave to continue to the 1.34373 area (62% retrace level of the five waves down) before a turn down into a third wave with a target of 1.30108 (for starters).
The longer term target is 1.19. This is the best set-up I see anywhere, but we’re not quite at the entry level. Let’s look for it in the next couple of days.
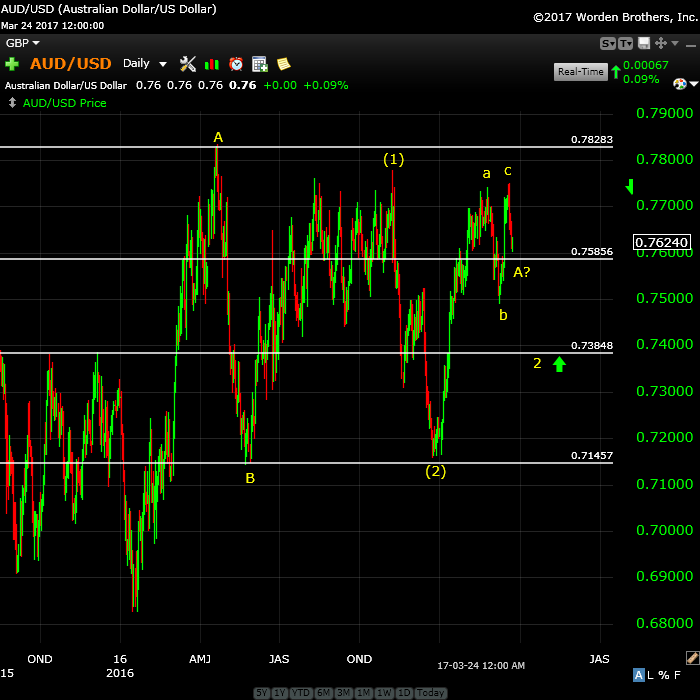
Above is the daily chart of the AUDUSD. The chart above is the bigger picture to my short term projection in the video. No change in that respect. However, the shorter term direction is starting to get much clearer.
In the shorter term, we did not reach a new top beyond wave (1) so, in fact, my original count is correct so far. This wave up looks like a “5” and if so, should correct to my original target of 0.738. We have an a wave down and it looks like we’re about to trace out a b wave. .73848, if we get there is a perfect set=up for a long entry for the final wave up to the eventual target.
I’ve an eventual top target of .828 for this pair, which is just shy of the 38% retracement level of the entire larger wave down (from the year 2011), which would make this wave 4.
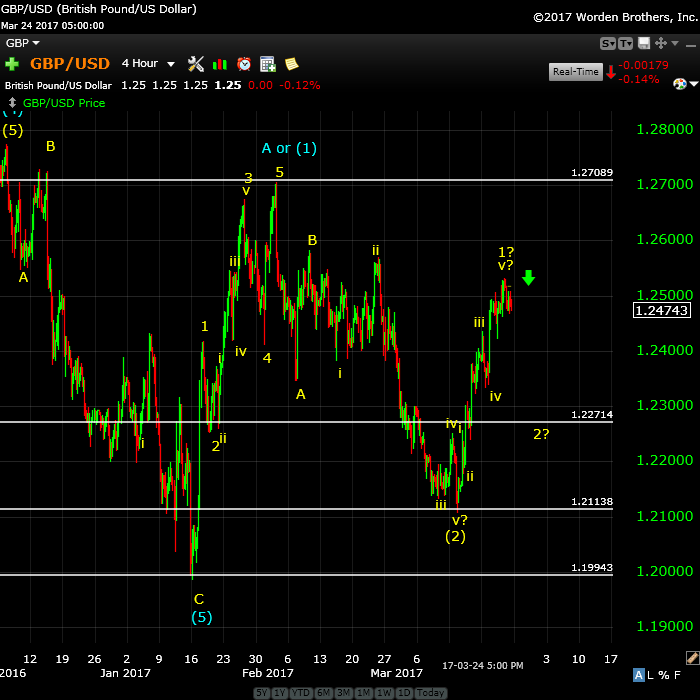
Above is the 4 hour chart of GBPUSD. I can count 5 waves up in this pair and similar to the other currency pairs, it looks like we’re headed into a correction. If we drop down 62%, the target is ~1.22714, which would be an excellent entry for a long play up to the 1.52 area.
The one thing that bothers me is that this wave has not reached the level of a previous 4th wave, and so we may only retrace 38% and put in a fourth wave here, a larger retrace to come later.
More information on the short term prognosis in the video.

Above is the 4 hour chart of USDJPY. I would be cautious with this pair. The count shows three waves down from 118.62, with the A wave down to ~11.66 looking very corrective. This suggests to me that our target is the top at 118.6. However, it’s been that way for awhile now and we haven’t turned up in a serious manner.
I would not play here unless I saw 5 clear waves up at small degree (5 min chart) and then 3 down. We completed a double bottom on Friday, which helps the bullish prognosis. We’ll just have to see what happens.
Opportunity! Above is the daily chart of gold. We’ve completed a very rapid fall into an “a” wave as predicted and a “b” wave as predicted. On Friday, we looked to have completed a small degree lower high. This commodity (and silver) is ripe for a larger turn-down into wave “c.”
Because of the height of the “b” wave, my targets to the downside have changed slightly. I’m looking for a minimum of 1182.56 (same length as the a wave) and possibly much lower. We may end up with a double bottom, but I’m not going to call this until we drop below the current target. We’re looking for 5 waves down.
When we reach our target, we’ll turn back up. The final upside target is around 1585.
Opportunity close! Above is the daily chart of WTI oil. We dropped like a rock from the sideways action that went on forever and we’ve completed 5 waves down.
My measurements and the underlying wave structure are suggesting this wave down will be in 5 waves (the first part of an eventual zigzag. In that case, I’m projecting a turn up here to about 50.64 (a small 4th wave), then a turn back down to about 43.00. That should end the A wave.
Then, I’d expect a turn up in a B wave to somewhere around 51.50 before a turn down in a C wave to our preliminary target of 33.00.
Finally, we should get an E wave up to the upper trendline to complete the larger pattern. That would be followed by a final 5th wave down to a new all time low.
Good trading!
_______________________


Peter, I’m still trying to figure out how this could possibly be the bigger wave 4 when SPX only had three waves up in wave 3. Shouldn’t there be 5 waves up so this has to be 4 of 3 with 5 of 3 to go? Then the bigger 4?
The fourth wave of the third was way back at 2223 for ES. That was where we had what looked like a running triangle. We’ve been in the fifth wave of the third ever since.
The wave we’re considering is the fourth wave of the fifth of the third, which looks to be already in place, based on tonight (and it’s now too large to be that errant wave). That must mean that there was a tiny fifth wave as part of that final wave up. I count the entire wave as corrective, so there aren’t any rules about what the fifth of the fifth of the third has to look like. it looks like a “3” still but that the market we’re in …
A new free blog post is live at: https://worldcyclesinstitute.com/the-cycle-turns-on-canadian-banking/
Gold tonight has gone to what looks like a double top. RSI has a fair amount of divergence on a daily chart. Silver is at the 62% level. I’m still expecting a turn down for both.
Hi Peter
The SP500 is down this morning, any target to reach before moving up?
It looks like we’ve finished the third wave of the fifth. So, I’d expect a small bounce and then another fifth wave down. So perhaps up to 2332 and then down again until around 2300. This is ES.
Measuring, the full C wave would be 1.618 X the A wave at 2311 for this wave down in ES. That may be a better level to target for a turn up. A C wave in a flat is generally 100-165 % or wave A as a guideline, but more often then 165 (1.618) level. I had 2312 pegged for the SP500.
Well, John, I can only think that we’re in some sort of ending diagonal. The third wave down ended up being in 3 waves. I don’t think the downside is over yet, but I don’t quite see the ED yet. I think we’re also at the top of a small one right at the moment – 1-5 min chart.
I placed a chart of ES at the top of the blog, keeping in mind, my count is a little bit iffy at the moment.
Keep in mind that if this fourth wave in ES drops as far as 2300, looking at the structure of the entire set of waves up, that may be all we get. This flat is an abc wave on its own, so we might go right into a fifth wave up.
I put the entire structure in the corrective realm, which means there are no real rules as to wave lengths and the entire structure looks somewhat “wedgy.”
I updated the chart of ES at the top of the post. It looks like we’ll have another wave down. We’ll have to wait to see what the overall structure is, but these waves are all corrective (in 3’s) so far.
The Market Update for Tuesday should be live at the top of the post now. An extremely slow load tonight.
In ES, the wave up has turned into a B wave and I have a preliminary target of 2360, which is the 62% retracement of the C wave of the flat and also 1.618 X the A wave up from 2333. It may go higher, but this should lead to a larger C wave down to the eventual 4th wave low.
There is also a possibility of a turn down at 2350. Another fibonacci ratio.
Looking for a rollover in ES around 2357-2360. C wave down.
The Market Update for Wednesday is live at the top of the post.
I posted a chart of ES. It looks to me like we’re targeting the 2366 level.
ES: The other option is a double top at 2360/1 as the currency pairs appear close to targets and this last wave up looks close to completing a ‘5.’
AUDUSD is at the top of an ending diagonal on a 20 min chart. USDCAD should bottom I think at 1.3316
Peter
Is that it for Cad. Or do u think it’s going back up to 1.343 as hoped for.
No change, as far as I can see …
Should have been 10 min chart for AUD.
NQ also very close to a double/triple top.
The Market Update for Thursday is live at the top of the blog.
ES and SPX look like ending diagonals this morning so I suspect we’ll get a high above the trendline (2364 in ES), by a point or two.
ES/SPX looks like it could still be Wave 3 (now in the 5th and final wave to the new highs we were waiting on). Isn’t that still a possibility? Then the bigger Wave 4 begins?
It’s make or break. Has to head down from here or we are back to the top. I think back to the top as there is unreal levels of optimism in markets at the moment.
Yeah I went long at 2325 and targeting 2425 for end of 3.
Anything’s possible, I guess, but that’s the exact opposite of what the count says, and my reports. I can give you a whole bunch of reasons we’re going down, but I can’t find a single one that says we’re going up.
And we hit my target this morning (actually missed by one point, but I think that counts).
Having said that, I’m not all that excited by the first wave down in ES, as it looks like a 3, but we need to get below 2349 or so to confirm the C wave down.
The chart show recording is live here: https://worldcyclesinstitute.com/march-30-2017/
ES has a double top now, and five waves down at small degree, so looking good to continue down to a new low.
NQ hit a new high today so wouldn’t that mean it’s still in Wave 3?
That’s what I said in the chart show, yup.
Perfect! Will give a listen tonight. Was tied up most of day today. Thanks Peter.
Peter, wasn’t sure i heard correctly, in the s and p index and the ES, did you say you expect one more small wave up to finish off the B wave?
Thanks
Tim,
I did, but only to do a double top at 2366/7 es, so it’s down from. We’ve done that tiny wave up.
The Market Update for Friday is live at the top of the post.
I’ve placed a new chart of ES at the top of the post. Head’s up that we may get another ten points about the current high to finish off this B wave. 2367 is the 62% retrace level, but the wave structure suggests a possible 2376 as the top.
ES update. I don’t think ES will make it above the previous high at 2367. The subwaves look to be in the fifth wave now. Same as SPX.
NQ also looks like it’s nearing a double top.
ES. This first wave down should end up at about 2348. I would think we’ll get there near end of day, with the second wave retracement slated for Sunday. Then down again Monday. We’ll see …
That takes us to the previous 4th wave and is a fib extension of this first segment down.
SPX is below the up-sloping trendline, ES still has to cross it. Both below will be a big step in confirming the B wave top.
There’s an alternative first wave bottom at 2356.
Well, we’ve done a second wave here, so that likely means that this wave down is the first part of a zigzag. A likelier bottom now is 2333. Then a B wave and the zag of the zigzag after that. This may end up being a complicated wave.
The larger A wave took three weeks from top to bottom, so we may be looking at a similar timeframe for this B wave down.
Wow. ES. So I guess we can’t have a normal topping pattern anymore. Too much Hopium in the water.
Now ES is also below the up-sloping trendline, so I’d say we’ve topped the B wave.
A new post is live at: https://worldcyclesinstitute.com/combination-fourth-waves/
A new free blog post is live at: https://worldcyclesinstitute.com/predictions-revisited/