
The Spiked Top in the US Indices
 All major markets are continuing as one. We’re at a top but the process of changing trend doesn’t happen overnight. The spiked top is the example—tops like this usually don’t last. Trends don’t “change on a dime.”
The waves down are corrective—they don’t look motive. Some reasons why:
- The current C wave (what one might consider to be wave five of the set of waves down in SPX) is of a size that is much bigger than the wave in the second wave position—it doesn’t have the right look of a motive wave.
- The second wave didn’t retrace 62% (corrective).
- ES came down in three waves to a double bottom … that’s obvious.
There are more reasons, but this is a pretty persuasive list already. We need to expect a final new high. In the meantime, we are going to head to a new low.
Options for the US Dollar
Let’s look at an update of the US Dollar.
Last week, I pointed out the fact that the US dollar had completed a small 4th wave up and was ready to turn back down in a 5th wave. That’s happened … but, we’re not done yet.
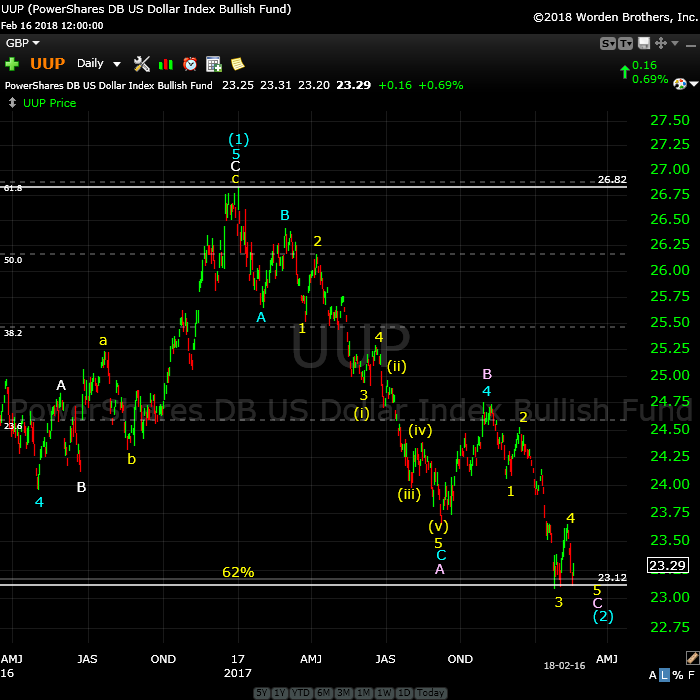
Above is the daily chart of UUP (US Dollar ETF). UUP is representative of the structure of DXY (the US index) and will provide an excellent predictor of the impending top in currency pairs and the US indices.
UUP and the US Dollar index have not reached a new low, while the EURUSD currency pair reached a new high. That’s a non-confirmation … the sign of a sick market. But it also give us a clue as to how the US Dollar bottoming process may unfold.
The waves in both directions are in threes. But since EURUSD went to a new high, a triangle there isn’t an option. However, an ending diagonal is. Both the euro and the dollar seem to be setting up for a possible ending diagonal.
It’s very early in the process, so this is speculative at the moment, but this solution seems to me to be the most probable. In that case, we have some time to go before we reach a slight new high in the US market (a new low in the the US Dollar).
The movement of the dollar strongly influences the movement of just about everything else, so it’s important to pay attention to what it’s doing on a large scale.
___________________________
Apple Rebounds (as predicted)
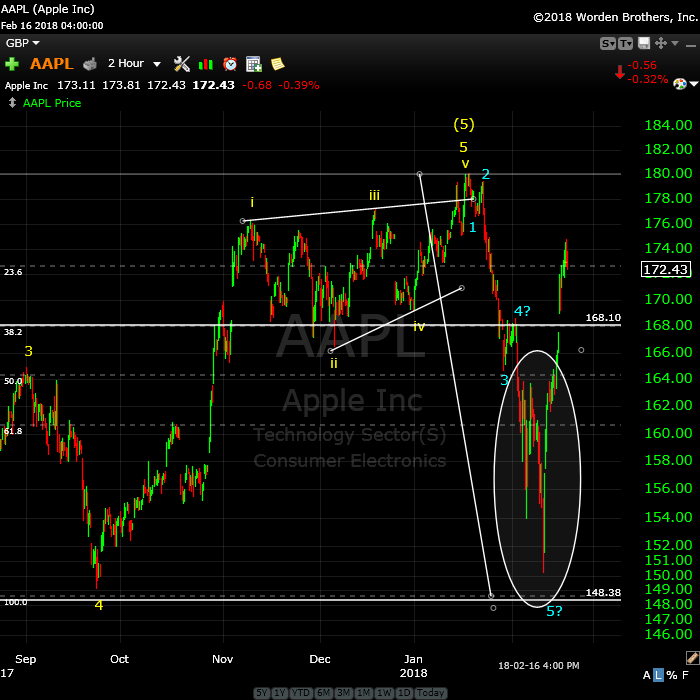
Above is the 2 hour chart of AAPL.
Last weekend, I showed this chart of AAPL and suggested it might be a fourth wave, certainly if it didn’t reach and exceed the previous fourth (which is always a key test of a first wave down).
During the week, it became obvious that we weren’t going to get there as the wave became obviously corrective. You can see the overlapping waves in the circle on the chart. That meant we were headed for a new high. However, this wave down is a fourth wave and the new high will be the last one.
A Change in Direction for Bonds
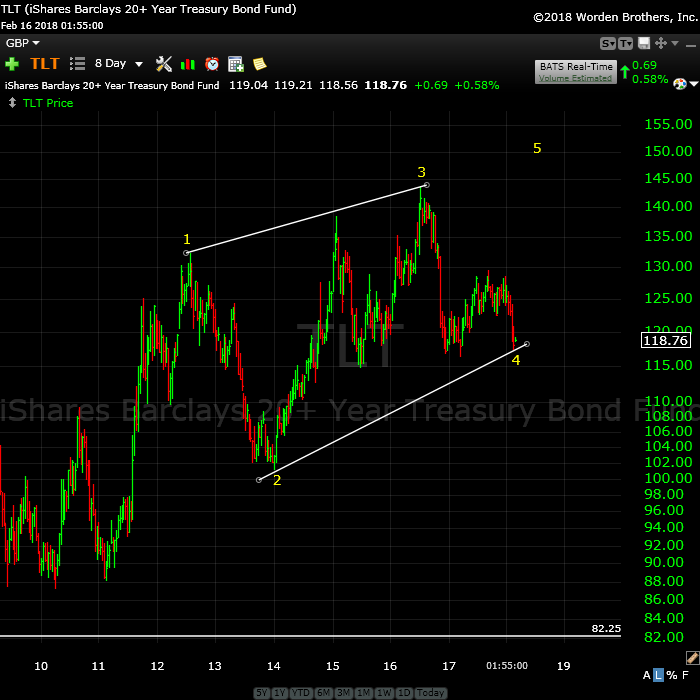 Above is the 8 day chart of the 20 day US treasury bond fund (TLT). If you’ve been in the Chart Show recently, you know I’ve expressed concerns about the structure of the most recent waves down from about 130.00—they appear to be corrective.
When I also look at the 10 year yield chart (below), it became obvious that we’re about to turn.
In the chart above, it looks like the ending diagonal has just completed a fourth wave down, rather than being complete. This is a much better looking configuration for an ending diagonal than what I’d originally shown.
As a result, I’ll look for a turn up here to a new high above 145. However, if we turn down from here (below 116, then we’ll keep heading down).

Above is the 8 day chart of the 10 year treasury yield (TNX). I’ve been following this for the past few weeks and have projected a turn at the 30.42 level. We’re almost there. (yield charts move in the opposite direction from bond fund charts).
Taking both these bond charts into account, it looks to me like we’re about ready for a turn down in yield and, at the same time, a turn up in the fund.
Look for a turn down in TNX, with an eventual drop to a new low.
Registration for Commenting
Want to comment? You need to be logged in to comment. You can register here.
If you register, it protects your information. It also allows you to comment without filling in your information each time. Once you’re registered, simply go to the home page and click on the login link top right in order to log yourself in. Usually, you’ll be logged in for several days before needing to be logged in again.
______________________________
Problem receiving blog comment emails? Try whitelisting the address. More info.
______________________________
Rise above the rest … SM 2
Rise above the rest …I have only ever met a few people who, in their chosen fields (astrology, medicine, music, martial arts, technical analysis), rise above all the rest and you are one of them…you have ‘the gift’…and that’s why I’m a Trader’s Gold member. —SM |
A true expert in Elliott Wave FL 2
A true expert in Elliott Wave …You are a true expert in EW analysis. What you provide is not available anywhere and is priceless. Subscription on your services is the best thing I have ever done. Many thanks for your effort to make me a better investor. I now have more trust in my investment decisions. I hope you will continue the excellent work! —FL |
Tops in your field DZ 2
Tops in your field …You are tops in your field. Tried to follow Elliot Wave international for years. They were always behind the market. After discovering you, I perceive that you are an expert in reading the waves, which puts you way ahead of the rest of your peers. And you can read the Waves like you are reading tomorrow’s financial section. I pray you stay healthy. —DZ |
Get an upper hand … JC 2
Get an upper hand in trading …Seeing all the different currency pairs and the wave structures and hearing you explain why this has to do that on a nightly bases gives one a upper hand when trading. Elliott Wave applies to all stock and indices and can be applied to any candlestick chart. If someone ask what you want for Christmas – Tell them a membership to Peter’s “Traders Gold!”—JC |
Have not had a losing week RW 2
Have not had a losing week …I have been with Peter almost a year. The only thing that matters is have I made money with his service. I think I have finally turned the corner using Peter’s EW. I have not had a losing week in the last 5 months. Thanks Peter, for your amazing amount of hard work. —RW |
the real deal SM 2
The real deal …‘Educational, insightful and thorough market analysis for all levels of traders. It’s Elliott Wave at its best….Peter Temple is the real deal’ —SM |
The best of them JL 2
The best of them …Last couple of years, I subscribed to several ‘market traders’. You are by far the best of them and the personal contact is awesome. Daily and daily updates are very well written! Besides your expertise in EW, I also like your cycles analysis. Best investment I ever made! —JL |
Couldn’t be happier … KK 2
Couldn’t be happier …The analysis and insight you provide is simply amazing! I’ve been trading the futures and equity markets for well over thirty years and usually average around 5% monthly. Since joining your Traders Gold Service two months ago, that number has better than doubled. I couldn’t be happier.—KK |
The Market This Week
Here's the latest daily chart of ES (emini futures)
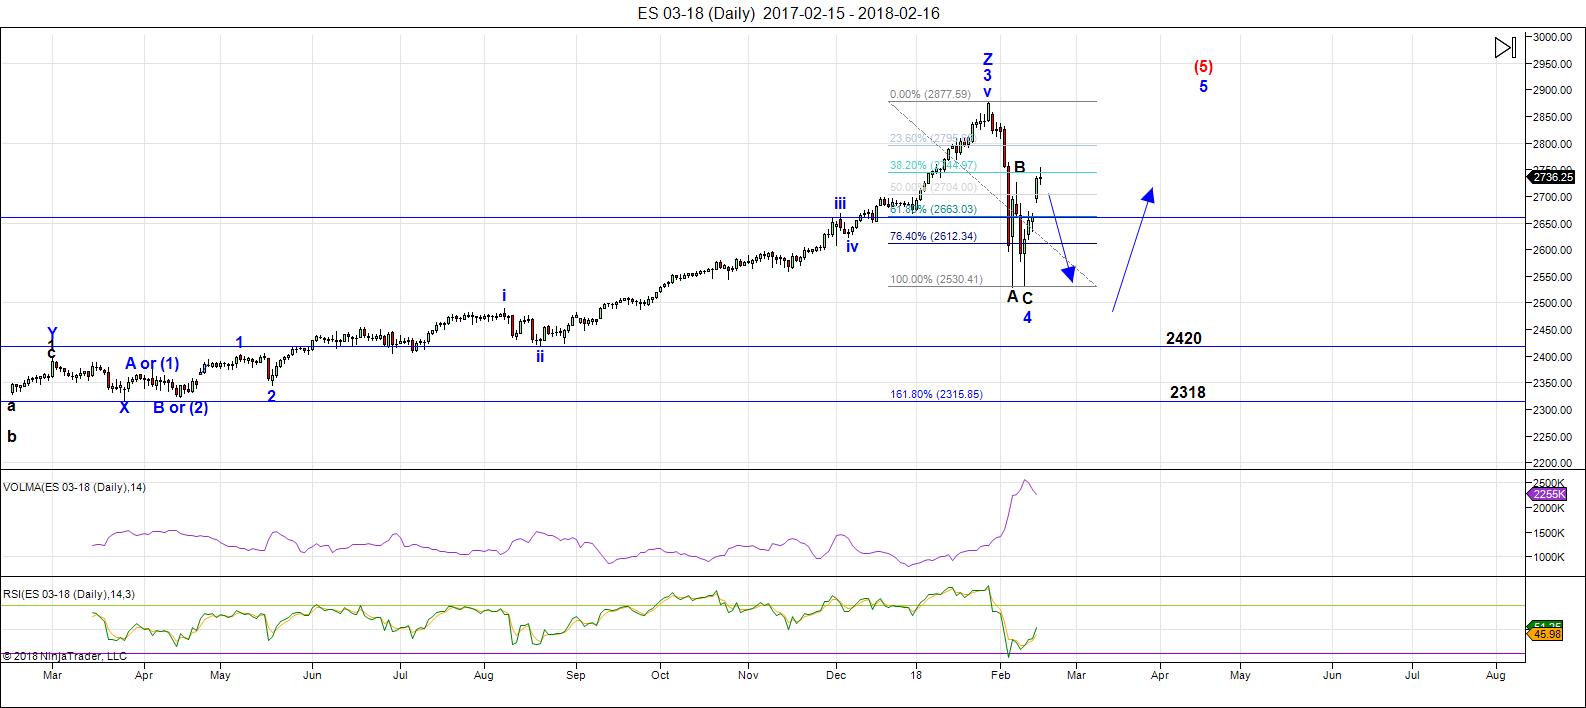
Above is the daily chart of ES (click to enlarge, as with any of my charts).
There are also options for the US market. My analysis tells me that we're in a fourth wave with more downside before we turn up in a final fifth wave to the top. It looks to me as though this last wave will make a slight new top to the 2900 area, if we meet one of the downside targets identified.
I'm expecting the downside target to a new low, which could be a previous fourth wave area (labelling may not be correct on the wave up to the current top). There are other measured options for a bottom, but the levels shown in the chart seem the most probable.
Volume: It remains high, as expected.
Summary: We've turned down across the US indices, but this appears to be a fourth wave down with a C wave still to go. We'll look for a turn there and a final rally to a new high.
___________________________
Trader's Gold Subscribers get a comprehensive view of the market, including hourly (and even smaller timeframes, when appropriate) on a daily basis. They also receive updates through the comments area. I provide only the daily timeframe for the free blog, as a "snapshot" of where the market currently trades and the next move on a weekly basis.
______________________________________
Sign up for: The Chart Show
Next Date: Thursday, March 1 at 1:00 pm EST (US market time)

The Chart Show is a one hour webinar in which Peter Temple provides the Elliott Wave analysis in real time for the US market, gold, silver, oil, major USD currency pairs, and more. You won't find a more accurate or comprehensive market prediction anywhere for this price.
Get caught up on the market from an Elliott Wave perspective. You’ll also get Andy Pancholi cycle turn dates for the SP500 for the balance of the current month. There’ll be a Q&A session during and at the end of the webinar and the possibility (depending on time) of taking requests.
All registrants will receive the video playback of the webinar, so even if you miss it, you’ll be sent the full video replay within about an hour of its conclusion. For more information and to sign up, click here.


excuse my ignorance, Peter T — are you saying we going to a NEWER low from THIS Feb 9, 2018 low ? on the $SPX 2532.69 — 2420 target ? or 2315.35 target….before we make newer 52wk Highs ?
…or are you looking for the 50% retracement (2704) / 61.8% (2663.03)
tia
Pretty sure peter is implying we must test the lows before the final 5th wave up, if you look at the arrows I am sure this is what is meant, which would make sense as most if not all are thinking the market just propels higher.
The majority must be wrong and should what I believe peter is implying happen, i.e. new lows below the feb 9th low the majority will become bearish calling for the “big crash” only to have the rug pulled out again as we move to new all time highs denoted by peters 5(5)
hopefully I am correct in reading peters above chart, hope that helps.
The current wave up is corrective, and yes, I expect a new low – a C wave.
Yeah … I think I have the same question.
“. In the meantime, we are going to head to a new low.”
Not sure I follow how that happens if wave 4 is complete, as implied above.
That lower low could fit a larger XYZ correction idea, where abc ended X.
I agree that bucky will be dropping again soon, which should propel SPX further north before we do the lower high. But I don’t know how far to push the DXY SPX relationship either.
He also said it would be a C wave, which implies it must exceed the wave A low, unless truncated.
The change in bond direction is very noteworthy. A lot of analysts thought the diagonal ended in September and I remember a long article by Prechter confidently asserting the end of the decades old bull market in bonds. I also remember at first being unconvinced of the ED call as price hung out around the end of the bottom trend-line longer than I thought it should. Eventually price did rapidly fall away and there was broad consensus that he had indeed seen an ED. Not very many folk are calling for an upside reversal in bonds as interest rates have been steadily rising recently with they yield curve continuing to flatten. Outflows from bond funds, especially junk bond funds have been massive of late. Of course falling longer term rates could continue with the ten year rate continuing to rise with an ultimate inversion of the yield curve, and that fits entirely well for a march higher in TLT to complete a diagonal fifth wave. As I said, not many are calling for this so if correct, you can beat the crowd getting long TLT! 🙂
Re TLT, I have another modest leg down (after this modest upwards correction ends) first before any major reversal.
Perhaps at TLT 115 or so, we could finish this decline. Late March, if this pattern idea holds up.
Last week, people basically disregarded my BTC & Aug 2015 fractal, both suggesting much lower lows but now the implied C targets means retesting last year’s August or April lows. Sigh.
Not necessarily. It simply needs to take out the wave A low of Feb 9 to fulfill the minimum re-tracement depth. In fact we already visited the area of a one less degree fourth wave so I doubt it will get much deeper than that.
If the dollar has not bottomed, then it must be tracing out a larger fourth wave of some kind. So far the closest thing I can imagine is either a triangle or possibly a regular flat, or maybe even some kind of combination. It certainly is charging higher this morning!
ES in the morning…………..with your coffee, and, as in the case of “verne”, a bowl of stewed prunes……………………. which i might add, are exceedingly high in potassium and iron…….good for you verne!!!…………….good for you………………!
and for liz………………a nice bowl of “red wedding”…………………one trading day late.
https://invst.ly/6p198
i fried up some DXY…………..its like crispy “bacon” without the crunch……
next stop 95ish area…………….my projected blue lines are still in play…
https://invst.ly/6p1gt
with an eye on the long term…………………..https://invst.ly/6p1io
and as for bitcoin,
chart says……………………..be wary of a sharp pullback to the trendline, with a potential retest of the lows…………………………………….. before its blast off time…..once again projected blue lines are still in play.
https://invst.ly/6p1lj
willem’s time chart update……….
black x = inversion…………………….https://invst.ly/6p227
Looking at your DXY second and fourth waves, I guess I could see the fourth continuing a bit longer to give better time and distance with the second wave…not that it necessarily must…that jump off the double bottom looked mighty bullish to moi…!
Prunes!!!! That the ticket! Yum!
In the meantime I am sitting on a massive UUP bull put spread that looks to return some serious coin this a.m., and yes, also a nice helping of GDX puts for dessert! 🙂
…..bull…………….”put”……………………..spread……??? is that similar to that famous aussie favorite – vegemite spread??
i am unfamiliar with option strategies…………although it seems you are on the profitable side of that trade…………
i have a measured move in the DXY to 95ish level before a pullback…………….
verne,
fractal “in play”…………? https://invst.ly/6p2xm
Uh Huh…and that ain’t no bull…!
Hey!!!! What happened to my chives??!!! 😀
are you suggesting………….that i short stiffed you your…..”chives”……
are you inferring that ………….”I”……………….am a “chive” stealer!!!?
do i look “canadian” to you???…………oh come on peoples….wake up….
canadians steal more “chives” per capita………than any where else in the world!!!!!!!!!!!!!
We always knew those Canadians were big a “chive”ers… 😉
All the chives up here are frozen. We’re not talking about it … Canadian chives matter!
I noted with great interest all the sound and fury surrounding the bulls and banksters’ attempt to decisively reclaim the 50 day on Friday. It turns out their bark was worse than their bite, as evidenced by the shooting star candlestick. I suspect they are going to get dragged, kicking and screaming back to the 200 day where it will be make or break time for that cohort…meanwhile the short vol situation continues to simmer….! 😉
Banksters running wild in the Gold futures and DXY. Massive shorting of the dollar and buying of Gold futures. What exactly are they up to hmmmnnnn??
Hi Luri, Thanks for all the support. I am not used to the picture you are showing. But if you want to customy the dates see http://prognoseus500.simplesite.com/
My indicators don’t give a very low today or this week. So we can see perhaps 6980 and thats it. At the end of this day/tomorrow morning we wil get a really up til Friday close. That can be the top for a decline with the LOW on 9 or 12-14 march. But the red line must confirm it.
sorry 6980 must be 2680
ok willem,
i will take a look.
Whatever entity attempting to short the dollar this morning is having its face methodically ripped off as we speak. UUP opened with a gap higher…talk about giving the old middle finger…!!!!
21 Feb at the latest we wll make a lower high,after that down into Feb 27/28.
Not likely it would appear!
Shooting star from Friday confirmed with red candle today.
Certainly nothing resembling short term capitulation in VIX
This is one of the reasons I always ask folk “WHY?!”, and get more than amused when people throw out predictions with absolutely no reasoning behind the claims. Not good! 🙂
I understand why John said 2/27 so I don’t need to ask why.
Good for you. I am just not that smart! 🙂
liz……………….”WHY”……………………. !
why did john say 2/27th?? does it have anything to do with “jenny craig” and the color red???? if yes, nod only once………………..if no……..then pleeaaaaazzze tell me!
Joe,
Not sure you will be able to read this…I know you are in Hawaii. I am wondering if you still believe we are “on track” to what you believe is happening. You shared a “chart” which was a composite of 5-6 or more stock indices. Everything from the Dow Indusrials to the $SOX rolled into a single “Joe Index”. It pretty much “nailed” the Top in late January.
Did the “Joe Index” have 5 waves down? You mentioned in your post of February 14
That we were perhaps in a 3 wave rally or the A wave of an ABC and you felt the A wave would end between 54.5% to 61.8% retrace of the decline off the peak. That “happened”…at least so far.
Also, you mentioned that February 16th was an important date. The market reached the 54.5-61.8% retrace you felt would happen on February 16th.
Big question is…How do you see the Full Moon of early Marcn followed by
March 17-21 (your focus) fit into the ABC rally? I believe you mentioned that March 17th (something to do with Mars-Uranus) could be Swing High. Would you still be looking for that 20% downside risk from this mid-March high into April 4th?
Not looking for trading or investment advice. Your work accompanied with
Peter T’s EW analysis is quite extraordinary. I hope you have time to respond.
https://invst.ly/6pnq6
Looks to me like the bulls insisted on a re-match over the 50 day dust-up…I guess the first A– Kicking was not sufficiently punitive so the came back for one more…! 🙂
verne,
when Lucifer “run stops” to the upside, usually is a set up to drop prices……..as well, when Lucifer “run stops” to the downside, usually is a set up to pump prices…..
focus will be on FOMC minutes release,,,which – because of the stop runs to the upside, indicate that the minutes will be “hawkish”/inflationary……… we shall see
Today the market should make a turn downwards, I use all kind of indicators.
The most important are astrology and the tides so we will wait and see what will happen.
Goodluck to all.
i will be watching for that reversal john…….
i adjusted the blue “A” and “B” downwards…………….to reflect …….john’s reversal…………………..
i shall call this chart…………………………john’s reversal chart
https://invst.ly/6poij
Three successive days of gaps higher in UUP…my it’s frisky!!
holy …..wC……topping tails …….batman!!!
take a look at that tail!!…………….https://invst.ly/6pqvq
and the DXY seems to have upward potentials to 95 price target before a pullback!
john’s reversal is ALIVE AND WELL! https://invst.ly/6pr84
I spy the 2 horns I was looking for on the /ES, 2/16 & 2/21 HOD. May the BTC downward fractal commence presuming you’re on the bearish camp. https://worldcyclesinstitute.com/the-big-top-fake-out/#comment-28024
liz……
i am “late” to the party…………………………….and well, ok…….we are both wearing the same DRESS!!!………………………..and then i woke up!! ….ahhhhhhHHHH! complete nightmare….
I got “zoinked” by going to your charts you posted…….what i understand is that the ES is following the bitcoin…………with a lag time…………………….. so are you expecting a 70% drop in equities to follow in line with the bit coin??
remember i posted yesterday…………that the potential is there for a pullback for bitcoin to the trendline……….and to retest the lows………………
would the second horn be the B wave on my [cough]……………amazing……..and somewhat “tasty” chart? https://invst.ly/6prde
btc Sun, 12/17/17 == /es Fri, 01/26/18
btc Sat, 01/06/18 == /es Fri, 02/16/18
But I look at the the 4-hr & 1-hr charts to see if fractal is still working.
liz…………..it seems your thesis has a great deal of accuracy.
for you, i have overlayed the ES onto the bitcoin chart……….and “voila”……..
for the public record, i am forever calling this the LIZ overlay!!! https://invst.ly/6pril
the purple line is the ES overlay……..and i was pointing out the second “horn”…………………on the bitcoin, as well as the ES………
I love your chart Luri. Your devilish horn on the daily works too but the 2 horns I was talking about was on the 1 hr btc chart Jan. 5 & 6 HOD.
yeah,
sorry about that liz……….that double horn [expanded flat??] pattern was smoothed out on the ES………..due to scaling issues……..
the horns aside…………..the correlation of the two is remarkable…..
the bitcoin drop 12%ish on the first drop……the had two horns…..
the es dropped 12%ish on the first drop……..and the two horns
the bitcoin then drops 70% to the lows…………….
the ES will be expected to drop 70% ???????????????????????????
If a third wave, why not?
It is clear to me that the sheeple do not understand the full implications of a VIX 20 handle with equities at these redolent levels. Reminds me of Wile-E- Coyote over the edge of the cliff…legs furiously churning and…well, you know…. 🙂
Very cool chart Luri
So we saw the second top, now it becomes interesting, we have a change in the tides on feb 24 but the astropoint from today has a turn on Feb 27.
http://www.tides4fishing.com/us/new-york/new-york-city-east-41st-street#_tidal_coefficient
tidal_coefficient
So Liz,
You look at the fractal in the analogy SP/Bitcoin , you do not count the days because they are not the same?
John,
Like with others, e.g., TSLA, FB, IYT, I can’t rely on day counting alone for estimated swing highs and lows.
BTC trades 24×7 even on holidays (I think) hence I rely on the charts.
Feb. 2 was not a good day to be long the indices. 2/2/2+0+1+8 –> 2/2/11
Tomorrow is Feb. 22. Wondering if triple 2s will cause the ice floor to crack?
Thanks Liz,
Nice when it works out this way, tomorrow is also Andre’s low point.
I hope we will see him back on this blog.
How nice you are very intuitive with numbers,,,,
I think we will see a pulback after that up again till… March 7..
goodluck.
DXY update – https://invst.ly/6ps-a
dax here…………………………………..get yer DAX heeeerrrrreee!
do you want a shnitzel mit that DAX ……gender neutral “sir”………..?
https://invst.ly/6pt-b
Mama Mia!! DAX’s a SPICY meat-a-ball!!! 🙂
Luri, may the easter bunny protect the ducks. If anything needs to be annihilated or rather de-fanged, it would be the bloated fannt- fb, amzn, nflx, nvda, tsla. https://tenor.com/view/annihilation-gifs-fear-beast-trembling-gif-10550604
liz,
by …………..”duck”…………i am most certain you are speaking of ……”canard à la rouennaise”…………………and by……………”bunny”……………….it can ONLY mean the german…………………..”hasenpfeffer”………………………..
sounds “delish”………………………although………………your gender neutral personal assistant DID tell you i was……………………………………………….vegan…………………..non???
…….and with that……………i give you the morning ES………..for the public record this chart is using the heiken ashi candles in the 60 minute time frame..
https://invst.ly/6q1dx
oh yes……
and the ………….”LIZ OVERLAY” chart…………….i tried a close up at the 5 hour time frame………………………………the best i could do without losing the scale…
recall, the purple line is the ES…………and the scaling is in %’s……..
https://invst.ly/6q1k2
sinabung —eruption!!!
electrical equilibrium…………………………means…………………… bullets and beans baby!
close up of ES…………………..and a price dislocation warning initiated.
https://invst.ly/6q2yt
hmmmm…..
a different look at the ES………………….”c wave?”
https://invst.ly/6q5mh
or a triangle??
https://invst.ly/6q72n
Sellers seen at /es retrace to Feb. 20’s VPOC and incidentally also 61.8% retrace from yesterday’s fomc high and after-hours low.
Hmmm, I see your 2666 Luri. So far no red wedding yet. We only got hors d’oeuvre from yesterday’s soiree.
The confluence of the SMAs is really fascinating to me. The 20, 50 and 200 plus the rounding top from Feb 9 low looks so similar to the 7/9/15 low w/ the 20 & 50 sma kissing each other.
Difficult to get long because of the potential downside risk.
liz,
i am heavily leaning toward the triangle formation…….
as above you can see the first wave B is a triangle that occurs at a zone of wave 4’s that occurred on the upside……[the two close orange lines running through the yellow circle……………
this wave B is of degree size larger, but is also playing out between a zone of wave 4’s that occurred on the upside………[the two red lines with price labels]……………………………. this is fractal behaviour.
i am expecting the E wave to fall very short……..
https://invst.ly/6q7pz
You might want to consider a flat.
Peter, here is an example of the flat you’re refering to?
https://www.optionszone.com/images/gallery/bullish-chart-patterns/ascending-triangle.jpg
Continuing with the July 2015 fractal, short green candle printed on 7/22/15. And today is 2/22! The swing low was 7/27/15. If the timing follows through then:
7/27/2015 200sma retest or 78.6% fib retrace holds = 2/27/2018, John’s swing low.
chop, chop, chop
8/12/15 200sma breach == 3/12/18 ??
8/18/15 swing hi == 3/16/18 opex
The 4-day red wedding begins 3/19/18??
Nope, but try this: http://www.elliottwave.net/educational/basictenets/basics3.htm
My dates are:
A low on Feb 26/27,( today same patern like yesterday down ,up, and later down again break the 2700 floor?.
After that up again till March 7.
So March 7 will be important a serious brake to the down side?
O.K. today the last HIGH and then we go down till the end of 28 feb.
1 Feb is big up so be prepared. http://prognoseus500.simplesite.com/
After that is a big decline But wait until the red line confirms it.
Astrology gives the 9th of march as turning point to go to the same as the beginning of the year but not for long. So we must go up after the 9 march with big numbers. Other indicators also gives 9 of march or 12 march as turn higher.
March 9-12 could well be a high of some significance…
My near term indicator is far more simple, althoughI hav to say I am amazed at those of you who can glean useful market information from external sources. For me, below 50 day is near term bearish, above, bullish. It will be interesting to see how the various predictions play out.
whooooaaaaa…..there verne…………………..dem is “fightin” words…….!
if you make it too- too ……….simple…………..then what are the “complicates” supposed to do for a living……….- huh……………..”what??”
……………and the sun rises…………………………
ES…………..https://invst.ly/6qlxi
I like your FIPLuri. Let’s see how long the charade lasts. Perhaps 11:11 then slip down the ice again?
liz……………..
do you “really” like my FIP??……………….thanks…….it was hand sewn, in silk………by the creative house of “Dianne Von Furstenberg” ………….cool huh! :-))
Oh. I thought the house of Van Gogh. 😛
I didn’t know Potus will have a televised speech. Markets may stay green until he finishes. Needs it to stay green as a big, beautiful background for his “Highest Stock Market EVER” speech.
Big, beautiful rally!
No offence dear luri. I was not being at all sarcastic, but sincere. Take for example Tom’s energy charts, I think he is batting above 50%…
VERNE…..
i know………………………..!
and because…………and only because……… you are correct…………….!
https://invst.ly/6qqmw …..ES
or
https://invst.ly/6qqnp …….ES
l have some reservations about an unfolding flat since what would have been the b wave failed to retrace at least 90% of the a wave. Could we be looking at a large zig zag instead with a c wave up now unfolding? Lots of bulls are absolute giddy convinced that today’s strong move up must be a third of a new impulse up to new all time highs, but I think it could be a c wave ahead of new lows next week in a larger c wave down.
Elliottwave trader has a possible c of b up underway so I guess it could still retrace 90% of what would be an a wave down and still qualify as a flat with a final c down. My problem is I have been counting the move down off the highs as a five….maybe it is a three?
I cannot find anything motive here. The move down is a three. No question about that. Just look at ES, which has a double bottom, which makes it a three. More in the update tomorrow.
We did not turn down yesterday, so I have got a different prediction on the market:
Down strongly from Monday/Tuesday into March 7/8.
The tides turn today into March 1 and after that March 10.
Nice weekend.
Nice weekend
I think Peter T is correct that we are seeing a big flat unfolding. That would mean we are completing a c upwards of a larger b wave which has to go to 2838.85 to retrace 90% of the A wave down. An expanded can actually exceed the A wave all time high and you can imagine how many accounts are going to get blown up by the brutal C wave down if that happens.
Bottom line? EW analysis suggests we should expect HIGHER prices on Monday. Thanks Peter T. 🙂
cough……………………………ahem………………………………cough…….
ES………………..you know this chart well………………….did you miss what it was telling you??
https://invst.ly/6qx96
and for your viewing…….here is a close up count of wC of wave C [the last few days of price action]………………..and there is a potential count that it says all is complete…………https://invst.ly/6qxdu
so there is also a potential that we head down come monday.
Yep. The thrust up out of the triangle was classic and expected. What changed my mind about it being complete is that those kinds of thrusts are almost always immediately reversed intra-day, and when that did not happen during Friday’s session, my conclusion was that we were headed higher. That was in my mind confirmed by the idea of a larger B wave unfolding upward. If it is a flat, it has to move higher.
all shall be revealed in time herr verne………………….
it is unnecessary for this wave to move higher…………………. we have the flat…………………..https://invst.ly/6qxre
………………………………now if you are talking about anticipating an “expanded” flat……….then “yes”……………higher prices will result….
for me, the potential price action is greater to the downside as a flat has already played out here……………..we shall “agree” to disagree….
on direction.
the market will show us the way…………………….
I can count a clear impulse down in DJI, SPX, and DAX. The same is NOT the case for ES and I accept Peter T’s contention that it is a three. A waves can be three or fives depending on whether we have a flat or zig zag unfolding. If we see the decline from the Jan 26 to Feb 9 as a three wave structure, I would think a flat of some kind is unfolding, and that the current upward correction is a b wave of the flat. EW rules require it to retrace at least 90% of the A wave for a regular flat, and it can exceed the A wave making a new all time high if it is an expanded flat. A five wave count could still be a developing zig zag and the b wave would not be required (and could not exceed the A ) 90% of the A wave.
I don’t want anyone to take this personally but you can always tell real traders from the rest of the crowd by the way they comment about the market.Real traders don’t blather. They give sound reasons for why they expect the market to do what they state they think it will.
The reason is simple – they have money riding on it. If you don’t, clearly you are free to throw anything at all out there as it does not matter a whit if you are right or if you are wrong. I truly appreciate those of you who post charts that clearly show how, and why you think the market is trending in the way you opine, as well as other explanation to bolster your point of view. I will admit that while my bias based on my own count and other technicals is higher next week, I cannot be certain. I have open bear call spreads and straddles until a more confident directional trade can be made. Have a great week-end everyone!
yes………….that’s correct……………………i have a secret “fetish”……………..
shall i blush…………………….or would you prefer i share my “fetish” with you??
think……………………………”wilshire”………………………………..
https://invst.ly/6qvsm
Ooooh….please, doobie doobie do…! 🙂
i deserve that!……………..:-))
funny though……….if you look at the first blue “a”, off from the 2009 lows…..
that “a” – counts as a 3!!!………….there is no way if can actually be a 5 count!
and yet i labelled the first “a” with a 5 count…………………knowing………….it is a series of 3 wave sequences…………………….which is exactly my point…….
the market continued to “correct” upwards………………..and never looked back!
that is why i am ………………………..”grande”…………and ……..”OK” with the first move off the top being a 3 count………
since 2000 we have been in a state of correction……..and during corrections there is NO rule to say any wave MUST be 5 waves……… A’s and B’s and C’s can all be 3 waves………..3, 3, and 3 for A/B/C or 5,3, and 5 for A/B/C makes no difference………….
cycle size seems to be throwing all off……………
2000 – 2009 we produced a “flat” in some indexes, and an “expanded” flat in others………………….
2009 – 2018 we produced a super ginormous big fat zig/zag upward
2018 – ?? i am predicting another super ginormous big fat sharp zig/zag downard.
I am rooting for ya! 🙂
no rooting necessary…………check your email kind sir……?
I know all of you do EW — whereas moi — I just follow $SPLV for $SPX D.A.I.L.Y direction — if weak/strong — so will $SPX follow.
also do my Daily DeMark levels on SPX SPLV VIX and other stocks I follow/have thoughts of playing. gives me a quick glance to see if anything’s out of sync. know its not technical to most of you — but this I’ve found to keep me alert & out of trouble.
I don’t have the news on — know most follow news and think that news trumps all — I don’t buy it. can have great news and stocks/markets go south — so I no longer listen to news or follow any financial twitter accounts. use the “Twitter Search” – to see the general chatter — “fave” some tweets to go back eod to see what they see. am ALWAYS open-minded — but don’t want to be influenced by anyone.
well.. on Friday I watched FIRST my usual SPLV to see if weak/strong & then looked at SPX and DAX, BTC and Oil …knew my DeMark levels and saw SPLV was > R1 whereas SPX was not & was retracing & just trading in a range– but I saw how strong it was & tweeted about it. anyhow — to make a long story short — this is what I look at.
oh yea.. on Wednesday — $TRIN closed > 1.60 — over 2.00 — which to me indicates a RALLY next day/2
The price action on Friday was clearly coiling for a break and I had SPY 273 calls in anticipation. I cashed out quite a bit early as I was anticipating a sharp reversal of the thrust out of the triangle that never came as prive just kept powering higher to print a bullish engulging candle. Low volume can no longer be relied upon to diminish the odds of a move continuing higher..it has not for years now…
Verne — maybe you were one of the few that saw that in SPX / SPY — but majority were not. I watched the chatter & all the so-called gurus & divas were not that bright — but of course after the fact they all came out w/their Picasso charts — that they saw it coming…cause of this level & that level or cause of what the Fed doing/not doing, debt/no debt, inflation/deflation .. rate hike/no rate hike, etc etc
on Wednesday — majority were expecting a flush in the following days — to the 2650 area based on ES_F ..but I saw $TRIN closing > 1.60 @ the 2.00 area & tweeted that based on this a rally next day/2 & yes — my 2 “concerns” that day was the action of $VVIX and $SPLV — I don’t follow much $VIX — but tweet its daily DeMark levels since others are hooked on it.
Yep. Triangle formations are one if my bread and butter trading patterns and that coil was unmistakable. The guideline regarding the directional break is so simple it is strange so many traders completely miss it. I was certain a big spike up was coming. I was wrong thinking it would reverse swiftly. In hindsight it now looks like a bull flag. With all due respect to all those who reference external indicators to detrmine the market’s direction, everything I see intrinsic to market signals is telling me the immediate direction is up, and I trade what I see in the market, not anywhere else.
Verne ? am NOT knocking you personally — just saying what I’m seeing on the net/twitter. everyone has their own methods. mine so far has proven correctly.. $SPLV–mind you not the 1st 2 days of the year — but otherwise am sticking to what has been working for me for past 3 years — and I ONLY do it for the DAILY movements — NOT predicting long term. ok!
if anyone knew what’s around the corner — we’d all be trillionaires & not on the net 🙂 😉
I did not think you were, no worries! 🙂
Luri,
I am rooting for you too!
Peter G,
I was looking at the daily A/D line. In particular the interplay of the A/D line with the 40 day simple moving average. The A/D line crossed below the 40 day average and is now testing that moving average from beneath. That has been important on a few occasions in the past.
I believe you posted that the A/D line “failed” to confirm the new highs made on January 26th. If that is the case and I could be wrong…Does the A/D tell you anything? To me it is looking divergent.
In your mind does that small divergence that “I see” qualify as an “Important
Divergence”? I guess only time will tell.
Hi Ed,
The divergence we saw at the late January high was there but very small. Most indexes saw their closing highs on Jan 26 whereas the daily a-d saw its high on Jan 23. I think I said at the time that it was a very minor divergence, not what we would look for at a major top, but I also noted there had been major tops in the past, either with no a-d divergence or with very minor divergences. 1968 is the first to come to mind. So the best the a-d line can do for us historically is say it is possible that was the final high, but based on long a-d history it is not probable. As to the 40 d MA, the a-d line moved above it on Friday, but an immediate reversal back below would be what you want to see if you’re bearish. There are currently no MAs from short (4d) to longer (200d) that are above the a-d, or more descriptively, the a-d line is now above all MAs.
BTW, I want to say I really appreciate posters who know what they are talking about. So much of what people throw out today is nothing but hogwash, and useless information as they have never successfully applied whatever it is they are presenting. At the risk of appearing self-serving, here is something I posted with a date-time stamp on another forum in response to a poster who voiced confusion about what was going on in the market. Granted it was only my opinion, it was based on how I had seen price action unfold in the past.
“Verne February 22, 2018 at 7:39 pm
No need to be confused. The counts Lara has provided are all valid and one of them will be shortly proven correct by subsequent market movement. Some of the most explosive moves you will see can and do come after what appears to be a period of indecision. I suspect the current coiling action is storing energy for just such a move.”
A new weekend post is live at: https://worldcyclesinstitute.com/locking-in-the-combination-or-not/
This website is for educational purposes relating to Elliott Wave, natural cycles, and the Quantum Revolution (Great Awakening). I welcome questions or comments about any of these subjects. Due to a heavy schedule, I may not have the time to answer questions that relate to my area of expertise.
I reserve the right to remove any comment that is deemed negative, is unhelpful, or off-topic. Such comments may be removed.
Want to comment? You need to be logged in to comment. You can register here.