
Update: Friday, July 20, 9am EST
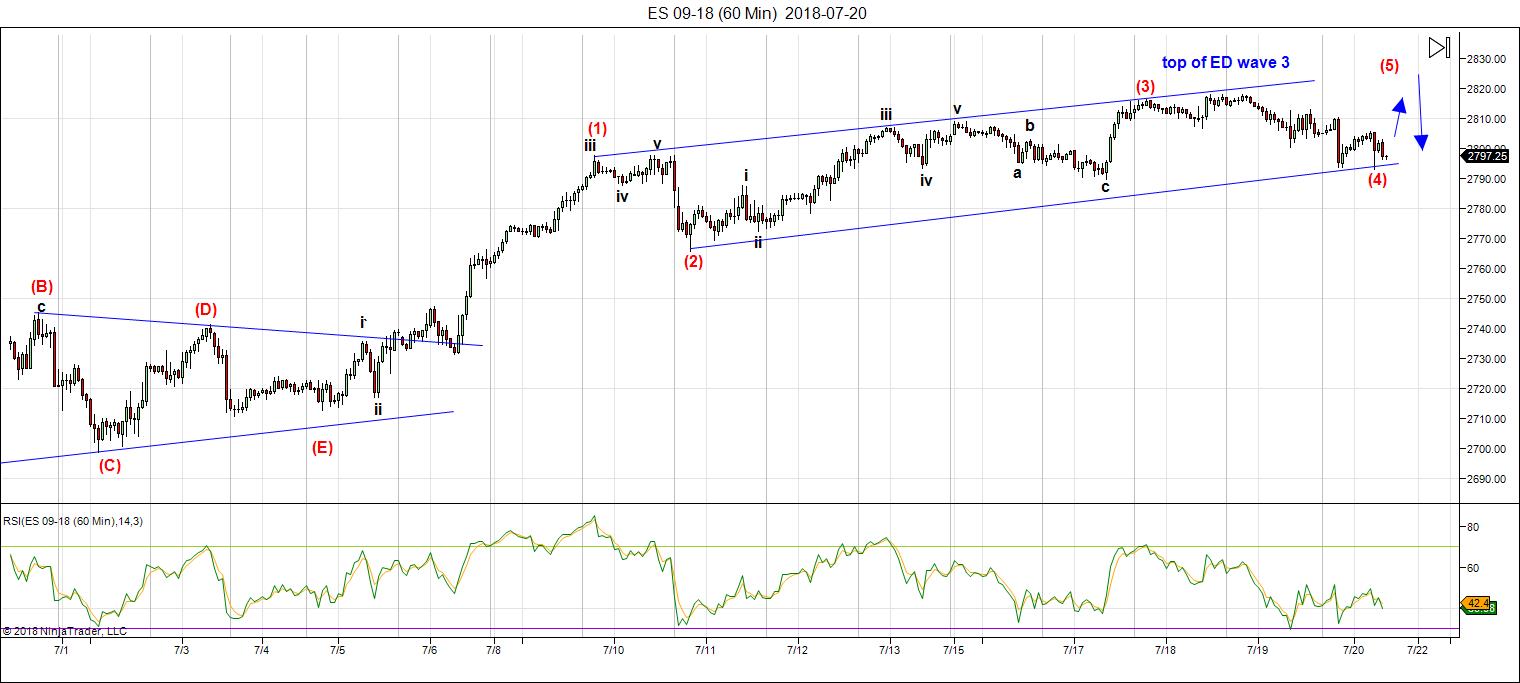
Above is the 60 min chart of ES showing the ending diagonal and this morning’s position in a small second wave near the bottom of the fourth wave. I’m expecting a wave up to a brief new high and then a reversal to the downside. If we drop to a new low, then we’ve most probably topped.
__________________________
Market Update for Friday, July 20 2018
Market Update for July 20, 2018  |
 |
Make sure you zoom the video to full size with frame expander (arrows) in the bottom right hand corner and also set the quality to as high as your web connection allows. This is a high definition (HD) quality video so the best viewing is at that level. |
_______________________________
Market Update for Thursday, July 19 2018
This is the CHART SHOW (a bit longer tonight than usual, but in the usual order).
Chart Show for July 18, 2018  |
|
Make sure you zoom the video to full size with frame expander (arrows) in the bottom right hand corner and also set the quality to as high as your web connection allows. This is a high definition (HD) quality video so the best viewing is at that level. |
_______________________________
Market Update for Wednesday, July 18, 2018
CHART SHOW signup
Market Update for July 18, 2018  |
|
Make sure you zoom the video to full size with frame expander (arrows) in the bottom right hand corner and also set the quality to as high as your web connection allows. This is a high definition (HD) quality video so the best viewing is at that level. |
_______________________________
Market Update for Tuesday, July 17, 2018
CHART SHOW signup
Market Update for July 17, 2018  |
|
Make sure you zoom the video to full size with frame expander (arrows) in the bottom right hand corner and also set the quality to as high as your web connection allows. This is a high definition (HD) quality video so the best viewing is at that level. |
_______________________________
The SP500 Officially Achieved Diagonal Status
The big news this weekend is that the SP500 reached and exceeded the target of 2802 (it actually reached 2804.53 before the end of the session) and so we have one more ending diagonal to add to our glowing list.
This weekend in the free blog, I grabbed a bunch of charts with ending diagonals in them to show you the ridiculous proliferation of patterns that spell the end of the 500 year trend.
This market is just about done!
We still have to wait for ES to get above 2812, which it might should handily exceed before everything turns down together in what will be the fourth wave of all the ending diagonals. OEX and the DOW are not tracing out triangles (that I can see) and may end up with a simple 5 wave pattern to a new high. The NYSE chart should remain in a contracting triangle. All the pieces of the puzzle are slowly shifting into place.
USD Currency Pairs
Currency pairs are flirting with a bottom, as CAD and JPY are looking at tops. It looks to me that USDJPY will top with the present third wave high in ES/SPX and the rest will change trend when we reach the bottom of the 4th wave of the ES/SPX ending diagonal.
It seems incredible that we’re going to hang on for another couple of weeks, but that’s what I’m seeing. And as I always say …
Trade what you see, not what you think.
DAX Chart Added
This weekend you’ll find that I’ve added the DAX daily chart to the bottom of the long term charts. I will update this chart on weekends and cover it in the Chart Show on Wednesday nights.
Elliott Wave Basics
Elliott Wave Theory has two primary components:
- fibonacci wave relationships that provide predictable wave lengths and end of entry or exit targets
- wave counts in impulsive waves and corrective patterns (each corrective pattern has its own rules and guidelines)
Trend waves, or impulsive waves (which we haven’t really had since 2007), consist of a five wave pattern that measures accurately to prescribed wavelengths. We’ll get a set of impulsive waves in the A wave down after the top of the market.
Corrective waves are typically in well-documented patterns (eg – triangles, flats, or zigzags). You’ll see a list of corrective patterns in the sidebar in the Trader’s Gold area. They’re there so you can become familiar with the rules and guidelines for the pattern we’re in.
___________________________
Week at a Glance:
- ES/SPX – High probability turn down at about 2814 or higher (Monday?)
- USDJPY – High probability turn down near 113.
- Gold – Expecting a bounce and a probably retrace to 1366 area.
______________________________
Here’s the latest daily chart of ES (emini futures)
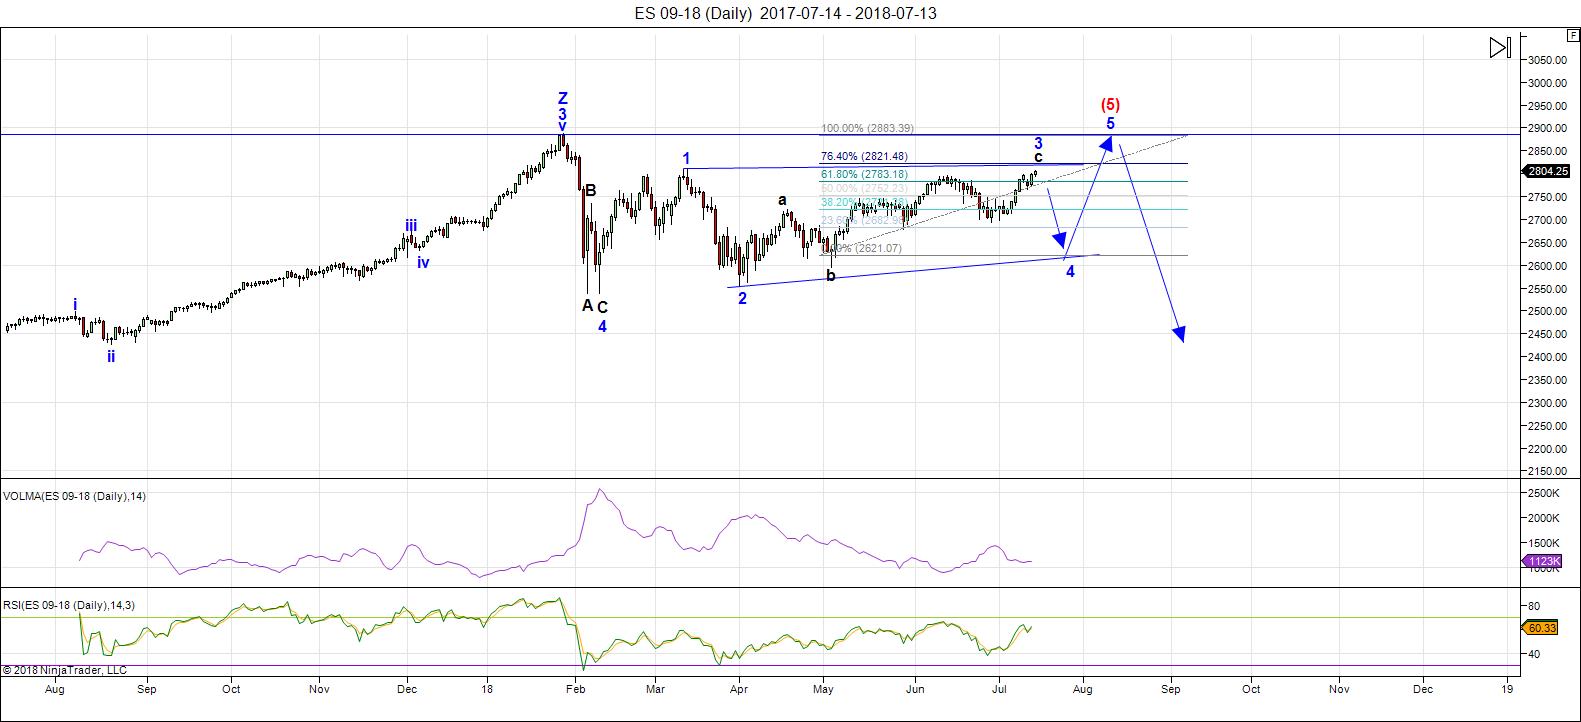
Above is the daily chart of ES (click to enlarge, as with any of my charts).
I commented this past week in a nightly video that this market is one that I’ll remember for a very long time. That’s primarily because of the effect of the NYSE, which tracing out a contracting triangle (a corrective pattern that’s almost evenly balanced between bulls and bears, and moves sideways). Because it’s summer, this balance is exacerbated by extremely low volume, which leads to enhanced volatility. As well as low volume due to summer, we’re at the top of a 500 year rally (everybody who wants to be in the market, is).
Sentiment is at historically bullish levels, but the smart money has been leaving for quite some time.
The market is volatile and at times unpredictable. It moves to extremes in both directions (due to its “balanced” nature). On top of that, all major asset classes are moving in tandem at the whim of the US Dollar. As a result, assets tend to get “pushed around” when they react to some of the volatile moves the buck has exhibited over the past few months.
It’s a great time to be on holidays and not in the market (except for the coming couple of weeks, of course!
Monday of this past week, I predicted that wave D of the SP500 was indeed going to a new high (resulting in an ending diagonal). On Friday, we achieved that goal. But it became clear midday on Friday that we’d have to wait until Monday for the turn to the downside.
The wave down will be the fourth wave of the ending diagonal, with a target somewhere near 2600-25.Then we’ll turn up into the fifth and final high … but a high that will have a definite maximum target (to be determined once the fourth wave is fully in place.
Summary: We should turn down early this week into the fourth wave of an ending diagonal. Once the 4th wave (down) is complete, expect a final fifth wave to a new high. That fifth wave up to a new high will be the end of the 500 year bull market.
_______________________
Here’s the latest 60 MIN chart of ES (emini futures):
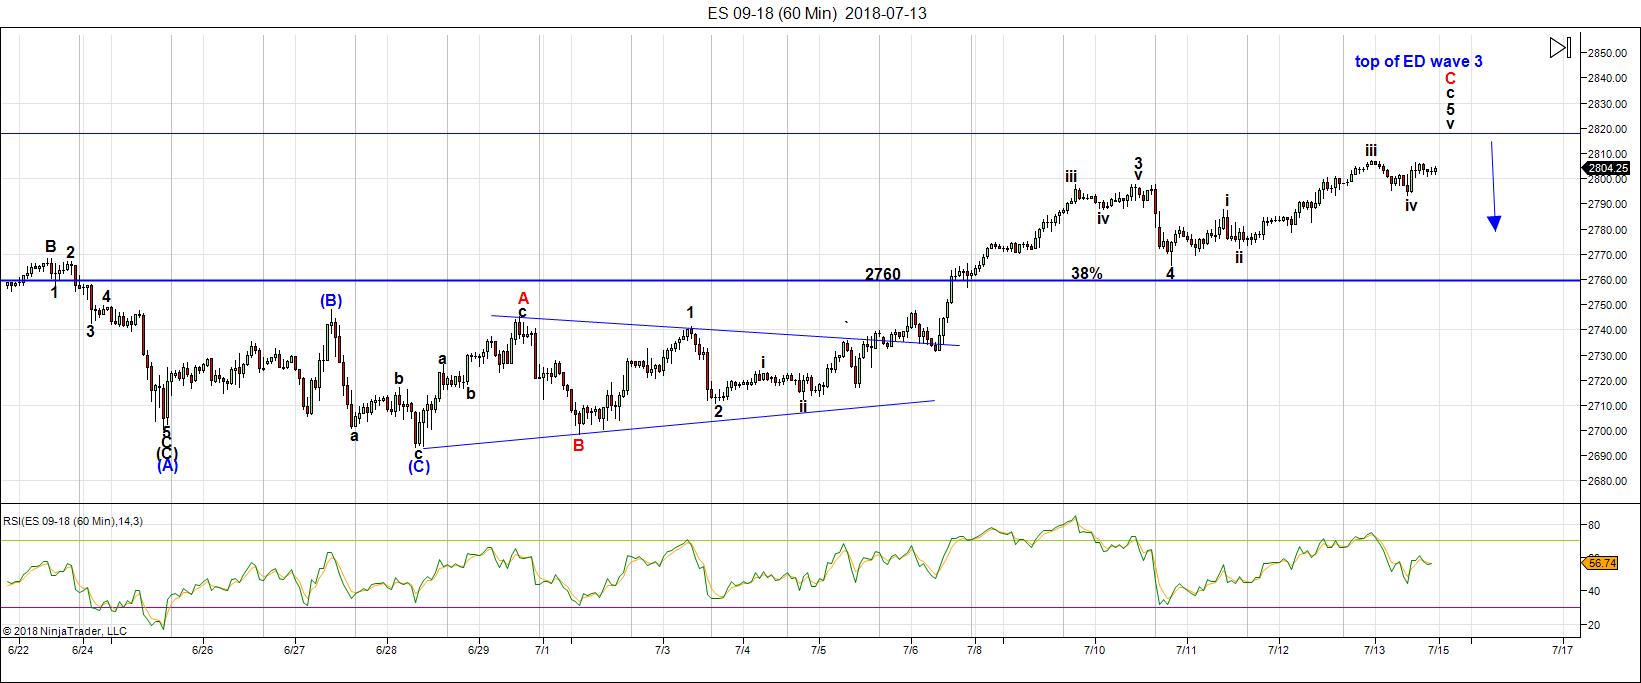
Above is the 60 minute chart of ES (click to enlarge, as with all my charts).
ES has not crossed the line into ending diagonal territory yet. It should this weekend, however. The level is at approximately 2812 and all it has to do is exceed it. At the end of the day on Friday, we’d only made it to about 2808. On the other hand, SP500 has already exceeded the required level.
Once we rise above 2812, it’s time to start looking for a turn down. I have a tentative target of perhaps 2814, but since the structure of the wave up is not clear, my measurements may not be accurate.
The expected wave down will now be the fourth wave of an ending diagonal (as the contracting triangle is now officially dead). You’ll see the numbering scheme for the triangle (diagonal) now changes from letters to numbers.
The pending high (Monday?) should result in a drop of almost 200 points over a couple of weeks. I have a tentative downside target of 2600-25. We may drop to the lower end of this area, due to the underlying weakness I see everywhere.
I hope the A wave down will provide as with a more accurate projection for the bottom of the C wave. All waves in ending diagonals must be in “threes.”
4th waves of diagonals determine the slope of the lower trendline. We can’t measure a target for the 5th wave until they’re completely in place. You also don’t know (technically) that you have an ending diagonal until that fourth wave ends. The upper and lower trendlines must converge. If we drop far enough so that the trendlines become parallel, then the ending diagonal is negated.
Summary: I expect a turn down imminently to trace out the 4th wave of an ending diagonal. The preliminary target is 2600-25. Then we’ll look for a turn back up into the final wave of the 500 year rally we’ve been in. The final wave must reach a new high.
_____________________________
Some housekeeping:Site navigation: You can find all the specifics on site navigation and elements you might not be aware of by clicking here. Next Federal Reserve Annct: Wednesday, August 1 Andy Pancholi Turn Dates (July, 2018)
* denotes major (bolded, as well) – (for more information on Andy’s turn dates, go here.) New Free Blog Post: Ending Diagonals Cap the Market The CHART SHOW signup is live for Wednesday. You can sign up now in the usual spot: webinars. Problem receiving blog comment emails? Try whitelisting the address. More info. Moons, Eclipses, PlanetsAug 11 — Super New Moon Aug 26 — Full Moon Sept 24 — Full Moon Oct 24 — A potentially nasty “Hunter” full moon. |
Market Report for Monday, July 16, 2018
CHART SHOW signup
Market Report for July 16, 2018  |
|
Make sure you zoom the video to full size with frame expander (arrows) in the bottom right hand corner and also set the quality to as high as your web connection allows. This is a high definition (HD) quality video so the best viewing is at that level. |
_______________________________
Longer Term Charts
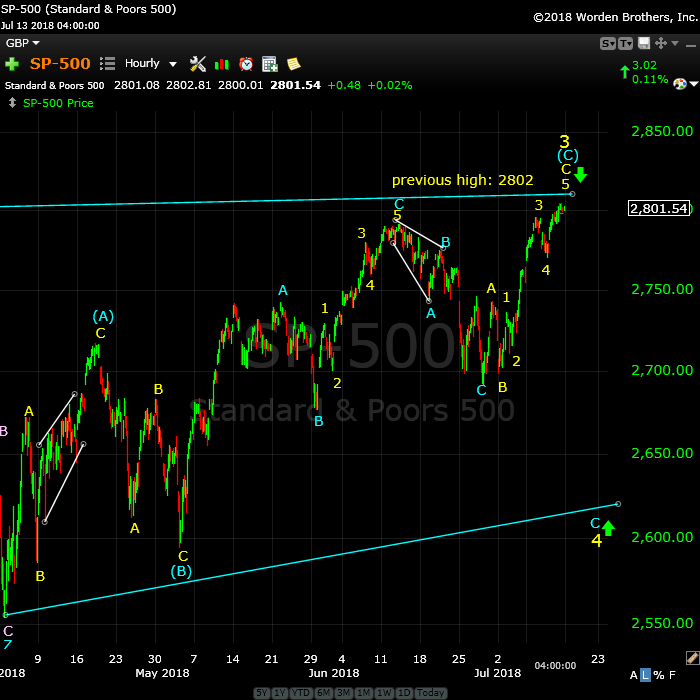 Above is the one hour chart of the SP500.
Virtually the same as ES, except that the SP500 now has an ending diagonal wave 3 in place, while ES has a few more points to go to achieve the same status.
The preliminary target for the low is in the area of 2600-25, making for almost a 200 point projected drop.
This turn is a high probability short. The bottom of the 4th wave of the ending diagonal will turn up into the fifth and final wave to an all time new high. The final wave to a new high out of a diagonal is always in three waves.
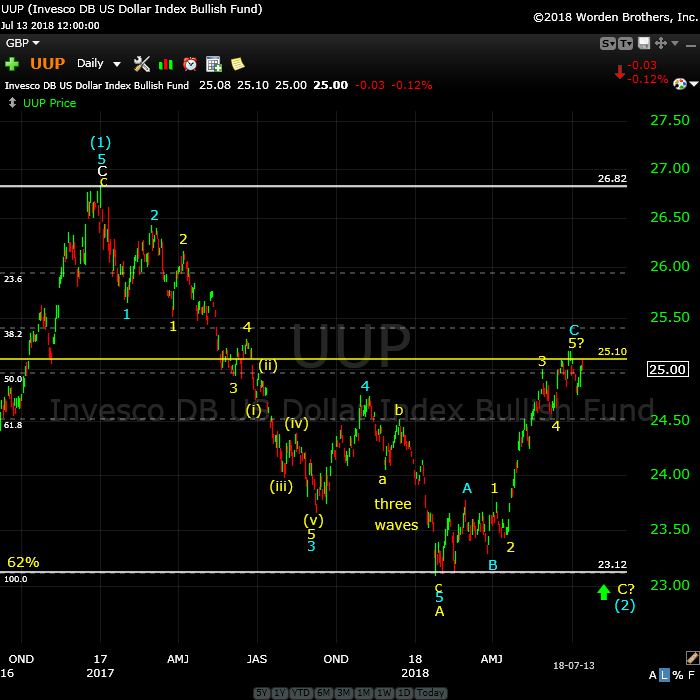
Above is the daily chart of UUP (US Dollar ETF). UUP is representative of the structure of DXY (the US index) and will provide an excellent predictor of the impending top in currency pairs and the US indices.
We’re in the final stages of attempting to put a top in for this B wave, and it’s become fairly volatile. This appears to be what is pushing the US indices (ES/SPX, etc) up to extremes in the 3rd wave of the ending diagonal.
I think we’re going to get the final turn to the downside in the Dollar when the US indices reach the low of the 4th of the diagonal (but I don’t know that for sure). The Dollar will then head for a new low (that low should coincide with the top of the US market.
After a new low, the dollar will turn up to head for a new high above 104.00 (UUP likewise above 27.00). The dollar will turn with the euro.
Rather than playing a currency pair, you can consider playing a short here knowing that the objective is a new low below 23.00. But I would wait for a small wave down in 5 waves and a lower high to follow that retraces 62% in three waves.
The movement of the dollar strongly influences the movement of just about everything else, so it’s important to pay attention to what it’s doing.
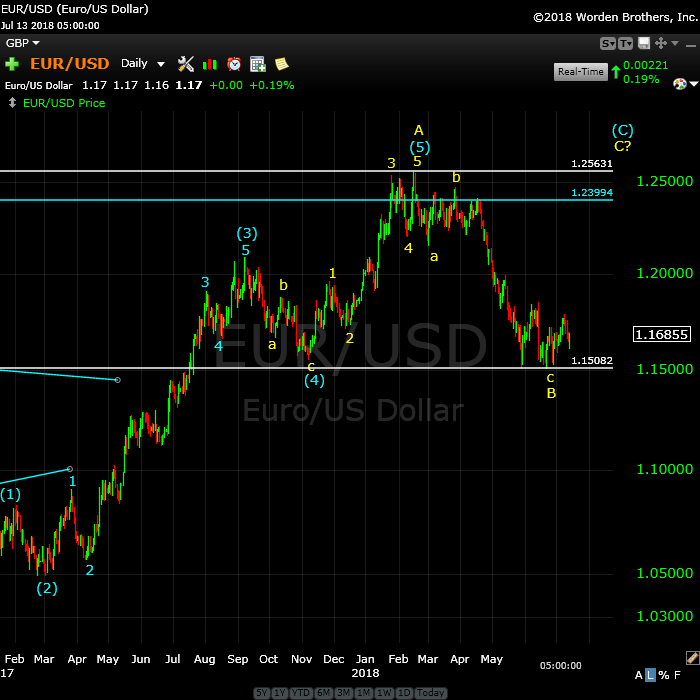
Above is the daily chart of EURUSD.
We’re waiting for a confirmed bottom. We appear to have more or less completed a large C wave to the downside, part of an abc corrective pattern. We’ve had a turn to the upside, but so far, the overall wave structure appears to be in three waves (if it stays this wave, I expect a complete retrace to the upside and a new high above 1.256).
As I’ve stated elsewhere, I think EURUSD will turn up into the final 5th wave to a new high when we turn up into the fifth wave in the ending diagonal in SPX.
I’m unsure of what the pattern of this fifth wave will be in EURUSD. It may be a motive five waves, or we could even trace out an ending diagonal.
In terms of how to trade the expected rally, the less risky course of action would be to wait for a wave up in five waves to the previous small fourth at 1.18523 and then a three wave, 62% retrace in a second wave.
Once this final pattern eventually tops (with a new high above 1.256), expect a drop in a higher degree fifth wave to a new low below 1.034.
More on the shorter term in the video, of course.

Above is the 3 day chart of GBPUSD. The longer term direction is up.
GBP has a similar pattern to EURUSD. We’re very close to a bottom on this large leg down. The large wave to the downside is corrective and therefore requires a rise to a new high.
The wave up so far at the end of this past week is also corrective. I would expect a test of the low before we turn up in earnest.
If contemplating a trade, as with the EURUSD, I’d be waiting here for a first wave up to the previous lower degree fourth wave (we may be building this now) and then a second wave down in three waves down to the 62% level. This will be a high probability setup long with a target of an all time new high.
All the pairs are about to turn, so as the EURUSD confirms a bottom, GBPUSD should not be far behind.
More information on the short term prognosis in the video.

Above is the 2 day chart of the AUDUSD.
The probability now is that the bottom is in place but will require another test. We had a wave up near the end of this week, but the waves count as a “three,” so it needs to retrace, like the rest of the currency pairs. It’s looking like we may not get a turn up until wave four of the ending diagonal bottoms in SPX.
After the eventual turn up in a valid first wave, we’ll be looking for a second wave down for a long entry. The long term target to the upside is .84450.
More on short terms prospects in the video.
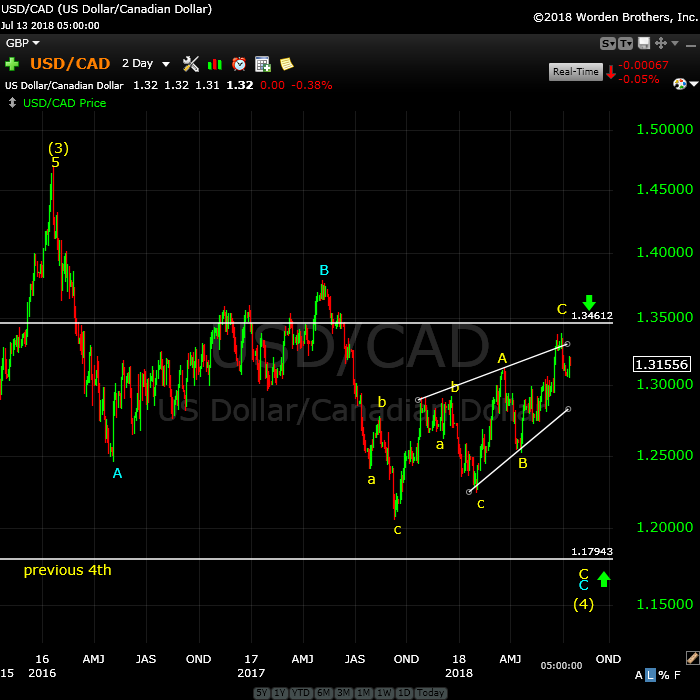
Above is the 2 day chart of USDCAD. It moves opposite in direction to AUDUSD (due to the orientation of the charts).
We are wandering around, as are all the currency pairs. I expect an eventual rally to the 1.34612 area, which is a measured objective, before a turn down into a final 5th wave, which will target the 1.18 area.
The high probability trade is a short once we have a top of this corrective wave up in place (at the mentioned target of 1.34612). The first objective for that trade is a new low below 1.18, but we might spike lower.
Once this pair hits the final downside target, it should turn up and will eventually rally to a new all time high for USDCAD well above above 1.46254.

Above is the 6 day chart of USDJPY. For this pair, the longer-term prognosis is for a big drop to the 94.6 area after a top at about 113.
A turn down at 113 is a high probability trade, as all the currency pairs are shaping up to deliver. It looks like the final 5th wave is going to happen everywhere, with assets all moving in tandem.
This weekend, I’m showing a potential bearish triangle (although I haven’t labelled with triangle letters … yet. That’s because this is an unusual place for a triangle and I’d like to see the turn from this area (in a valid first wave down). We may get that turn as early as Monday, with the top in the 3rd wave of the ending diagonal in SPX (they’ve been moving in tandem for quite some time now).
Once we hit that high and turn down, expect as extended wave down to about 94.6.
After we hit the long-term downside target (~94.6), I expect a turn up in an impulsive third wave far, far above 130.00.
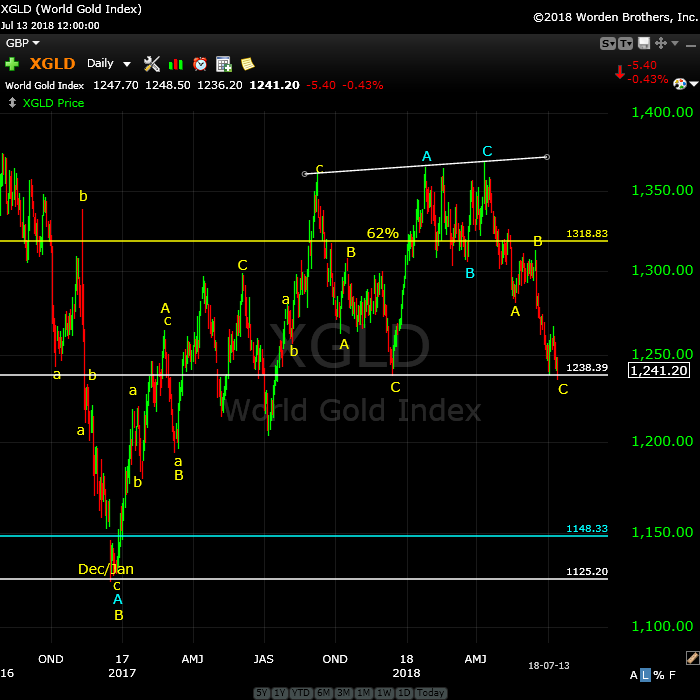
Above is the daily chart of gold. This is a good example of why it pays to sit on your hands until the market tells you what it’s doing, except that I’m still a bit on the fence as to how this next segment is going to play out.
We now have the projected double bottom that I’ve been projecting. I would be waiting for a small wave up (perhaps a 5 min chart) and a lower low before attempting a long entry. The waves down are in three waves and should retrace, but will they do it now? They might turn up with the turn down into the fourth wave of the ending diagonal in SPX.
The best bet is to see wait to see what unfolds shorter term. Silver has dropped out of a triangle, which makes the outcome as little less clear (however, it’s also showing signs of turning up).
I’ve placed a 62% retrace line in yellow on the chart at 1318, but three waves down requires a complete retrace, so the target is more likely the upper trendline (the 1366 area).
After a new high, we’re looking for a turn down and a target on the downside of 1122 (which will need to be confirmed by the first wave down after the top).
After a bottom at around 1122, look for a wave up in gold to the 1600 area.
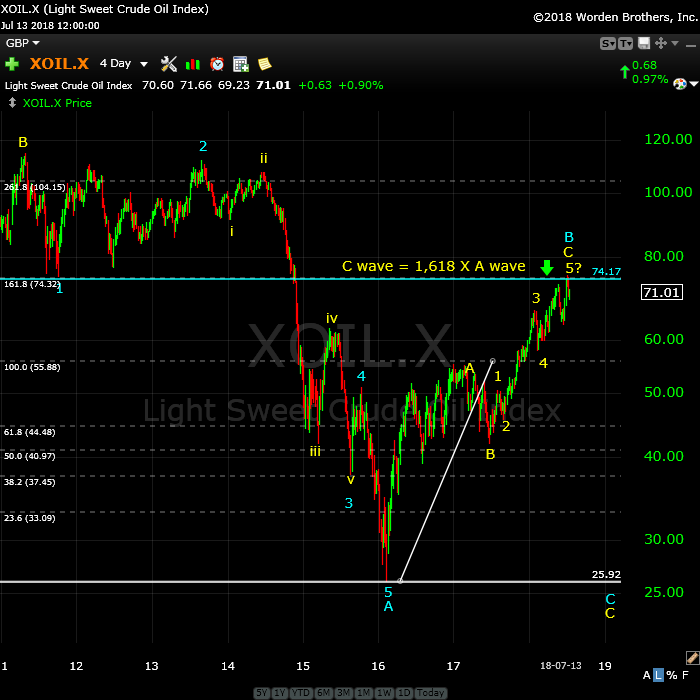
Above is the 4 day chart of WTI oil. Watch this weekend’s video for a high probability short.
I’m waiting for more information on oil before I make any recommendations. I think we probably have a small triangle in the works (possibly another ending diagonal) because the current pattern doesn’t make sense. To that end, expect a further drop in what might be a fourth wave, or even the second wave of an ending diagonal More in this weekend’s video.
Longer term (after an eventual top), I’m expecting a long wave down in 5 waves to a double bottom at about 26.00. The entire structure going back to 2007 is a corrective wave, with the A wave equal to the C wave in length. This suggests a double bottom at the 26 level rather than a drop below it (but we’ll determine a final target once we see the wave structure of the wave down).

Above is the daily chart of the DAX. The index is tracing out a final fifth wave up to a final high. At the moment, we’ve in the beginning stages of the fifth of the fifth wave up. It’s dropped to a very low level. However, the fifth wave is often the same length as the third wave, so we shouldn’t have a big challenge getting to a new high, but we won’t get much above it.
Good trading!


Peter I’d be amazed if the Dax only fell 450 points with the S&P falling 200. More likely a double bottom with the ABC you labelled and then a rally to a slight new high as the Euro will strengthen and hold back further Dax gains
it certainly could. I think the DOW is going to a double bottom. If so, it would change the count. But the wave structure says we have to get to a new high eventually, one way or the other.
It’s been relatively quiet overnight. No change to the prognosis. Will be looking for a turn in ES/SPX and USDJPY.
The US indices aren’t going to top today, by the looks of it. All the waves down are in 3’s. So we wait. ES needs to get up to the 2812 area. The final set of waves should go up in 5 waves.
I added a chart of JPY at the top of the post, which relates to the prediction for USDJPY.
The Market Update for Tuesday is live at the top of the post. We wait patiently … (or rather, impatiently)
This is such an incredibly frustrating market. Currency pairs are “wandering.”
With ES, I still don’t see anything to suggest we’re headed down. Waves in both NQ and ES appear corrective.
USDJPY is getting close to its previous high. Otherwise, a quiet night.
ES: Has an abc wave to the downside. At 2790, the C wave is the same length as the A wave. So there’s a probability that we’ll turn back up from here.
I’ve mounted a chart at the top of the post of ES showing the abc wave down and the level that it’s at.
The wave up in ES looks motive so far. It looks like five waves, so I’d be expecting a second wave soon, down 62% of the wave up.
USDJPY is making noises as if it might be in the process of topping.
Maybe we will indeed get a top today in ES … quite the amazing looking wave.
I put us in the fifth wave of this spike up in ES, although the subwaves are almost impossible to make out.
We should get to at least 2812 and then it’s questionable after that.
Everything is starting to look super bullish! And that means a turn should be close. Cannot wait for 2600 as going long is the easy trade in this market!
The Market Update for Wednesday is live at the top of the post. Chart Show tomorrow. Perhaps a turn in the morning for ES and friends.
ES is down in three waves, so it will need a new high. The structure of the waves over the past few days might have produced an ending diagonal, which would mean one more wave up to a new high that can’t exceed 2832. The third wave of the ED is a bit questionable and it why I’m not quite sure, but it otherwise fits the bill.
ISDJPY could have put in a first wave down. In that case, the second wave would have a target of 112.98. Watch for that. If it’s a fourth wave, it will seek a new high.
Currencies are a bit nearer their bottoms, but no bottom yet.
Here is some additional analysis that seems to align with Peter’s work. https://youtu.be/oWHVJkmBb4o
I’ve taken a small pioneer ES short here.
NQ also has to make a new high and it’s lagging. You can watch it for a clue as to what ES is doing.
I put us near the top of the third wave in ES … I think. Hard to be sure. 2 min chart.
ES is now in the fourth wave. Projecting a high of 2821 if the fifth wave keeps to the usual length.
I would be surprised to see a turn today, based on what ES and NQ are doing.
The wave in ES is looking less like a final 5-waver and more like we have a 5 wave A wave in place, along with the B wave we’re in (or a fourth) and that we either have a 5th or a C wave to go.
If a C wave, the target could be 2825 (or even a bit higher). If a fourth wave, we’re just going to make a new high and not much more. Will go through in the Chart Show.
Three waves down so far in ES and NQ. I’m expecting a new high, but may only be a double top. Currency pairs are very close to bottoms. USD JPY at a new high, as is US Dollar index.
It looks to me as if the US indices are going to turn when the dollar does. They’re all very close, but I don’t see anything to suggest a turn is in.
I would wait to see first and second waves.
USDCAD is odd, sitting at a 62% retrace but I can’t make out 5 waves down from the original wave down.
Very uncertain market overall this morning.
There’s a possible 5 down in ES … the wave structure is not very clear. If we go to a new low, as we went up 62%, we may have a top in place.
I want to see ES either below 2790 or a bounce at 2790 and a second wave.
Make that below 2789 for ES. SP500 is looking much better than ES, in terms of a top being ini place.
ES below 2798 would break the lower trendline of the ending diagonal and that’s also a good indictor of a top.
The wave up in NQ (1 min chart) looks corrective, much more so than ES.
2808 in Es is the 62% retrace level of the wave down from 2813. I want that to hold.
The waves up in ES and SPX are very bearish-looking. We just need to break this really strong support.
WE might have to go back up and tag 2813 again. A most difficult market. However, a turn there will lead us to a third wave down and the likelihood we have a flat taking shape.
The 62% retrace level for sp500 is 2810.32. Almost there.
I’m preparing to short ES at 2813 (2812.75 is the actual previous high) unless something strange happens. I’m expecting a turn down in that area.
With ES, the wave down could also be the fourth wave of the ending diagonal, as it went down and touched the lower trendline and then reversed.. So, at 2813, wait for the turn. If it heads above there, then we could be the fifth wave of the ED and that would lead to a very brief new high.
CAD seems to be heading for a new high, so that supports the idea that currencies are going to turn, perhaps with the turn in ES.
It’s dangerous and there are options, so be very careful and wait for a turn.
I just get the feeling watching this that it’s going to be slow and difficult.
My best guess it that the ending diagonal idea is playing out in both SP500 and ES, which means we’ll get a brief new high.
US Dollar had a big wave down, but I don’t know if it’s topped. Very dangerous day. Hard to tell what’s going on.
USDJPY may have topped. If so, the 62% retrace level is at 112.75. I have an extension off the A wave up that also targets that level.
The Market Update for Friday is live at the top of the post. Ending diagonals in ES, SP500, US Dollar. A fifth wave to go, which means a brief new high in ES, so we’re looking at Friday (preferred) or Monday in all probability.
ES dropped down last night to expand the ending diagonal slightly, as a fourth wave. The entire wave down is corrective, and this supports one more wave up as a fifth wave to a slight new high, as per last night’s video. The question is, will we see a top today or Monday?
USDJPY seems to be tracking ES.
The US dollar didn’t do that much overnight, but seems poised to make one more high to finish off its ending diagonal.
AUD looks like a double bottom, but we’ll wait to see what’s next. The other pairs are near bottoms/tops.
I just posted a chart of ES showing the ending diagonal, with one wave up to go. If we drop to a new low, we’ve most likely topped.
All the small waves up in currency pairs this morning look almost exactly the same. One market.
Peter, looks like UUP has topped but looks corrective going down?
Hi Terry,
Looks like it might have, but I’m being quiet on this, because I don’t know. The US Dollar index looks the same. They both went to new highs, did not touch the upper trendline (which is no big deal) and yes the waves down are in 3 … so far. However, based on their structure, that could change. So we’re at a top in the Dollar, but I don’t know if it’s topped until I see 5 waves in the other direction to a previous 4th wave. So I’m non-committal at the moment, but sleeping with one eye open … lol.
The other thing is that at major tops and bottoms, you often get non-confirmations, wherein (for example) the dollar might top, but euro not until the the dollar does a second wave. In other words, they can be out-of-sync for one set of waves.
So I tend to sit tight and see who makes a five wave move in the other direction first.
The other issue at the moment is that individual currency pairs may have topped/bottomed. You can also get non-confirmations there. So it can be a dangerous time until we get confirmation of a turn based on seeing a 5 waver to a previous fourth wave.
In other words, I’m on the fence … until the market tells me for sure.
Let me add that if the dollar breaks the lower trendline, that’s a very good indication that it’s topped, but we’re not quite there yet.
ES: Above 2818, we should start looking for a top. The wave up has to be in 3 waves overall, as it’s the final wave of an ending diagonal. It doesn’t have to exceed or even touch the upper trendline. Sometimes they do, sometimes they don’t, and quite often they exceed them.
As we only have 3 hours left in today’s session, and the SP500 has moved about 5 points since the open (and has another 12 to go at least—2817 is the minimum high), I’d be surprised to see us top today.
We’d need an hour realistically for a first wave down to drop far enough to eliminate a gap over the weekend, so it looks to me as if we’re looking at Monday morning. I’d like it to be otherwise, but that’s what I’m seeing.
A new weekend blog post is live at: https://worldcyclesinstitute.com/chasing-the-yellow-brick-road/