
Cycles Update, End of Day, Friday, Oct 9
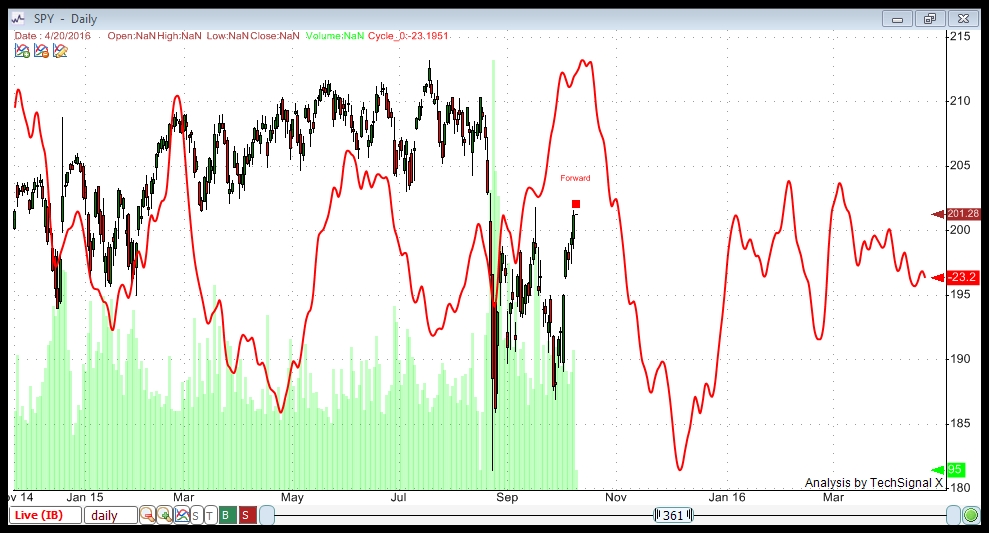
Above is a brand new cycles analysis showing a turn Oct 13/14 (measurement is quite accurate) and a bottom of a rather sheer wave down on December 7, 2015. The full moon is also an important date in the Puetz crash window. I’ll do a fuller update post on the weekend.
Here’s a more in-depth explanation of what this chart is suggesting.
__________________________
Update: Noon EST, Oct 8
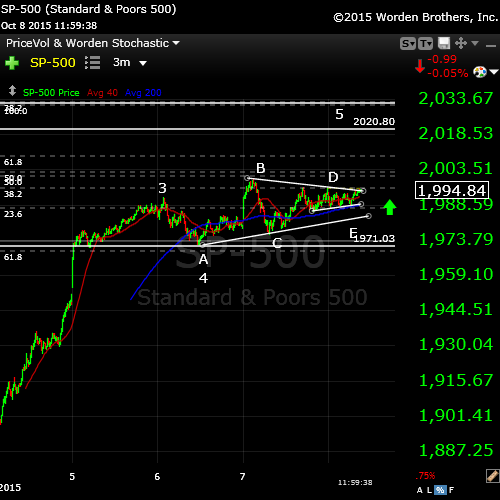
Here’s the triangle in the SP500. The E leg may have formed a triangle on its own (within the larger triangle), but be cautious here, as it still could come down to test the lower trendline (after I wrote this, I noticed we seem to now have cleared the upper trendline, so this is much less of an issue).
If it is, in fact, done, it will rise up to complete the 5th and final wave. Targets for the SP500 are 2020.68 (previous high) and approx. 2013 (62% retracement from the very top of the market). We are still completing a regular flat, which either goes to top of the A leg, or slightly above.
Similar levels for SPY are actually in reverse, as the previous high is above the 62% retracement level from market top. Previous high: 202.89. 62% retracement level: approx. 201.50.
Previous high for ES is approx. 2011.50.
__________________
Update Wednesday, Oct 7, 11AM EST – We look to have completed wave 1 of 5 in the SP500. Measuring this first wave and extending 1.618 from the bottom of the second wave puts us at about SP 2030 as a target.
Update Wednesday AM after the bell – We’re in the final fifth wave up. There are two main objectives now:
- the previous top at 2020.68 SPX and
- the 62% retracement from the very top of the market (at about 2031 SPX).
In either case, I think we’re looking at this whole correction being a second wave. As a result, it will be a very large downturn.
The Nasdaq looks like it may be stopping somewhere around here. This would put it into the third wave of the third when it turns down in earnest.
GDOW may be giving away the bigger picture, as it’s now moved above the 38% target and is on its way to the 62% target, which would also put it into a second wave position.
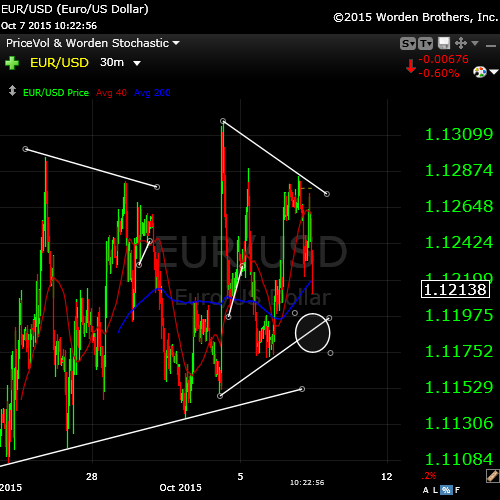
A telltale sign of the end in the US market may again be the EUR/USD, which has been tracing out a triangle. It moves inverse right now to the US market. I would expect it to finish the lower wave of the triangle as the market makes its top.
___________________________
Addendum – Monday night Oct 5
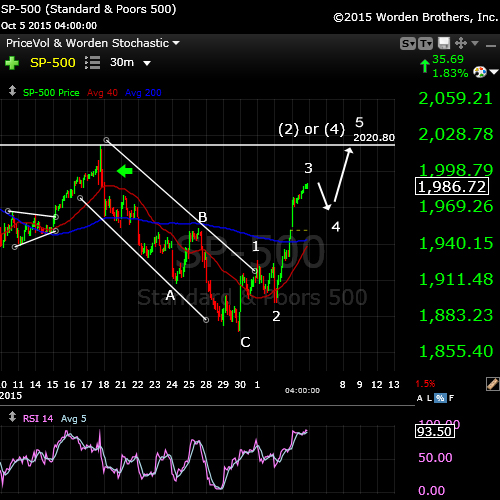
Here is the SP500 above. Based upon my scenario of an ABC down wave from last week and an “ending wave” up, here’s the expected path. Wave 3 in the SP500 is 1.6 times the length of wave 1. Wave 4 should retrace to the previous wave 4. Wave 5 should end at 2020, although it could extend higher to create a flat.
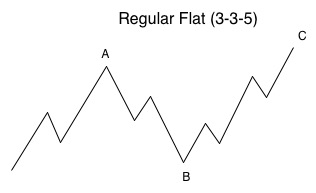
Any flat correction is in a 3-3-5 pattern. In this case, the B wave would have been the ABC wave down from last week. The A wave would be the pattern from Aug 24 up to the high.
In a regular flat correction, “wave B terminates about at the end or about at the level of the beginning of wave A, and wave C terminates a slight bit past the end of wave A.” If we complete a flat that goes to a slight new high, then this would have to be a larger 2nd wave and the downside will be much greater than a 5th wave. For example, the third wave alone would take us down to the low 1600s in the SPX. We would have a 5th wave after that.
___________________________
Original Post: Sunday, Oct 4: Today, we’ll start with the bigger picture. It’s important to revisit the daily charts every single day. So, my first chart will be a backed out view of the DOW.
If you’ve been a student of the markets for some number of years, you’re no doubt used to the fact that the market likes to race off to an extreme before quickly reversing and moving in the opposite direction, in some cases creating a new trend. That’s essentially what I’m expecting to happen here. I am out of the market and will be waiting for the top, which I think will happen this week.
It’s interesting to note that the 1929 market crash was in October (the high was the beginning of September, 1929), and the 2007 high was in October, as was the 1987 high. Oh, those darned cycles!
Back to the present. Having spent time reviewing the markets and my forecast of the past week, along with cycles analysis for SPY, I find no reason to change my forecast.
I tend to be somewhat of an Elliott Wave purist in that I drill down to the one minute chart, if necessary to view what’s happening at all degrees of the wave structure. It helps tremendously in accuracy. EW is fractal and if all degrees don’t conform to the rules, you have an issue with your count—an important lesson I have learned over time.
To review, I believe “the first wave down” was a fourth wave of this correction (an ABC wave down) and that we’re in the fifth and final wave up which should test the previous highs (in the case of the SP500, this is the 2020 number I keep mentioning).
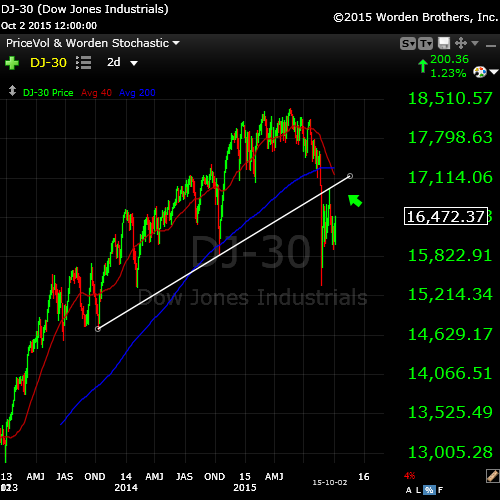
Above is a 2 day chart of the DOW. I’ve drawn in the trendline for the final fifth wave up. What often happens before we take a big plunge, is that the market heads up to “kiss” the trendline one last time before turning and moving in the opposite direction. Based on what I’m seeing in the shorter-term charts (the ABC wave down), this seems like the likely scenario to me. Cycles and history repeat.
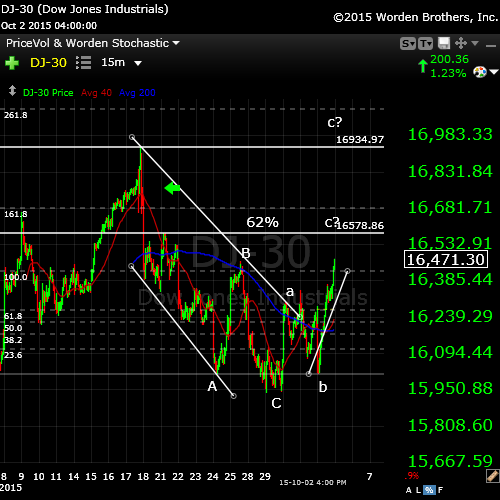
The 15 minute chart of the DOW. This is simply an update of my chart this past week, predicting the rise we’ve experienced in the last few days. My preferred count takes this wave up to a double top at about 16,935 before a major turn. Keep in mind that if my ABC count for the wave down is incorrect, the market could turn at the 62% mark or slightly above.
I have overlain a fibonacci tool, which shows that wave C, as it stands now, will exceed the 62% line if wave C ends up being 1.6 X wave a, which is a typical wave length. That could lead to a fourth and fifth subwave up to the previous high.
So, be alert to the possibility of a turn anywhere from the 62% line up to the top.
I have placed a green arrow on all these charts to show where we should have had a second wave, but where one does not exist, leading to my labelling as a 3 wave move down.
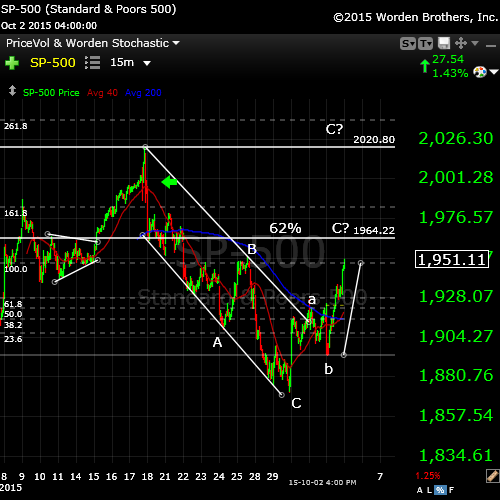
The SP500 (above) sports a similar configuration.
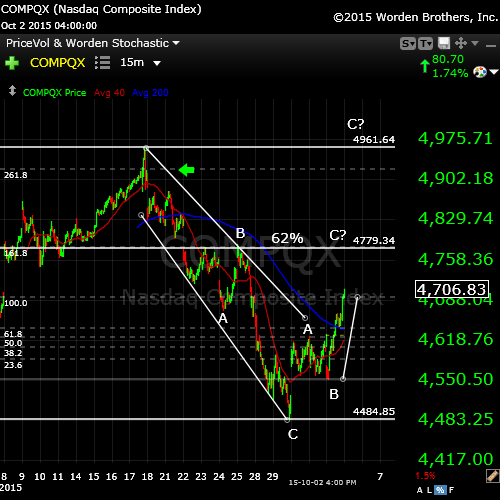
The Nasdaq above is no different.
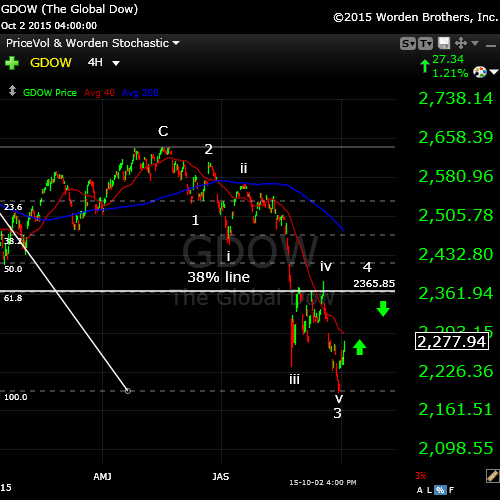
The Global DOW (GDOW) seems to be tracing out my previously posted count. I’m expecting it to rally to the 38% line to trace out a 4th wave before a turn down in a fifth wave, which should be as long as the first three waves. This would fit with the prognosis in the US markets.
Cycles Analysis
I ran this chart this morning (Sunday, Oct 4). I’m showing a cycle top of about the end of the first week of October.
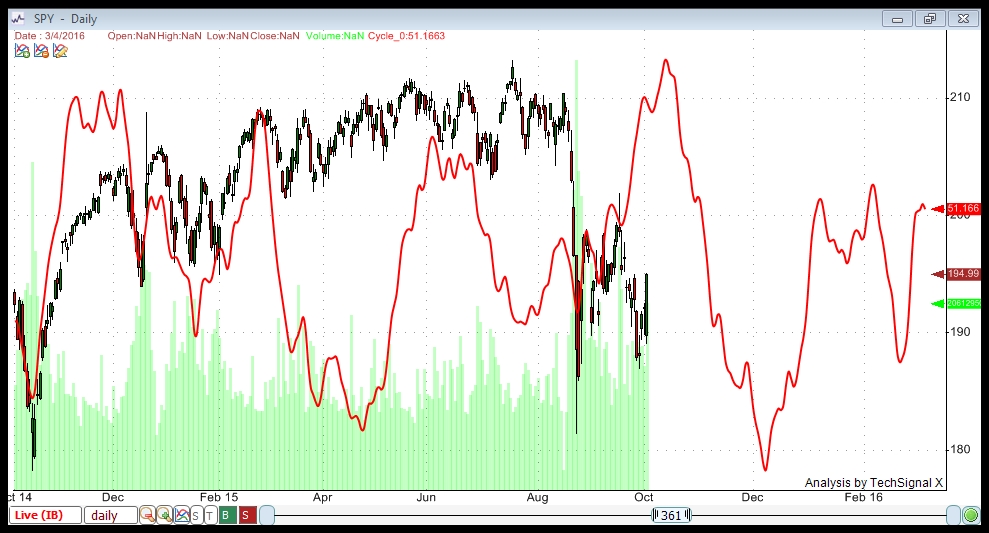
This cycles analysis uses Techsignal X from the Foundation for the Study of Cycles. I’m using data going back to 2002 this analysis of SPY (SPX) and displaying a compilation of all the cycles the software has found over that period. You can see how close-fitting it has been in the recent past. The fit with the current wave is quite stunning and therefore, something to pay attention to.
This analysis suggests a relatively strong positive bias to about October 6.
_______________________________
The Panic Phase and the TPD (Turning Point Distribution) Principle
The TPD Principle describes a period in time of several weeks in which an array of cycles congregate, including gravitational, geomagnetic, and nuclear. It’s around this time that markets have historically topped. I was asked to include a reference to this in today’s blog post, which I’m happy to do. This principle generally refers to market tops (which we’ve already seen on May 20, 2015), but it’s interesting to note how many astro events we have occurring over the weeks surrounding the upcoming major turn in the market.
In his book, “the Universal Cycle Theory,” Stephen Puetz writes, “The TPD principle involves the eclipse cycle as well. The eclipse cycle normally peaks on the first new moon before a solar eclipse. Following that reversal point, it takes six weeks for sentiment to shift from euphoria to panic. Then on the first full moon after a solar eclipse, a panic-phase begins. A panic phase usually last two weeks—ending at the time of the next new moon.”
The dates:
Aug 14 , 2015 – First New Moon before the Eclipse (there is a New Moon happening at the same time as an Eclipse—Sept. 13)
***Aug 29 – Full Moon before the Solar Eclipse (peak of the eclipse cycle)
Sept 13, 2015 – New Moon and Partial Solar Eclipse
Sept 23, 2015 – Fall Equinox
***Sept 28, 2015 – Super Blood Moon Eclipse (start of panic phase)
***Oct 13, 2015 – New Moon (this would mark the end of the panic phase) – six weeks after the Aug. 29 full moon.
So … there’s a lot happening in the area of cycles right around now. Couple this with an ending diagonal Elliott Wave pattern and hitting the 62% retracement level and the period between September 28 and Oct 13 starts to look important to a possible major market turn.


What is good that oil finally goes down and gold goes up
Gold is bid up at heavy volume
Yeah, finally. Been holding GLD from the bottom …
Me too.
I’ve taken Barrick Gold at 6 USD few days ago thinking to add lower but no chance, it’s up 25% since
I’m expecting GLD to rise from 110 (where it is now) to 152 or so before turning around. I imagine that will happen with this next wave down. Some big moves coming.
2020! Great job. But the insecurity of predicting the future, were one right or right for the wrong reasons. Bottom line, one has to go with it and use money management.
My view,
I think we are gonna see a dip or pull back direction 16-19 Okt after that we race again till end off the month..
I don’t rule out a dubble SP top 2135… all possible just like 2007 with negative divergence
After that reality comes into play..
Sorry for my dutch English sometimes I typ quickly
No worries. We indeed have another leg up, not that high. But it will be high enough to make this correction a second wave overall, with a much larger downside. Also eur/usd looks like it’s starting it’s final run to a 38% retracement.
Everything looks like it will top/bottom together … oh, look out …
John,
I just ran a cycles update which I attached to the top of this post. Various elements are pointing to Oct 13/14. I’ll do a more comprehensive review on the weekend.
Thanks Peter.
I bought at the 1909 level this morning well as 1905 level yesterday short. If unable to get to the 1895 level today, I will be taking some time off from trading. Kenny Rodgers use to say in his song. ( Know when to hold and know when to fold) One of my own rules for myself is if at any time I am at a loss of more than 22 points on the SP in a week, I take a few days off. I have not had to take myself out of the game for more than a year. I have had some major discomfort with my hip, taking Tynol # 3 It is interfering with my trading for the last week, making some uncharacteristic trades that I would never do in the past. Over all for the last year,I have done well due to my discipline trading. For now, I wish you all, GOOD LUCK.
Dave, take care. The good thing is that the market is not going anywhere. It will be here when you’re ready. Trading on that kind of medication isn’t a good idea. 🙂
Hi Peter,
Question on your updated cycle. From March through May the cycle went down and the equity markets inverted and went up. How big is the likelihood that equity markets will invert again to the upside when your cycle is pointing down till November.
Many thanks for your thoughts.
Jaze
Jaze,
Good question.
In my experience through the Foundation for the Study of Cycles, cycles don’t “invert” (although it seems to me I might have used that term somewhere inadvertently). Planetary signals are more prone to it, particularly around the equinox.
Therefore at the Foundation, we found planetary signals to be most accurate at forecasting changes in direction.
Cycles, in contrast, are inherent in the asset itself. In my analysis, I use at least 13 years of data. The software analyzes the data and finds the most periodic cycles within that asset.
The rule in finding cycles is that they have to have a periodicity of at least ten. In other words, they have to appear ten times in a row at regular intervals. So, these are regular sine waves, if you will, that appear historically in that asset.
What we’ve found over long periods of time is that they can “slide” in time in terms of the highs and lows, or be muted, or not seem to appear at all for a period and then pick up again. (Edward Dewey found some cycles that would seem to disappear for years only to pick up again at a later time). But this is not the norm.
What you’re seeing in the period of March to May are what appear to me to be weaker cycles that didn’t have that much of an effect on the market. I don’t see outright inversion. Visually, my weakness comment comes from the fact that their amplitude is not that great.
The upcoming cycle (in October/November) appears to me to be quite strong (the amplitude is extreme compared to the cycles ahead and behind), which would indicate to me a preponderance of tops and bottoms at those points. Each of the highs and lows reflects a compilation of the position of twenty five cycles (in this case), and so the bulk of them are coming together at exactly the same point. Whereas in March through May you would have a number of smaller cycles that were perhaps out of sync.
So my answer is that based on the strength of the cycle on screen, the probability of an influence is strong.
Hope this answers your question.
Jaze,
This was such a good question, in fact, that I went back to the software to product another screen to show what’s happening “under the surface.” It’s worth looking at, particularly in light of the October date that we’re focused on.
https://worldcyclesinstitute.com/cycles-in-market-assets/
New post live
To throw a fundamental issue in the mix…
I am surprised the Wal-Mart earnings announcement with the stock down 9% has sent the Dow down 300+
Make that
To throw a fundamental issue in the mix…
I am surprised the Wal-Mart earnings announcement with the stock down 9% HASN’T sent the Dow down 300+
Well, it’s certainly the weakest of the three today.
This move in gold, silver, and the 30 year bond is something. To me it is telegraphing lots of uncertainty internationally in the financial markets. Hard to imagine what is keeping the US equity market from doing what China did on negative news a few weeks ago. Then again we have two hours left in today’s trading.
Gold may hit ~$1188 and retrace. If it goes through $1188, a move over $1200 is very likely. I remain long silver looking for much higher prices : )
I’ve been long GLD for ages, so yes, good to see.
I feel the same way about the US market. DOW is breaking down but the others are hanging in there. Hopefully we’ll get in gear soon.
SPX has broken to a new low. Just the Nasdaq left.
I hope you’re getting my “be careful” posts.