
Update: Before the bell, Friday, Oct 2: Be careful this morning. I don’t like the look of the wave forming. It’s at 38% and may be forming a double top where it is. It has not progressed very much overnight. So, we could have a sudden turnover here, or just a correction of this latest wave. That’s in the ES.
This seems to have ended as a second wave, making the previous forecast even stronger.
Update: End of day, Thursday, Oct 1: Today we began by topping at the end of the first wave up, dropping down almost exactly 62% in a second wave and then turning around in a third wave up. I project 5 waves up to test the previous high at SPX 2020. The third wave we’re in should reach 1.6 times the length of the first wave (~1986 SPX). Then we’ll have a 4th wave, which will retrace at least 38% before our fifth and final wave takes off.
____________________________________
Original Post: September 30: The meanings of enigma: mystery, puzzle, riddle, conundrum, paradox, problem, quandary; a closed book; informal poser.
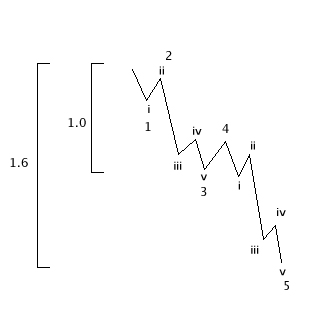 I’m using this in regards to our first wave of the fifth wave, which one way or the other, appears to be at an end. First waves down tend to have a much different structure than the ensuing odd numbered waves (3 and 5).
It’s actually two waves in one and the telling feature for me is the fact that there are two fourth waves within it at about the midway point. Wave 4 typically retraces to the previous wave 4 of lesser degree, or 38% or the length of the wave from the top.
Take a note of wave 2 in the diagram to the right. The absence of this in our first wave down (in the US cash indices) has created the enigma. Are we looking at:
- a motive wave 1 down that has truncated at the top and is therefore missing wave 1 and 2? or
- a corrective wave in 3 wave (abc) that will retrace to the top?
Elliott when he wrote his theory stated that “the waves have to have the right look.” Wave 1 in the US indices across the board looks doubtful to me for a few reasons and so I’m sticking to my call that this is a corrective wave down (until proven wrong).
I think the worst thing in trading is to subjectively decide where a market is going before examining the waves in detail and this is where I see problems with counts. We call these “forced counts.” It’s critical to remain objective and let the waves “speak.”
Bottom line: We’re in a countertrend rally that will either retrace 62% of the wave down so far (creating wave 2) or we’ll retrace to the top and turn down into wave 1 of 5.
That being the case, my council would be to stand aside until we’re certain where the market is going. Either way (going to the top to start over, or turning over in wave 3 at the 62% retracement) will result in a long bear market drop.
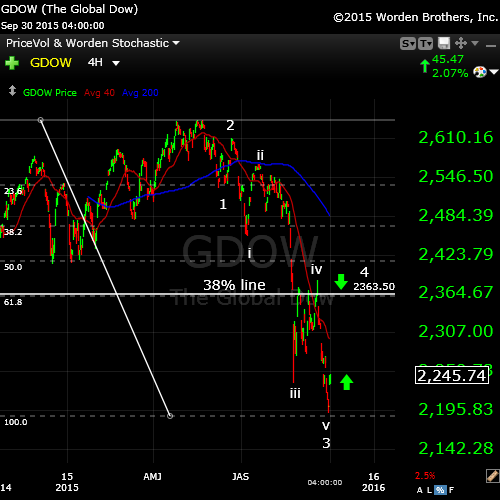
Let’s start with the Global DOW (GDOW). This chart has become clearer since I last reviewed it last week. We appear to have completed wave 3 down (of wave 1 – referring to the chart above). GDOW is now retracing to the previous 4th wave (38%) and will likely turn over into wave 5 of wave 1. It could also rise further to the 62% retrace level to turn down in wave 3 (alternate).
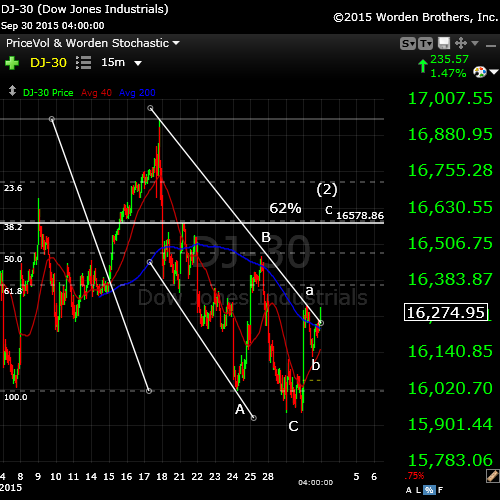
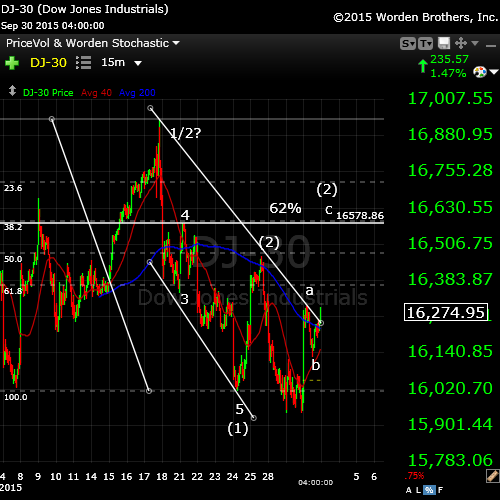
Here’s the US DOW (above). I’m labelling this chart as an ABC corrective wave as my preference for the reasons stated above. This would mean the wave should retrace right back to the top. the biggest challenge is the missing wave 1 and two). There is another problem with the ending wave, which I will share with you in a 5 minute DOW chart below.
You can see today’s corrective wave up starting to form. Today we completed the a and b wave and are beginning the c wave. If the larger wave down from 16,933 is motive, we should retrace to the 62% line in 3 waves. We would then turn over into wave 3 down. If this is indeed a corrective ABC wave down, we will go up in 5 waves (an ending wave) to the top and turn over there, starting down in wave 1.
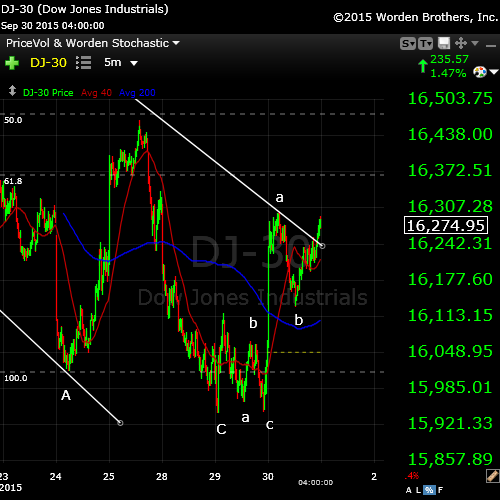
This is a 5 minute chart of the DOW showing the action of the last couple of days. Here’s another problem that occurs on all the indices: The ending wave is an abc wave. In a motive wave down this is not allowed. I see other trying to explain it with explanations that don’t hold water, as far as I’m concerned. This is the second major reason my preferred count is for a retrace to the top (based on the larger wave down being corrective).
You can also see here the abc rise of today. Wave c should continue up over the next few days.
Here’s the alternative count on the DOW (above). I place this here to show the only way I can make a motive count work for the DOW. But at that, it supposed that either the wave has been truncated at the top or wave 1 and 2 are somehow buried in the sheer wave 1 down, which does not give the wave “the right look” and therefore to me is highly suspect.
If this alternate count were correct, we would head up to the 62% mark and roll over into wave 3 down, completing a double pronged wave 2. This also works for the ending wave, as the wave down from (2) would have to be in 3 waves.
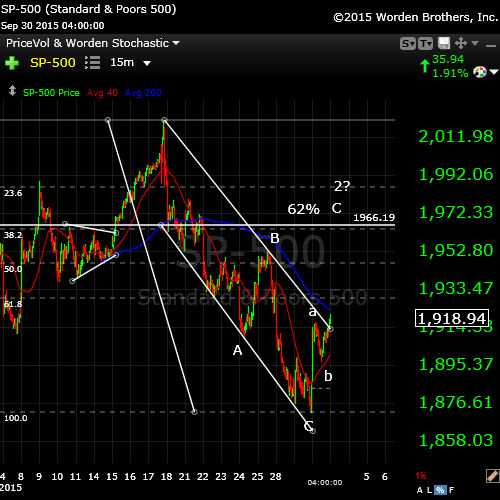
The SP500 (above) has the same issues as all the other indices. I’m showing the down channel here and you can see that the abc retracement from today has broken just about the channel line. The prognosis here is the same as for the other US indices.
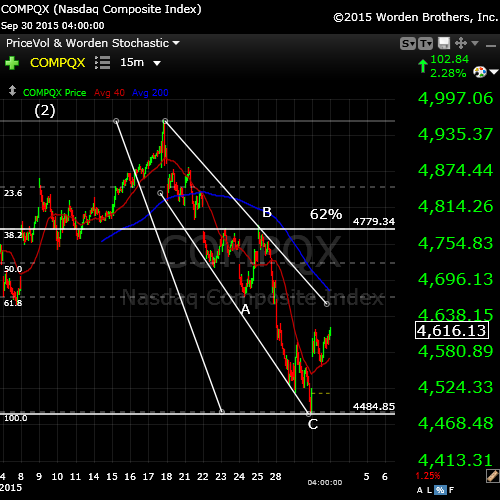
The Nasdaq (above) has the same configuration as the other US indices.
The Futures (ES eminis)
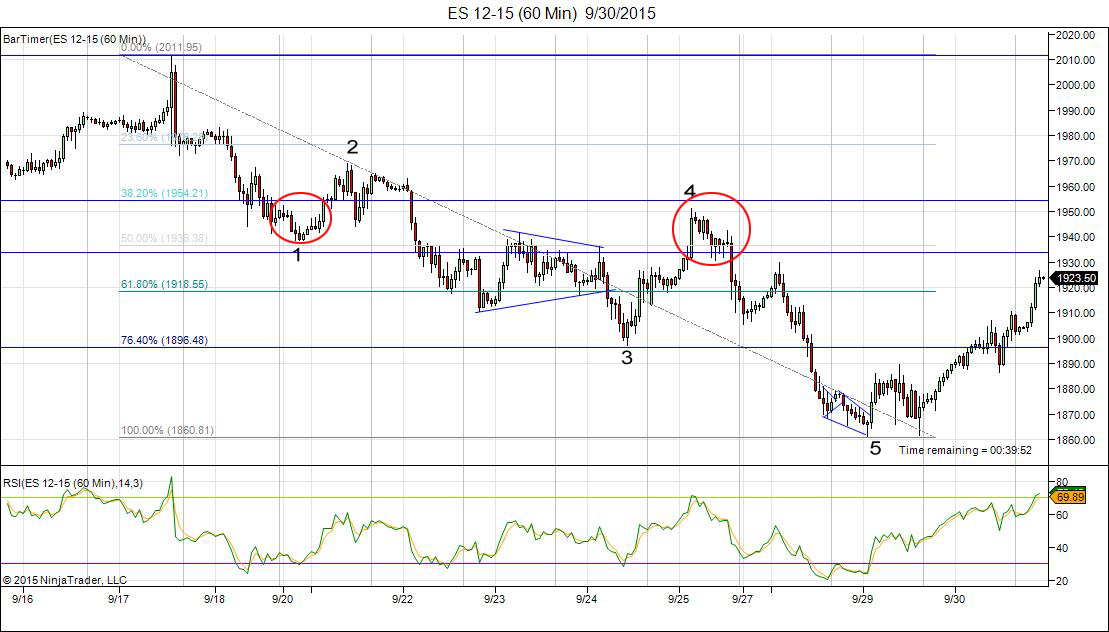
I took a look late tonight at the futures. I backed out the chart to a 60 minute view, something I guess I didn’t do in my analysis earlier. Now, I’ve numbered it as an Elliottwaver would if they were forcing a motive first wave down. The waves are fairly obvious.
Well, here’s the problem. One of the very strictest rules (that cannot be broken) is that the fourth wave cannot enter the area of the first wave. And sure enough, there it is. So, this confirms my count. We have a corrective wave down and we should at least tag the top.
Wave 2 is legal, as it retraced slightly above 38% but I never personally consider this a second wave. I’ve never, ever seen it work.
Cycles Analysis
I ran these two charts last Thursday evening (Sept 24). I post them here just to remind you of what I’m getting from a cycles analysis.
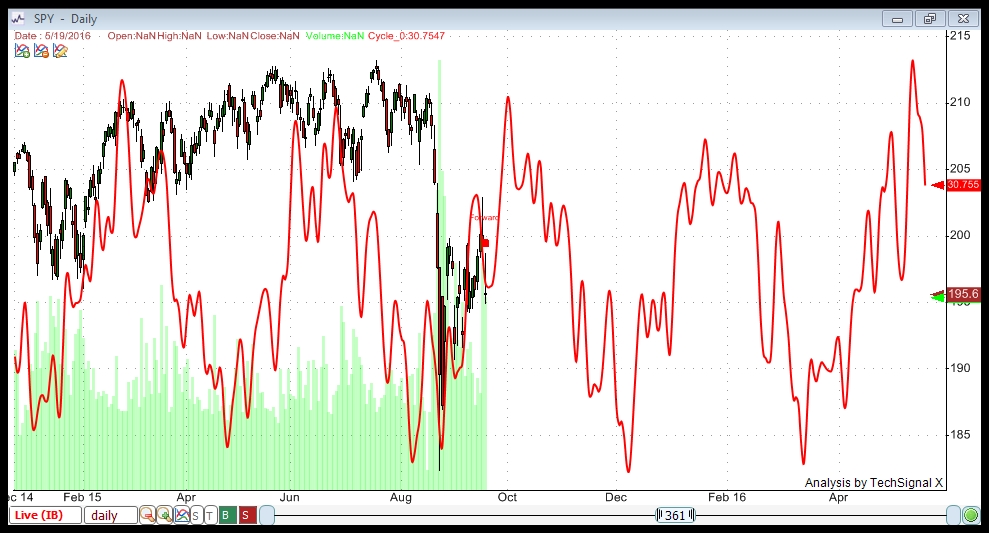
This is the first of two cycles analysis I ran. I’m using data going back to 2002 for both these charts. The software analyses all the data and finds all the cycles inherent in this asset. I chose the top eight cycles that it returned based upon returns in profit (if these cycles had been traded both long and short, from bottoms and tops, over the past 13 years). Cycles repeat and so the past is a good indication of the future. This chart combines all the cycles found to provide a compilation wave. You can see how close-fitting it has been in the recent past. The fit with the current wave is quite stunning and therefore, something to pay attention to.
This analysis suggests a relatively strong positive bias to about October 1.
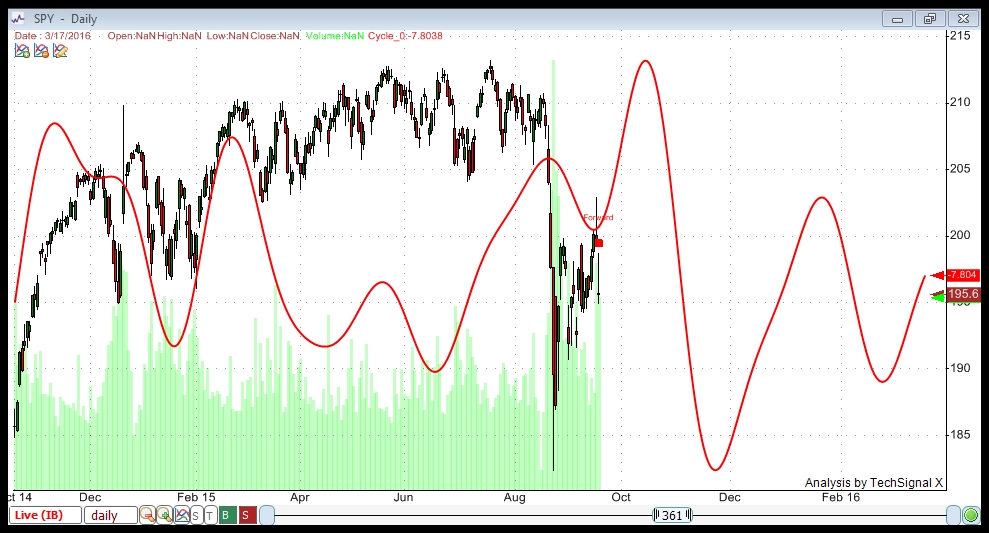
The second cycle I ran is the same as the first from a dataset perspective. This analysis focuses on percentage wins, playing both sides of the cycles. I used only the top 8 cycles (higher percentage win results) to result in a compilation wave. Choosing only the top cycles historically for this asset should provide a better forecast. The result is for a countertrend wave high into October. It is consistent with the first cycle analysis (net profit).
However, I note that the April through August time period shows a market with a possible inverse relationship to the cycle. That sometimes happens in cycles analysis. Therefore, there is a possibility that an inverse wave here (flipping the cycle vertically) suggests a turn down in the very near future, ending mid October. That would be in sync with the first cycles analysis I ran.


I have been warning that this turning point is not in markets, it is centered in government. The number of issues coming to a head are just mind-blowing from the Catalonia vote to separate from Spain to the resignation of Boehner with non-politicians leading not just in the USA, but everywhere. The elections in Greece was most likely the last vote for any political establishment since the Greeks do not expect any promise to be kept.
Yet today just may mark a very strange event that might be extremely important. Today, Russia gave the US 1 hour notice and began bombing both ISIS and rebels seeking to overthrow the Syrian government. It is extremely curious that this beginning precisely on the day of the ECM. Will this prove to be the start of international war?
Lagarde-Christine-imfMeanwhile, Christine Lagarde of the IMF came out to state today also on the turning point of the ECM that the rate of economic growth this year will probably be weaker than in 2014. I had a meeting in Europe with a former board member of the IMF and we had some very frank discussions. To put it mildly, they are indeed worried. The inflation rate for Euroland just turned NEGATIVE again.
So while cash is now KING, stocks remain vulnerable and commodities have no bid sufficient to change the trend, it appears we are headed into the wonderland of our political-economy.
Taken off of Martin Armstrong web site
It maybe very interesting in the markets over the next few days. Oc1 st Oct 5 Oct 6th I will be most short for those days. We are still in a vulnerable short time frame until we take off to the up side to Peters 2020 sp
Good luck to all.
Thanks Peter, get some sleep buddy……n
I had a video project for a client with a deadline and a lot of technical issues … (technical bad stuff always finds me … lol … or maybe I just like the challenge …)
Yout diagram of a typical wave one at the beginning of this article shows 1 and i, and 2 and ii to be the same wave. Is that correct? In your tipping pt comment you had them as separate waves. Thanks.
They’re typically different waves but next to each other and small. Tonight’s chart of the GDOW shows this quite well. I didn’t want to get that intricate with the diagram. It depends very much on the magnitude of the wave as to how discernible each of them are. Hope this helps.
Thanks Peter,
look at the market. You appear to be right once again. Market wants to go higher in spite of everything
Well, I’m going to miss this move again tonight … I need to get some sleep. I will leave it all in your capable hands. I’m waiting for the big short. I think we’re in wave 2 up (not 4) – bigger picture and that we could go up a little further than 2020, but we’ll see what happens.
I put the target for the turn down at ES 1934 or thereabouts. Wave 5 at 1.6X wave 1.
I should have posted a chart of the ES. If you back it out to a 60 minute chart, you’ll see that in this big wave down, the top of wave 4 is well within the area of wave 1 … a definite EW end of story. It’s a corrective wave. Ok, I’ll grab it and post it … you talked me into it … haha.
Peter,
if you accepte for the 2nd to retrace only 38% of the 1st, I don’t understand what is wrong with my count at the 5 min ES chart:
1st – from the high 2011 to 1975;
2nd – from 1975 to 1990 ( 38%);
3rd – from 1990 to 1896 (2,62 of the 1st). There are 5 waves in the 3rd (1st and 2nd at your chart correspond to 1st and 2nd of the 3rd);
4th and 5th – like in your chart (5th is also around 2,6 of the 1st).
In this case the wave 4 don’t overlap with the wave 1 of the same degree
Your wave 2 doesn’t retrace 38%. None of the fib relationships work.
I’m right on the chart.
1st – from 2011.38 down to 1975.63
2nd- 1975.63 up to 1990.63
The retracement of 41.95%
Suit yourself. There are so many guideline problems with that wave, that this discussion is meaningless. The rule of alternation, the look of the wave, the ending diagonal. Make sure you read each of the guidelines on page 86 of the Elliott Wave Principle.
Sure that in 60 min chart you don’t see that 1st and 2nd
I added the ES chart, with a comment on it.
Here’s something else you can go by … if you have a chart of YM up, you can measure the waves up really accurately. Wave 3 is 1.6 times wave 1 and then we’re in 5, which should top out at 16366, which is the previous wave 4. It’s actually fairly close to the 62% retracement level. My point is that the structure is really easy to see and measure.
I am still maintaining my shorts from late last night trade at the close for now.
Hi Dave, what technics are you using to make confident decisions ? I am asking as I realised that you are also spot on trading the cycles. If I can learn something I am very thankful. Happy trading. Jaze
No Jaze, I am not always spot on. I have not made any money from yesterdays trade. Only when I sell, determines if I made or lost any money. I am not out of the back woods yet. More later, I have a few accounts this morning to trade and re adjust . Good luck Jaze.
Strictly for trading discipline reasons sold half my shorts 1903 futures. Not much of a gain.
I am completely out. Sold the other half at the 1902 level. On Paper 3point gain. But I consider that a loss for all the stress I had to go thru on that trade. It was NOT worth it. Going for a starbucks coffee and see what the next trade I may do. All the best every one.
Yeah, caffeine’ll fix it … lol. (from someone who drinks way too much of the stuff ….)
LOL That Starbucks coffee cost me almost 10 points of profit. Note to self…………. Buy starbucks coffee before the trading day.
LOL WOW, can some one tell me why this market has not dropped right here? 1902 futures.
LOL I need a holiday.
It’s a B wave, Dave. We’re going up, as per my blog post. C wave (or 3rd) is next.
For a time being they retest yesterday’s support 1890ES.
If they break it they will go probably to make a new low?
Crazy~~
Soon as you post, we drop 10 points to 1892 ESZ5 @ 12:10 PM EDT…
Peter,
What would be the lowest you would expect here for the C wave to start?
thx
62% retrace is the norm (or previous second wave). We’re about there now. NQ usually goes a little lower, but it’s reasonably tame at the moment.
You can also watch the eur/usd as it’s in lock-step but inverse.
UPRO long 1894 price 51.07 1/2 position. I have another half to go if the price comes back down. short day trade only.
I forgot to mention, the vix action was very supportive for this up move.
Dave, what is it you look for in the VIX?
thanks…
Hi Gary, before I pull the trigger I take a quick glance at the vix actions. I noticed as the sp was coming down into the futures 1892 level. The vix was not creating any alarm bells for follow thru to news lows.. It can be very tricky during Mercury retrograde. I have noticed over the years, technical s graphs, EW,cycles, FIbs are out of alignment. It is more about the feel of the market. What my gut instinct says to do. I always notice how my body emotions feel before I pull the trigger. If I feel all tense and my emotions are running high in my body, I back away from the computer and go for a walk. If I am going to make the right trade, my body and emotions are very calm and relaxed. I NEVER TRADE when I have had a glass of wine ect . I do a lot of meditation which helps me focus and grounds me to be a better trader. I hope that helps
I think that is right thing to do what you wrote down walk the dog on time and make sure you have a clear mind.
When I look at today’s action I think we will make a high tomorrow or monday and after that it’s down into Oktober 9.
Cheers.
John, I agree with you for tomorrow ONLY. I see new higher highs for tomorrow. I plan on being short over the weekend due to my concerns for next Monday cycle day that has been pinned on my computer for some time. If we do indeed reach higher highs tomorrow, I will surely short the market late tomorrow.
PLEASE use your own discretion with this possible trade. How does the info feel to you? How does your solar plexus feel when reading this info. Does your body tighten up or does it feel like the truth? This goes for any other trade that some some one may present to you. All the best John.
Thanks Dave,
Life long lessons (lol)
Cycle top friday and turn monday… after that we will go up again
I was 13 years old when kungfu was on TV very impressed of course..
https://www.youtube.com/watch?v=A2YS6KVrQqc
It is time to sleep for me good night…
These are motive waves and looks like we’ll do five, so I would expect us to end at the top (the SPX 2020 scenario). The third wave should get us almost there, allowing for a deep fourth and then a fifth. We could also exceed the previous high, of course, but I’d bet we turn there and start down all over but for real this time.
This wave will likely be 1.6 times the length of the first.
Thanks Dave!
I agree 100% with the “gut / feelings”. More people should be aware of this. I’ve included a link to a screenshot of today’s action. Pretty successful.
NOTE: the chart is painting based on the number of contracts traded. NOT time.
The arrows show when the trade is done and the direction.
When the AO (Awesome Oscillator) goes from green to red, it is a “potential” short. You simply verify with the Aroon being RED on the top line. Vice versa for a long. You see a real good long that is still live at the moment (3:06PM EDT). See the up arrow at ~12:30.
Aroon black is up and the AO is steady green getting shorter and shorter. The continuance above the “0” line @ 14:07 shows the upward strength.
Be ESPECIALLY aware that EACH bar on the grid is 4 SnP points !!
I generally am happy with 3 points.
When the amplitude of the AO is really high or low (like today), I will place a trailing stop and be happy no matter what…
If I make 3 or 4 points on the day I go play golf or something.
Years ago I would make $200 or $300 in the morning and be down on the day because I was a greedy idiot!! If I am up that much now in the morning I am gone !! Who cares what I miss later in the day?
What you see in the chart at the link are three trades (two short, one long) that yielded 8 points each with less than 4 points drawdown… A good day! I didn’t trade it all either. Just one.. Other stuff going on and it is a cold rainy day here.
Enjoy…
http://www.screencast.com/t/VX8HGGIomUd
WOW Gary. Very impressive. This is what this blog is all about. Sharing and helping others to be better traders. I encourage you to post more with your graphs each day to make this a better place for all of us. Hopefully we encourage others to post here who have not yet posted their views on the market. Right or wrong, we can all benefit.
Yes!
I feel that is what this blog is about. That is why I share. Most places you find people pimping some idea and they want big bucks.
This chart is the USZ5 (Dec Bonds). Exceptional day here…
The short @ about 10:05 was a gift.. Very thankful for that….
I took a calculated risk going short BEFORE the Red Aroon shot up @ 10:15.
“If” the Red AO bars had flashed green, I would have covered and waited for another opportunity.
Keep in mind. From here out ALL Bonds should be a short on a rally. I trust Martin Armstrong… We just need to be prudent and follow some rules with discipline.
http://www.screencast.com/t/wr0cyxEPYiZ
Gary, correct me if I am wrong here. On his blog yesterday, he stated that the tree could be shaken to bring more money into the bond market. In other words, we may still have some nasty down days to go. Oct 5 th -6th with lynsdly model.
Looking at the 2011 period aug/okt the last up from the lows took 3 days before we went down to new lows that took 5 days..
I am selling 1/2 position I picked up on upro at 51.22 Trading discipline # 101 I will keep the other 1/2 for now.
Bear and Pigs make money, pigs lose out.
WOW, Let me rephrase that quote. Bulls and Bears make money. Pigs lose out.
Laugh of the day, thanks Dave. 😉
Cheers,
W
Cheers Whazzup !
Peter, that’s great with your up date. I was going to ask if the waves would allow for a down day Monday. Again that depends on tomorrows action. I will certainly know by 1:00 – 2;00 afternoon on whether I take that trade or not. All the best.
We’ve actually done 5 waves up in futures, so they’re going to have to correct on a smaller scale (a second wave of the third). That may be tonight or it may be tomorrow. I think tonight, but I don’t know for sure.
It means that ES make another 3-5% until Monday morning according to your target?
I added a short little update this morning. I don’t like the wave that’s forming, nor the progress overnight.
Thanks Peter,
I’ve got you warning just in time to add some more shorts before the slide
That was the labour report. However, it didn’t do any real technical damage, just another second wave, so I expect we’ll head back up again. We’ll have to see.
But it looks like a reversal in EUR
It makes a lot of pain to carry trade
Now everything depends upon market perception, if bad news are good news or bad news
So I think this is going to be a good week for you …
There is a chance this wave up could fail and retest today’s low in ES. The very first wave up today looks to be in three. The euro also has the same look in the opposite direction.
Look at EUR/US gold
Yeah,you can see what I’ve been talking about – in lock-step, but inverse.
Look also at big banks US
Peter,
how do you see it?
Just a correction or reversal?
Haven’t seen your previous answer while taping
Maintaining my 1/2 position Long. Waiting to pick up the other 1/2
I fully expect the market significantly higher, from the lows into the close. Waiting still to grab the other 1/2 position to be fully invested long into the close. Good luck every one.
Yes, this should be a good run, right through Monday at least. Target for ES: 1994.
Interesting post from Martin Armstrong just now.
“The jobs number came in sharply lower than expected showing that U.S. employers have not been hiring over the last two months and wages as well fell in September. With this turning point 2015.75, we should begin to see declining economic numbers and a closing on the Dow below 15970 today will warn of a retest of the August low.
The weak jobs number is now raising new doubts the economy is strong enough for the Federal Reserve to raise interest rates by the end of this year. We are starting to see that higher rates are linked in thinking to stronger economic growth. When the economy declines, rate expectations decline. This is the real view of interest rates and their relation to the marketplace.
If the August low of 15370 gives way, we appear to be headed to that slingshot move where we first move down and trap everyone bearish to provide the fuel to rise again initiated by short-covering.”
I really have the feeling that this slingshot move to the upside will happen! Hopefully Peter’s expertise will allow us to surf these waves! I like they way MA details his parameters. Cut and dried. IF / THEN / ELSE.
If we go below 15370 there will be a huge thrust up to fool and freak everyone out. If we CLOSE below 15970 today, the odds of going to the August lows are high.
My method worked well this morning although you must be willing to tolerate a large drawdown (8 points). When the Aroon red shot up right at the 8:30 news release, it and the steep declining AO telegraphed how low the price would retrace.
Evidence of the rally came at 9:40 when Aroon black shot up accompanied by shorter and shorter AO green tails. This long would be expected to go to at least the pink fibonacci line (diagonal arrow) and even the green one which it did.
Gain – 11 points
The opening short gain was pretty crazy ~~~
http://www.screencast.com/t/fIP0VuiVfX
I am a little bit concerned that the first wave up today (futures) does not appear to be in 5 waves, which means this wave up may ultimately be a correction. But we’ll wait to see what transpires.
I have the same concern about the cash indices.
Great info Gary. I am still looking for the dow 14,320 down the road before we sling shot to the upside. Right now I am just going to play these swings that Mr Market is giving me. I still believe the Market is going to rise significantly to unload some of the bears (weak hands) before we plummet.
I think this wave up is about to fail, so head’s up.
I missed my bid by 3 cents for my other half. Still half position long. Waiting for a retrace to get back long into the close today.
Peter, do you see a viable way for the Dow to close below 15970 today? That is do you foresee a wave count that would reasonably fit?
If it does, the short to 15,370 next week followed by the long to new highs will be epic to say the least!
Not really … the wave down looks corrective, although not complete. I think it needs a double bottom. All the futures have retraced 62% and are stalled. So I’m not seeing a plummet today. I think we need to somehow retrace to today’s high.
Right now, the ES futures are continuing to make recovery highs. However the bond (USZ5) is maintaining strength. This tells me we could be in for a ES reversal back down at some point. I will admit I am infected with Armstrong and I am not like him. He isn’t looking for a decline. He simply knows that if it happens (15970) we will exceed the August lows. I tend to get hooked on a concept and then expect it to happen. Very frustrating… Admitting it and remaining disciplined is all I have : )
I am looking right now at ESZ5 and expecting 1913 and then a reversal lower….
We hit 1913 backed off three points and then powered back up through it. The Bond didn’t flinch. Interesting day we have…
Gary,
What seems the most logical from an EW standpoint now is a retrace to 62%. In SPX, that’s 4779. That would also put wave C up at 1.6 times wave A. Because the A waves in all cases are in 3 waves, that makes a full retrace to 2020 much less likely imho.
If we turnover at 62%, the odds are very high we’re going into wave 3. That would support the Armstrong prognosis, but then, I think we all know where we’re ultimately going. It’s the interim that’s the challenge. I am preferring to wait for the big short.
Peter, you have sp 4779 ?
For the 62% retrace level, yes. Which would make wave C exactly 1.6 times wave A up (which is in 3 waves), so this would be my suggested target.
Everything seems to “work” in cash and futures.
Oh, sorry Dave!!!! That’s on the Nasdaq. I didn’t realize I’d changed charts. Still feeling the grogginess from loss of sleep!
SP is 1996.
Make that 1964!! Jeez …
I’ll post the targets numbers for the 62% level on the weekend. That will let me run them through several other people to make sure I’m actually awake when I do it … lol.
To add to that, in ES, at equal length wave A, this wave C brings us to 1952 ES which is very close to the 62% retrace level.
In NQ, same thing. The NQ with wave C equal to wave A brings us to 4300, which is also the 62% retrace level.
This market is really crazy.
It takes 40 points direct in two hours on bad news
Backing out the futures, our B wave was a 3, A looks now to be in 3, so this C could be a 3 or 5. I think a 3. We may get a good-sized B wave here to take us down to ES 1907-1910, which would equally split up this C wave into 3. That could leave Sunday to finish up the job.
But it pretty well sidelines a trip to 2020 in SPX and means the first bigger wave down from 2020 was truncated.
Otherwise, if they continue just to go up with this tempo you will get your target before the close
Unlikely. Then Sunday would have to sit on its hands. No, most likely we finish up Sunday. Because of the shape of this wave, I don’t think we’re going to the top. It can be an alternate.
I would be concerned if we get to today’s high and stall. ES 1930. That would zero out the corrective waves and could result in a turnover. Since we’ve kept going up, I expect we make it at least there. But this whole pattern up looks corrective to me now.
I agree with you Gary, If I had my other half this morning I would unload my 1/2 position (1913) and still have my other half position into the close. I re booted my cell phone last night, my alarm did not go off this morning. Did not get back to the computer until a half hour into the trading morning. Quickly put in my bid just before the market went up on me. If we get a good re trace within the next hour, I will go back to a full long position. All the best
I would really like to see it re trace back down to the 1911 level ez to go back fully long into the close. Mr Market does not usually give you a 2nd chance thou. Will see shortly
My measurement now says 1909-10.
Sold my 1/2 ez 1920 Waiting for my re trace to go back long
What is holding this market up ? 1921.75 ez LOL, I want my retrace to 1911 ez
I see it comin’ but it’s likely at the close …
Peter,
I think if the market goes up like you say till 2000 or 2020 are you still convinced
it can reach that target by monday and after that drop to new lows…
Mahendra is sure that the down turn in the market will end Okt 10 and after that it will rise to new highs until now he has a very good trackrecord.
John,
I only think we’re going up to 62%. We should easily get there on Sunday.
John, I beg to differ with you on Mahendras track record. He stated back in Aug after the major correction, he did not see that correction.
I may not be able to get back long. If and only if the market rises into the close from here, I will short it for Monday. So I have two alternative trades I can make a play on today.
You give the market 2 hours to screw around with 15 points and there’s no question it’s going to get creative. I still think it has to correct here, but the low will be at the close …
Brutal.
Wrongo I was on the correction. That was small! Nowhere to really get in …
That’s true
But I also have a feeling that this comming week is very important
Are you still planning to short this market if we keep rising today ?
I’m not shorting today, no.
It will depend upon reaching the target.
Thanks Peter,
Yeah you are right we have to see a right shoulder to complete this patern
I also follow somebody in Holland and this guy is spot on everytime with turning dates.
He also has monday the 5th after that Okt 12..
He can not tell me if these are tops or bottoms but the 5th has to be a top..
Peter,
You say we can reach the retrace level sunday night in the futures but also in the cash index?
They move together. So we will likely open at the high. That’s typically the way it works.
I am going to start layering the shorts for Monday Shortly.
WOW, What a move. I most definitely will be shorting this over the weekend for Monday.
Are you crazy we will see new highs by monday…
I have my plan, I will execute it. I have always gone against the herd. Good luck if you are long. I am waiting until near the close to be short.
Again good call Dave,
I did hold on to my november puts a mistakeI had better sold them and bought them back by Monday.
Not very far to go. Monday should be down and it will result in a wave at least 1.6 times the first wave down. I’ll chart it up on the weekend with some longer term targets.
LOL, I have never been called crazy before. Yes, I do think we will see higher highs Sunday night. I am more concerned about Mondays trading day.
All the best
Well, be careful, we could still go to SP2020, although I’m seeing lot of divergence and my preference is for a turn around 62% …
This market is on steroids ….and suffering from bipolar disorder (lol)..
I feel sorry for all those traders that are short.
This C wave is also in 5 waves … after 5, it’s all over. The fifth isn’t complete yet. But the lengths aren’t traditional (it’s a countertrend wave, after all, and they don’t need to be), but SP2964 or thereabouts looks about right.
HHHmmm I think SP 3964 (lol)
Well Peter,
Thanks you showed us E.W. and I m looking forward to read your next report and your target on the downside for the SP.
Good weekend all
Cheers..
Just enormous short squeeze.
3% on bad news
And that just proves that events have absolutely nothing to do with determining the overall market. Mood of the herd does that and events are a result of the mood of the herd.
I always laugh at the financial news, cause they try and equate the move with events all fall all over themselves trying to explain things like today. But the market moves in pre-determined waves. We already knew we were going up. Didn’t matter what the event was (it has a short-term effect, but didn’t change the technicals).
Thanks to this…
spoofer in eMini using a order size of 584 $ES_F $SPY
— Eric Scott Hunsader (@nanexllc) October 2, 2015
We’ll likely come down a bit in a small 4th wave in ES and then complete the 5th of 5th of C Sunday night. That’s my guess, anyway.
Peter,
how do you consider such wave in five if there is no any retrace more then 20%
Countertrend waves can break the rules. Trend waves can’t. Countertrend markets are much more difficult to trade. So while I will sometimes talk about 5 waves up in this market, they can be overlapping, not the right lengths, etc. But in a trend, they have to have the right look, be the right length, etc. The trend is down.
I can be way more accurate on waves down than I can on corrective waves.
Also waves in 5 in a countertrend don’t exist on their own. They will always be part of a 3 wave pattern. One or two of the waves within that pattern may be in 5 (the A wave or C wave, not the B, of course). There are lots of EW rules. Some hard rules, some guidelines. You have to know them all and use some experience and logic to figure it all out.
But trends are great, because they are generally easy to measure, decipher etc. Except for the first wave down we had over the past couple of weeks … haha.
Thanks, Peter,
waiting for your post the weekend
I don’t think there will be anything new from what we’ve talked about. The labelling has been cleaned up, though. This seems like wave 2 that we’ve been waiting for. Wave 3 should be a “nowhere to hide” wave. Wave 4 only retraces 38% and 5 will be longer than 3 likely.
I find only one candle that resembles this on we’ve got on Friday.
It was more or less at the same level the 21 Oct 2014 three days after the dip.
It was just the beginning of the rally that has taken the market another 150 points higher
Bought at the 1936 level via SPXU……. SHORT !!
One more batch to go regardless where the market is towards the EOD>
The vix was only down less than 6%. I would have expected more. Have a good weekend every one.
Jeff Cooper
early Oct 1987 largest rally point day in history to that point hmm for you youngins that was before the crash
Dave,
I remember Oct 2014. They have also done 3% rally on no news just the day before the decline
It should be a very interesting Monday thru perhaps Tuesday. Have a good weekend Dimitri.
PALS Update:
Phase: + all week, out of full moon shadow
Distance: neutral all week
Declination: + Mon Tues, – Wed to Friday
Seasonals: + Mon Tues, – Wed to Friday
Planets: post Mer Inf Con, bullish, Uranus opp on Friday, bearish, wash
Summary: Long into Monday open. Will stay long until Tuesday and then see what price is then. May sell on strength Monday and buy back at end of day. Looking for rather positive week especially Monday, Tuesday, and maybe Wednesday.
Thanks Valley.
You are welcome, Dave. I really appreciate your opinions as they show your knowledge and experience. Will continue to read with interest.
Solar cycle gives a high 10/4 of the same magnitude as 5/15 and 7/20. Other Gann timers give 10/6 as major date. Lunar degree cycles predict a turn on Monday when European markets close.
Then down into 10/16, retrace into 10/25-26 and down into 11/16, what wil mark a major bottom. After that retrace up into 2/26/16 in ABC.
Thanks Andre,
I was surprissed by the rally that started Sept 30 but later I saw the mistake (mercury again)
So next mercury midpoint latitude is Okt 7 most of the times the turn is 1 or 2 days earlier.
And the next is Okt 15.. so I m with you
Cheers.
John,
Would that be geocentric latitude or heliocentric latitude? I looked at both but don’t see the timing you mention.
I know Mercury is max west 10/16 but I see that as elongation. It’s the reason I gave that date.
Are we speaking different languages?
Cheers,
André
Andre and Whitemare,
Go to Time-price research -searchblog-typ in- mercury latitude cycle…..
Succes
J
John, When you refer to Merc midpoint latitude is that the midpoint between 0 degrees Latitude and its maximum S latitude? or if not what is it?
Thanks
Thank you Andre , ….nick
Thanks, André,
Seems to fit with my new post. My cycles analysis points to oct 6 or so.
Peter,
do you think that the drop of 150 points occured after the 17 of Sept could be the truncated 5th wave after the extended 3rd of the August?
The chart now resembles to that one of the Carribean crises of 1962.
That would mean more upside now.
I know your answer in advance: “No, learn the EW theory”
🙂 Good answer. I would concentrate on what’s happening now and not try to equate it with anything in the past.
I don’t have much reason to change my forecast, although I’ll put up some charts today. We should continue up to a double top at SP2020 is my preferred count.
New post https://worldcyclesinstitute.com/remembering-the-bigger-picture/
Well, based on every ones views today. I am about to lose my shirt and maybe my pants. It was nice knowing you all.I guess we shall see by the end of the day Monday thru Tuesday. Good Luck every one.