I think the signs are there that I’ve been doing this way too long, having been slammed earlier this week for being able to count waves and taking a stand when nobody else seems to be able to (in my small sphere of influence, at any rate) .. sigh. But, here we go again!
Let me state emphatically that I’m am NOT suggesting in any way that you follow what I’m doing or that you trade the market. This is my technical analysis and the way I’m looking at what’s happening now … again, from a purely technical perspective. I’ll also explore some external factors below (after the technical).

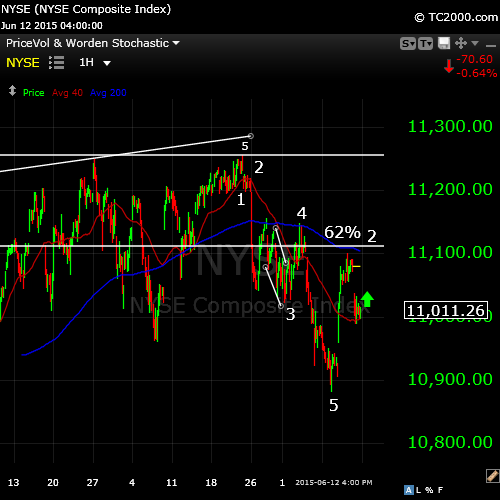
Above is the NYSE. I like to concentrate on it as it usually has the cleanest waves and it’s the largest cap index in the world, so it’s the gorilla in the room. Everything else is likely going to follow it (Nasdaq, DOW, SP500) and, in fact, they are. I called the top on May 20 and the first wave down. My decision on the top came from cycles analysis (below), which told us that it was likely to happen around May 15, 2015 (the Elliottwave structure simply confirmed it).
The chart above shows the first wave down (actually a combination of two larger waves down, so there are a couple of ways to label this). I have identified an intermediate ending diagonal (with a couple of slightly converging diagonal lines). Overall, it has the typical look of a first wave down and follows all the Elliott Wave rules, including the correct fibonacci ratios.
The second wave has retraced 62% (which is what a second wave does) and, despite a majority of charts I’ve seen posted (including Elliottwave International), it is a corrective wave, which means we’re going down. It is NOT impulsive.
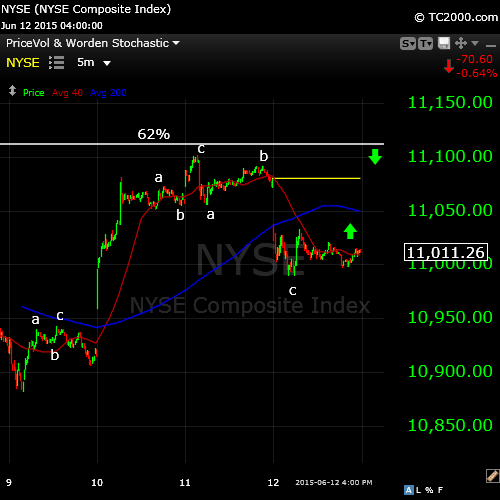
OK, so let’s zoom in and see why it’s a corrective wave:
 The second wave up is actually a double zig zag. I have labelled the sub-waves which are all in 3’s. (It makes me crazy when I see all these supposed credentialed analysts unwilling to take a critical look at subwaves, simply by zooming in!).
So, let’s review the Elliott wave rules for impulsive waves (from the Elliott Wave Principle):
- An impulse always subdivides into five waves.
- Wave 1 always subdivides into an impulse or (rarely) a diagonal. (however, above, it’s in three waves)
- Wave 3 always divides into an impulse. (in the chart above, this could be arguable)
- Wave 5 always subdivides into an impulse. (it’s in 3 waves above)
This wave does not conform to points 2 and 4. So, clearly, wave two is a corrective wave. Period. You can see 5 waves, so it’s complete. It has to retrace.
The next wave down (on Friday) was also a three and so, it has to retrace, unless it heads lower immediately. I doubt that’s going to happen, because if you look at the chart, wave two has not quite reached the 62% retrace line. In my rather extended time with Elliottwave, I have rarely seen a second wave not make the 62% retrace line.
The bottom line is that I expect a retrace to 62% and then an immediate turn to head down into a third wave, which should extend at least 1.618 times the length of the first wave down. That’s how I’m playing the the current wave patterns.
Let’s look at the long term cycles analysis, compliments of the Foundation for the Study of Cycles:

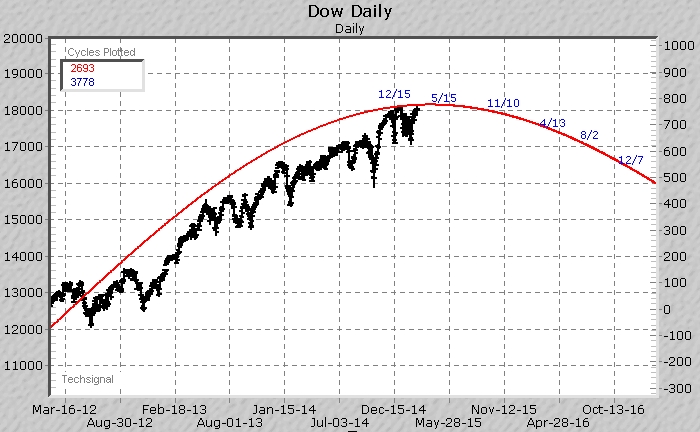
This is a long-term DOW chart. This analysis was done in early 2012. We’ve brought the chart up to date by showing the DOW approaching the wave top. The top was projected to be about May 15, 2015. The ability to do this comes from Edward R. Dewey’s original algorithms that we have incorporated into ground-breaking software that allows us to run cycles analysis on an market asset on any index anywhere in the world. You can see a video on the software at TechSignal.com.
If you’re new to cycles, here’s a quote from Lee Iacocca, past president and CEO of Chrysler, from 1978-92:
| “As far back as I can remember, I’ve always been a strong believer in the importance of cycles. You’d better try to understand them, because all your timing and often your luck is tied up in them.” |
| Lee Iacocca in Talking Straight |
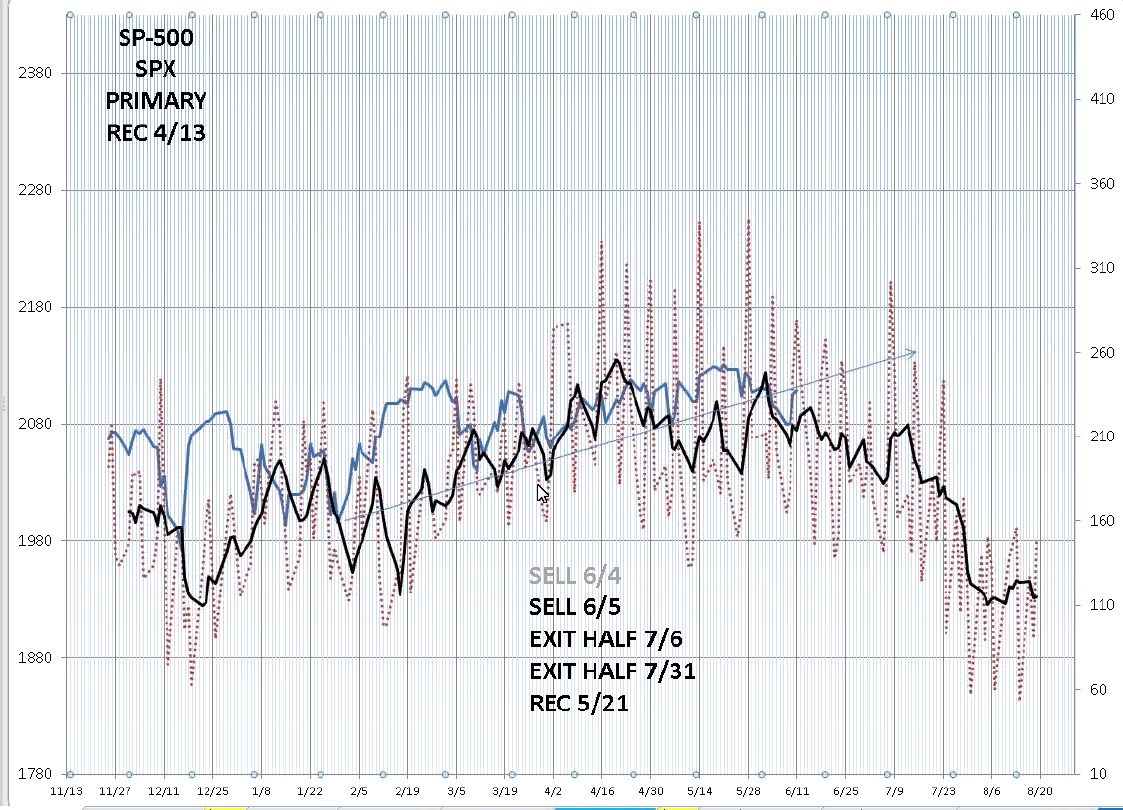
The Foundation for the Study of Cycles is also the leader of planetary analysis of markets and events around the world. It’s been known for decades that markets are at least indirectly influenced by the movement of the universe (in fact, everything that happens on Earth is, and that’s the foundation for the information presented on this site).The most recent and ongoing analysis that we review twice a week shows the projection of the SP500 over the short term.
 In the chart above, the red lines are the planetary signals, based upon Edward Dewey’s original algorithms. Only the Foundation for the Study of Cycles has the ability to produce this information and they’re the most advanced in the world in this technology.The black line is a five day moving average. The blue line is the actual price of the SP500 to this past Thursday, (June 11, 2015). If you’re interested in finding out more about the Foundation services (to be part of the weekly online analysis meetings, you can contact Julio Chavez).
All the analysis using these different data sources leads to the same conclusion and why I’m able to be so accurate on the movements of the market (so far …). Elliott waves provide price projections while cycles provide market direction and turns. It’s a powerful combination when used in tandem.
The bottom line is that we expect the US market to head lower now into the beginning of August before a major bounce (but not to a new high). Longer term, we’re projecting a larger set of waves down to begin in the September/October timeframe. If you sign up on my site (to the right), you’ll receive more information as we move forward into what is going to be the largest bursting of a market bubble in history.
Stay tuned …


Good work! Thanks.
Another excellent analysis and explanation… thanks much!
It is a wonderful count. Great work as always! Do you have a similar count for SPX? I agree that the Dow Jones count clearly shows 5 wave structure has been completed.
Thanks for the comment, Erick. The count for the SPX will be virtually the same.
Peter,
You inspired me. Now have my own Dewey algorithm, although I prefer the 19 year lunar cycle as leading. The 2009 low predicts July 6 as a possible turn. Other techniques point to mid June (16th). On a 6 year plus cycle 20 days off is not too bad.
Very interesting stuff! Thanks a lot.
Andre,
I have a script for a video I hope to get shot today on Dewey’s 19 year real estate cycle, but I have that ending about three years from now, with the bottom of this market, around fall, 2018. I peg the 7 year cycle (Steve Puetz in his books puts it at 6.3 years harmonically) as ending now, but I don’t have an exact date in front of me. For this post and market projections, I’m primarily going by Elliott. I pay attention to cycles on a larger scale, but I don’t find them to be that specific (to the day). There seem to be a lot of pointers to this time period, as you mention.
Peter,
I am researching this topic right now and I think I have a solution. If this is the 9th 19 year ending now, the fifth ran from early 1920 until end 1939. The exact midpoint was the end of 1929. We all know what happened in those years. Counting way back I see 476 a.c.; the end of the Roman empire. In 1502 Amerigo Vespucci discovered America. And I am sure I can find more examples. These dates come all from counting back 171 year cycles from 2015. Can this be coincidence?
For the 19 year cycle I have a technique I am willing to share, but not in public. The 171/172 year cycle is just an assumption but the fit- as described above- is remarkable.
The Dewey structure gives many subcycles on 19 like 2,1 and 4,8. this would make 7. But i.m.h.o.19 is the main structure. 19/3 = 6.3; 19*3 =57/Kondratief. 19*9=171.
You inspired me to look this way. I am grateful for that.
André
André,
You’re going to find similarities like that with the 170/2 year cycle. For me, it comes from Wheeler (climate) and you’ll find his drought clock here. Steve Puetz takes it back many centuries and identifies the signposts in his book. My video on that cycle pegs it at 2007/1835/1663 – all tops in the economy leading to depressions, cold and dry climate, and pandemics, among other things. Dewey found over 3,000 cycles, but there seem to be major ones that tend towards being harmonic.
However, I see a big influence through Fibonacci and phi, so I’m not totally sold on the pure harmonics. For example, the planets are separated by the Fibonacci number sequence, which runs through virtually all nature, the markets, culture, music etc. However, there’s a missing planet in that sequence, so I tend to think that it throws a bit of randomness into the entire exercise. It’s not a perfect science, or mathematical relationship, as far as I’ve been able to make out. But the influence is difficult to dispute.
Peter,
There are many techniques that work, most of the time. That’s why I like combining different techniques and looking for confirmation. Sun/moon gravity is one of them. The distance between earth and moon varies over time. In general, when the moon comes closer markets go down as humans get depressed by more gravity. The multi year cycle in this distance turned up in 2009 into the end of 2014. An inversion in this cycle started in December and ends in June, between 10 (perigee) and 22 (apogee). Midpoint being 16.
This is confirmed by the lunar standstill data that gave the low on october 13 last year (2 days off) and June 16.
This same date coincides with a remarkable moon phase synchronization. This is not about distance but the sun-moon angle and a critical solar degree.
It also coincides with the super new moon season (when the new moon date is within 1 day of perigee). This started in January and ended in April
So gravity gave a very clear uptrend since 2009 and created an inversion to get exactly at June 16 – where my 19 year cycle ends. I like to think there is only one reality at any moment, but different ways to look at it. In an ideal world everything should synchronize. 😉
Nice work
I see a break down till June 24-july 1
And after that a big bounce in July early august and afterwards down again till okt 10.
What’s yor view on that?
I follow the work of Stan Harley..
Thanks for your insights..
John,
Thanks for your post!
I didn’t know about Stan Harley, but thanks for the head’s up. I see he’s heavily into cycles, as well. We’re on the same page in terms of the projection going forward. As the planetary cycle shows, we’re expecting a wave down until early July (in two waves, 3 and 5 – with 4 as a 38% bounce in the middle). It should take the DOW down to $16K by then, I think. Regular cycles analysis, which I didn’t post here, says the same thing.
I also think the August bounce will be a big one lasting at least a month. The next set of waves down in the fall will be dramatic so I would push those dates back a bit, although it’s a little early to be running cycles analysis that far ahead (for me).
Thanks again for your view
Will see time will tell
I m from Holland and trading on the AEX and DAX we have a lot of big moves intraday
so tomorrow i would not be surprissed we will go up again into the tuesday new moon
After that is big bear time..
I will keep on following your work..
One more thing
You expect the dow to reach 16.000 by early July?
So what will happen afterwards I mean the period beginning july september that’s two months ?
Regards
John.
John,
Not quite. Trend waves come down in 5 waves. If I’m right, we’ve done 1 and 2. The third wave down will be at least 1.6 times the length of the first and that measures out to a little above $17K on the DOW. Then there’ll be a fourth wave bounce and then a fifth wave down, which should be the same length down again at least. This set of waves altogether will usually get to the previous 4th wave before a big bounce into a larger degree second wave. The previous 4th wave is at a little below $16K. We show this set of waves down lasting through the first part of August, perhaps even the middle.
I note that the Grexit is also coming to a head in the next few days and if anything, this will exacerbate the bearish situation.
Thanks, John. Good luck!
Thank you verry much for your insights..
Peter,
I don’t think we will bounce back up again I we will go down like an elevator till 24-25 June
This weekend the moonwobble has started so there will be downside risk till the beginning of July (Near full moon)
2014 examples..
https://astrologyforganntraders.wordpress.com/2014/04/17/moon-wobbles-2014/
Goodluck..
John.
This morning, it looks like you’re right! Thank you!
Thank you Peter.As the English would say “Well put” You did call the May 20 th top as you said , You told me before hand, and i watched it happen. Happy to be in on your
call , Lets get this done….Nick…..
Nick,
Thanks. The next few days may be pivotal. If we head down past the present low, it would be a huge plug for the bearish case. I’d like to see a full third wave down to about $17K and then a drop just below that number to really confirm the downturn.
Peter,
I like the 19 year lunar cycle. 9 of these give 171 years, close to your 172 year cycle. My own analysis is that we are now ending a 19 year cycle. Assuming this is also the 171/172 year cycle ending, the midpoint of this cycle started world war 2. Any thoughts?
Love your analysis, André
André,
You would like Steve Puetz’s first book, “The Unified Cycle Theory,” for the harmonics and dates he suggests (it’s in the list of books on my site). He suggests the 172 year cycle top at 2007 (all the lower cycles would also have turned at this date). Where we are now would add a cycle of 7 years to that major turn. However, the data on the 19 year cycle seems to point to 2018 as the low. I’ve got a video I hope to get shot today (and posted this week) that shows the data from Dewey until now on that cycle. We’re topping now, if that’s what you mean, but it’s not the middle of the cycle.
There are separate cycles for war. Both Wheeler (in his ground-breaking book) and Dewey had studies on war cycles. The bigger picture that Wheeler (climate) suggests is that we’ll have civil wars, depression, and chaos during the cold/dry period we’re into now and in about 20 years when it turns hot and dry, we stand the chance of another international war. You can look to the events of the 30s to get a picture of how this might play out. While it was hot and dry, we’re in a cold/dry phase and so they aren’t exactly the same. (more video on that to come).
Thanks.