
Today, I want to give as complete a picture as I can as to where I believe we’re headed, short term through long term.
Friday we climbed a bit more above my 62% target at 2106 in the SP500, but we’re still in what appears to be a countertrend move (a second wave). That’s typical for a second wave, as part of the higher degree first wave sequence. That’s because this is still a very bullish market and it takes time to change the herd’s thinking. Let’s review the short-term projection and then I’ll zoom out and look at the future.
Let’s look at where we ended up Friday:
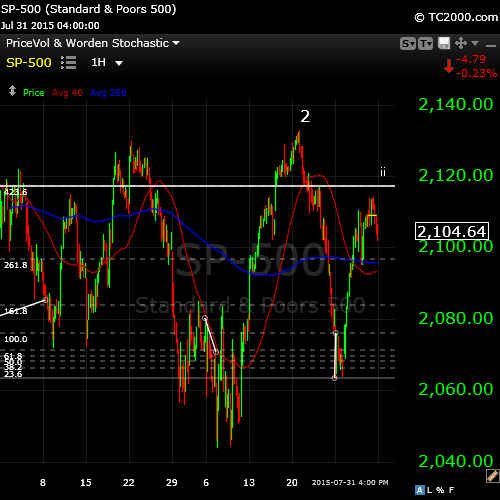
The SP500 has crept up past the 62% typical second wave topping point, but not by all that much. There are a few options here. At the end of the day Friday, it came down in 3 waves, so either it continues down to complete 5, or more likely, it heads back up to do a double top or slightly exceed that point to my measured objective at about 2117 (the horizontal line). This point is a fibonacci extension of the first wave up. It would also make this projected fifth wave of this countertrend move 1.618 times the length of the first wave up.
We could also revert back to the previous wave 2 point to complete a double pronged wave 2, but I think that less likely. Could it go back to a new high? It could, but the next charts speaks to why I’m fairly sure it won’t.
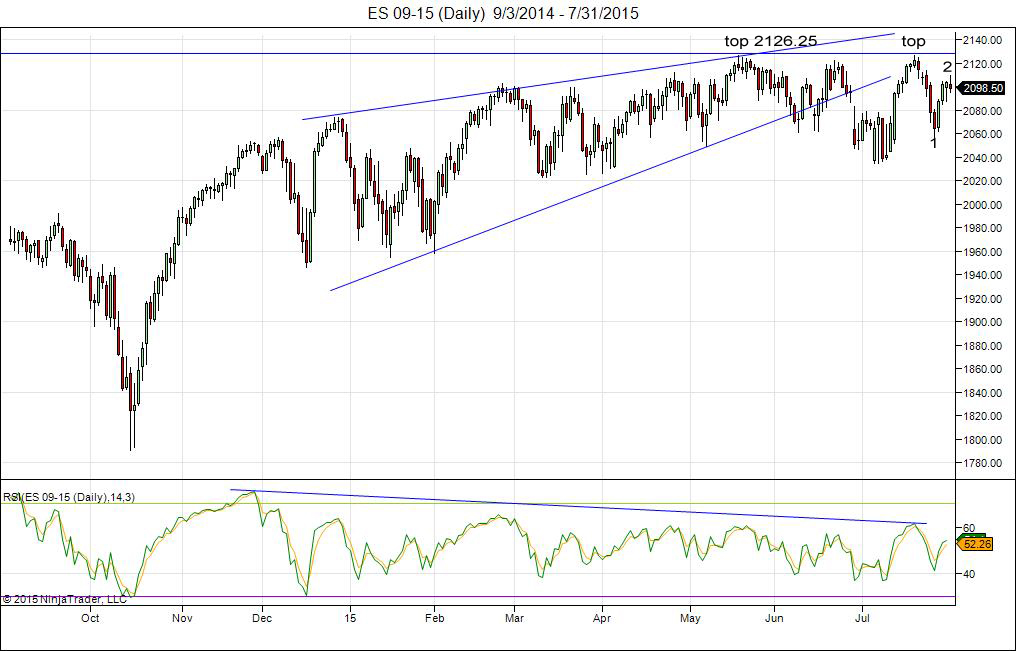
The chart above is a daily chart of the e-mini futures (ES) which move in line with the SP500. It’s done a double top (marked), both points hitting 2126.25 exactly and turning down. It’s also done a very obvious motive first wave down. That puts us very clearly at the top of wave two. You can also see the large, perfectly formed, textbook ending diagonal, which ends in the double top. Those are lots of Elliott wave signals that we’re heading down.
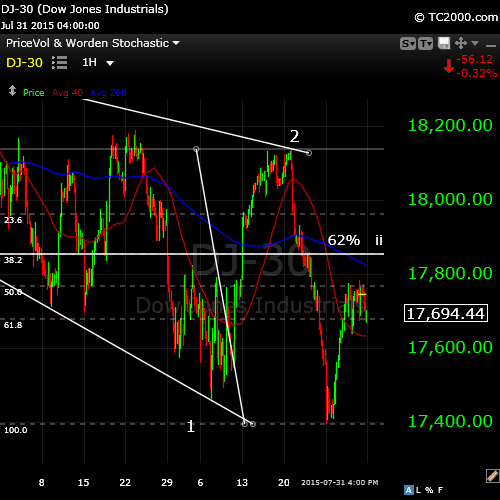
Here’s the index that’s bothering me from Friday—the DOW. I always look for an inconsistency between the major US indices and here it is. This is one more reason why I believe we need to go up to test the high from Friday before heading down. All the indices have reached a 62% retrace (typical for a second wave) except for the DOW. It’s lagging, but in my experience, they all have to achieve that same 62% retrace level. For this reason, I’m expecting the market to rise to the point where the DOW makes it’s target. Then we turn and head down and complete my projection at the top of the page.
So, the DOW is my canary in the coal mine right now. When it hits the 62% mark, I’d bet everything else turns down.
What cycles analysis tells me:
The following two charts of SPY (SP500) are the result of an analysis using TechSignal 10 from the Foundation for the Study of Cycles. It’s the most sophisticated software I know of for analyzing a market asset over time and determining the most lucrative cycles.
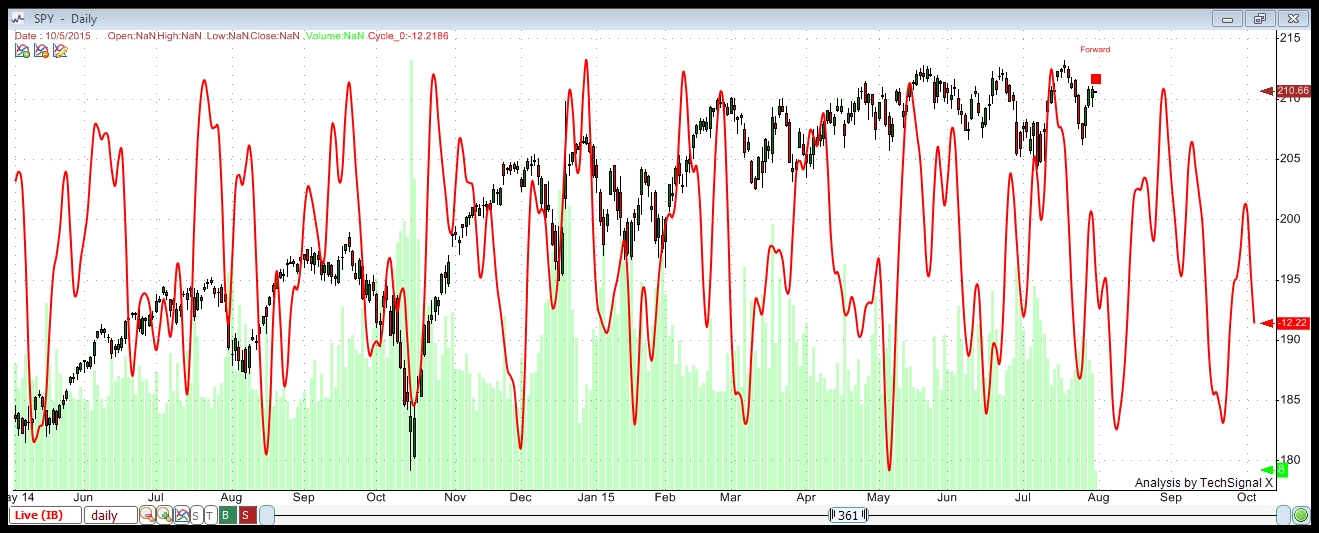
This first cycle chart above uses 13 years of data (from 2002). The software finds all the cycles that have resulted in the highest profit (trading highs and lows) over that period. It also runs a Pearson test, which allows you to discard any cycles that do not positively track the asset. This is a synthesis of the top 6 cycles.
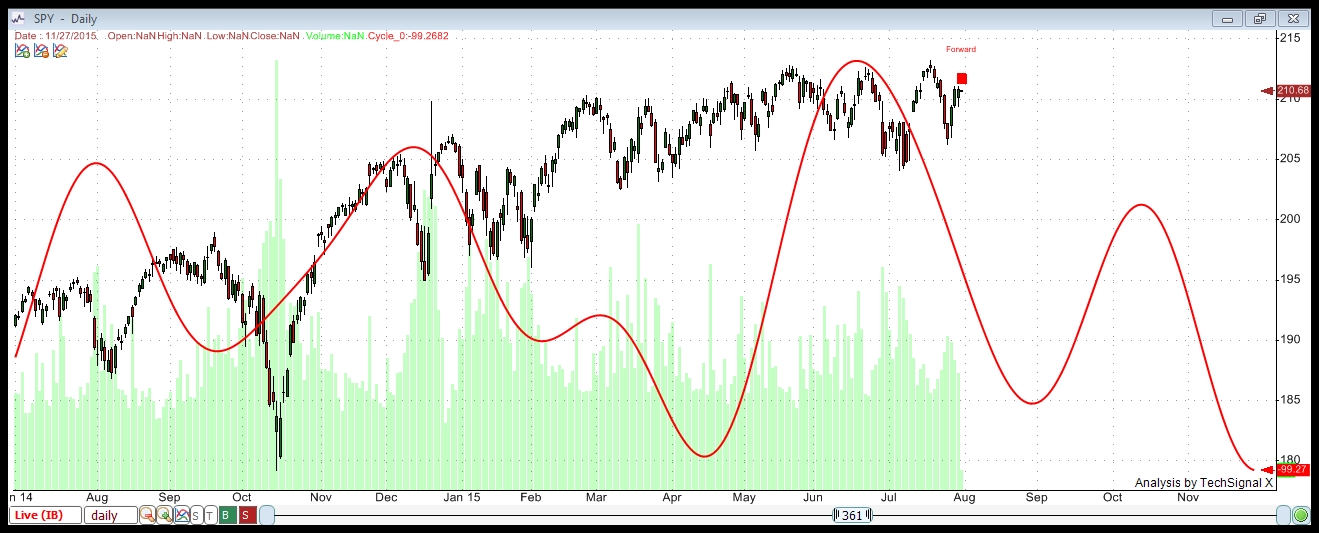
The charts above uses the same parameters as the previous cycles analysis. However, this analysis tracks the highest number of profitable trades over the same period. They provide slightly different views (one shorter term cycles as opposed to longer term). Both charts point to us being in a negative cycle through about mid August.
Gold – Ending Diagonal
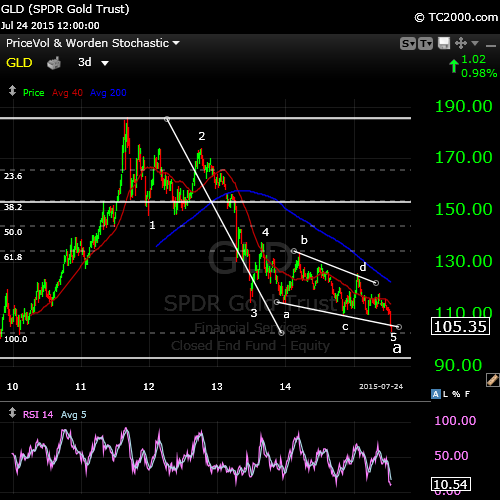
One more argument for a change in trend for the US markets is GLS’s position (above) at the end of an ending diagonal. This would end the A wave, setting up for a B wave bounce.
The Road Ahead
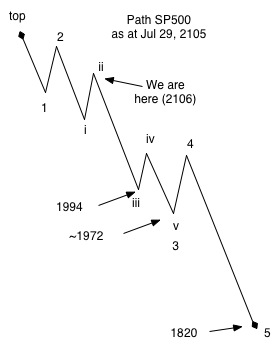
Here’s the path for the next few weeks. This may change slightly (in terms of the projected SP500 price levels), but I’ll update those as we go.
Wave 1 and wave i are typically the same length. Wave three of three (the one we’re entering now, is typically 1.618 times the length of wave i (or 1 in this case). There will be a small wave v at the tail end of this full third wave. Next, we’ll bounce about 38% in wave 4, which should bring us about even with the previous 4th wave (iv on the chart). The final wave down (wave 5) should also be 1.618 times the length of wave i (or 1 in this case).
Wave 3 and 5 could extend, but these extensions will likely be a multiple of phi (2.618, for example).
The entire sequence should end up at about the previous fourth wave of the final wave up (bottomed in mid October last year), which is about 1820 in the SP500. Following that, a large bounce should take us into the September/October timeframe.
History Rhymes. Looking at the wave pattern from 1929.
“Yikes!” is right! But this is a typical crash at the end of a five wave cycle. Actually, we’re at the end of a 300 year (approx.) Supercycle Elliott Wave pattern. It’s the largest market bubble in history, so you have to expect the largest crash in history. We’re at the very early stages of course, and the next chart provides more of an idea as to how the wave will play out shorter term.
The point here is that the drop happens in two stages. There’s a “crash,” which might in this case last a year or so, and then a very long, somewhat anemic countertrend move, before a longer stair-step over several years to the final low. In Elliott wave rules. the countertrend move usually targets the previous fourth wave of lesser degree (that point was in 1974 when the DOW was under 1,000. Let that sink in for a bit).
The chart above zooms in somewhat so you can see the nearer term configuration. We’re at the very start of the first set of five waves down (into mid August!). We’ll then have a second wave retrace of about 62% or more, before the larger third wave down occurs (September/October?). I would expect the crash to take us to about the 2008 low.


Peter,
Thanks for this great analysis.
Cheers,
André
Thanks Peter,
Very nice charts patience again today is bradley turndate so it’s possible we first start higher and we will see a bigger decline starting from tuesday.
Mc Hugh expects the downward move starting on wednesday.
Good luck to all..
Peter… as usual, really appreciate your well written analysis!
Great analysis Peter! I just hope you and André will be right! 🙂
@André, do you work with the helio or geo view when it comes to astro? Which one is/works best in your opinion?
Greetings,
W
Wouter,
I prefer heliocentric as the sun is the center of our solar system and much of planetary influences work through solar activity. But I think that combining the two is the best solution.
Cheers,
André
We just dropped below the previous 4th wave, so we’re going down …
That should be clear now,the only thing that bothers me is sentiment indicators are extreme negative..
Next bradley hold ore possible change in trend is August 10-11
Hi André!
Helio, that is what I thought! Thanks for confirming. 😉 And combining them is stronger, I get that. 🙂
Greetings,
W
Peter,
Don’t you think mid august is a bit too soon to see 5 waves unfold? Waves usually take 3 or 4 days at least. Wouldn’t a low early September be more likely?
Cheers,
André
That I can’t answer. Elliott wave doesn’t provide a timeframe. It only provides price levels with wave lengths. I now just stay in until we reach the target, no matter how long it takes.
MHO. Be careful with early shorts. European markets are short term bullish and SPX has a very strong short term support 2080/2090. Maybe Peter is right and DOW needs retest 17800-17900 zone before the correction starts?
Peter/Andre are you following european markets like DAX/EUROSTOXX?
Thanks, Ricardo.
I’m not following the other markets. But I would agree with getting short too early. Today’s drop looks like a first wave to me, but some of the indices are not giving a “clean” count. We have to retrace 62% of today’s drop so far at the least (about SP 2103.80), but if we go above that, I’d be cautious. As well as the DOW, IWM (Russell) also did not quite tag the 62% mark. I’m not going to feel comfortable until I see one of those things occur or a strong turn at the the 62% level I just mentioned.
Ricardo,
It looks like european markets are always a bit slow when the US declines after an upmove.
But if the move down continues in the US, europe will accelerate down watch and see it happen.
Ricardo,
The problem is the new moon conjunct venus; that should give some support (a high). Not all markets react the same to natural forces. I think the counts will get a whole lot cleaner after the 14th. The non-farm payroll on Friday also might keep the markets is a waiting mode.
This always happen with major turns; markets need to synchronize. Real strong declines can only happen when markets are in sync.
It’s “be careful out there” time! I do not like the look of this market. It’s starting to look like we’re looking at another wave up. This latest wave is down in three waves so far and it looks like the SP500 is coming down to the 62% mark, which could mean a third wave up.
Thanks Peter, i have been busy, but back now. hello Andre……nick
@Peter/André,
You still stick with the plan? Somehow, we are going up into 7 August and not going down already… 🙁
André, you think we go down now into 14 August (you thought up into 14 August)?
Peter, you still on wave 2?
I stay with the bearish scenario for now, but my shorts are not liking this upward movement in the AEX (like the DAX)…
By the way, I sent valley an e-mail (from SolarCycles.net). So I hope he will join us here. 🙂
@All, somebody knows what is going on? To me it looks like the top is almost in…
Greetings,
W
This bounce should be almost over. In the SP500, the wave down came down in 3, so it has to retrace and do a double top. I’m expecting it to hit 2113.13 and then turn down. We’ll see what happens. We appear to be in the final wave.
Inversion?
Looking at the bradley it’s possible this cycle makes an inversion and we go up or sideways
till August 17/18…
Hey John!
Yeah the July 29/30 Bradley didn’t work… Perhaps the 3 Augusts Bradley will still work? 7 August I am aiming at and also, 8 August is a mid-seasonal Gann date.
Cheers,
W
Listen to John. I’m going to write a paragraph tonight about why nobody should be in this market …lol. It’s a top, there’s no volume, major indices are not synchronized … it’s summer. Plus, at this point, the waves aren’t long enough to do any real damage. In Elliott Wave, the trend is not set until we have a full set of 5 waves down. So it’s very early times. Don’t overtrade.
@Peter, can wave 2 be a double top with the beginning of wave 1? Because this is almost happening in the AEX (Dutch) Index.
Cheers,
W
I’m just looking at the AEX now (the daily). It’s in a final fifth wave. I would expect to see a double top before it’s done. I think that’s your question. It looks like it will just test the high.
Be careful out there. I don’t like the look of what’s happening. I think we’re going up. I’ll do a closer look tonight, but so far, it’s not looking very bearish.
Oke my here is my prediction,
I think the bradley made an inversion so up till August17/18 down till August 27
Up till Sept 4 Top after that sideways.. till Sept 13…. after that a big short till Okt 7..
Sentiment is much to bearish it first has to change …
A 10% out-of-the-money three-months SPX call option short buys a 35% three-month out-of-the-money SPX put option long
This first has to change In 1929 we also had a sideways market afterthat the last run up till Sept 4….
Sept 4/2015 is a possible Mercury turndate..
http://www.acting-man.com/blog/media/2011/10/929-crash.gif
I hope to see your analysis and a response by André soon since I have got no clue anymore…
Greetings,
W
Wouter,
Watch out don’t get snowblind for the stockmarket take a time out go to the beach.
Stay relaxed, the bears will soon be celebrating. 2028 sp futures min by Aug 12th. If I am wrong, I will not leave another comment. All the best to you.
Wouter,
See road-map previous post; nothing changed.
Cheers,
André
New post https://worldcyclesinstitute.com/no-country-for-old-men/
I had a strong Gann ‘S&P-indicator’ today. Still believe the 8/3 high was strategic and the market needed to test the indicator. Short term inversions don’t change the longer term trends. See no reasons at this moment to change my forecast.
I concur. All the waves so far are in 3’s. We’re simply wandering around in a second wave. We still need to test the top of it, before we head down.
Thanks guys! It is just annoying when it is going so much the wrong way and it looks like I am totally in the wrong direction…
Greetings,
W
Oké André/Peter, so we are still on track to see wave 3 down? Especially because André said the down waves will be bigger than the up waves?
@John, what you are saying is 100% different from André/Peter. I thought you were short to, how come you turned this fast without seeing the previous top being broken?
I like to hear from you guys. Have a good evening!
Greetings,
W
From an Elliott Wave perspective, we are still in wave 2. Nothing has changed. This wave we’re in is very clearly 3 waves up. As such, it can’t go to a new high. The Nasdaq could test the high, but I doubt it. I think it’s creating a second wave so it will be in sync with everything else.
My measurements of the SP500 waves suggest it’s going to test 2113-2115 or thereabouts. Again its a wave in three waves, so it will retrace down completely. We wait.
Timing is suggesting a Friday morning labour report event.
New post https://worldcyclesinstitute.com/no-country-for-old-men/