Update Friday Before the Market Opens: Based on what the futures did last night, we saw the top yesterday. We simply have to test the top this morning and then we’ll turn down into wave 5.
Clarity has finally returned to the wave count.
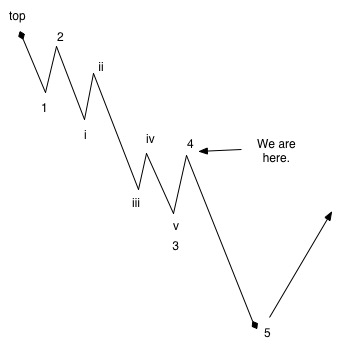 Over the past few sessions, it has been a difficult market to decipher. That’s because the third wave came down so quickly that the subwaves are really not clear. With today’s session, however, we got some clarity. We’re in the higher degree fourth wave, having completed the full third wave.
I’ve updated our position (on the chart on the left) at the top of the fourth wave (at least by tomorrow we should be there), with a final fifth wave down to go.
The fifth wave down will be a big drop and it will unwind in five waves (the sub waves don’t appear on the chart). I’m going to refrain from giving targets for the drop, as the third wave was so long and didn’t really conform to the typical wave 3 length. Wave 5 is often as long as wave 3 and can be longer. I’ll try to alert you as to likely targets once we’ve seen a fair amount of the wave unfold.
During today’s session, what looked first to be a first wave down followed by a second wave morphed into a triangle, and finally, towards the latter part of the day, morphed again into what will most likely be either a flat or, as I look tonight, just a double zigzag ending in an ABC wave up. A flat is a 3-3-5 wave configuration: Three waves up, three waves down, and then 5 waves up to finish.
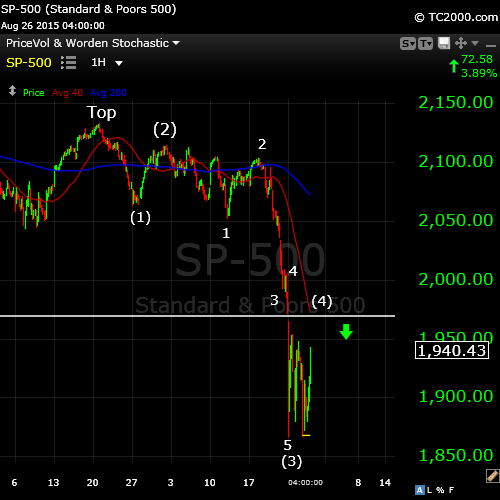
We’ll start with the SP500 (above). On all the index charts, I’ve drawn a horizontal line at the 38% retracement level, which is the minimum level for a fourth wave to retrace. The line in the SP500 falls right in the middle of a gap, so I would expect the gap to get filled. My target for the flat then in the SP500 is about $1972. Somewhere around that level, the market should roll-over and head to new lows.
If you’re following SPY, and appropriate target for the retrace is about $197.50.
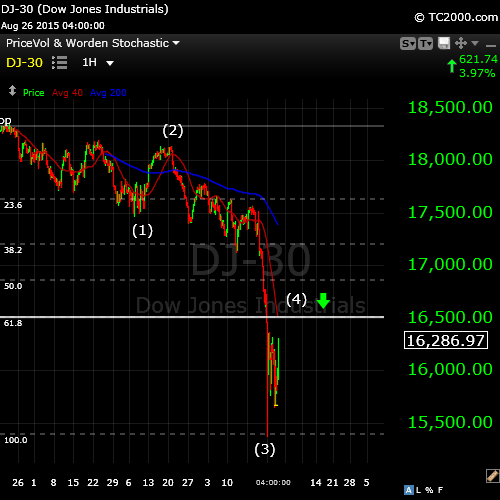
Next the DOW (above). It has a very similar look to the SP500. The target level for the retrace here is about $16,500, which is the 38% retrace level.
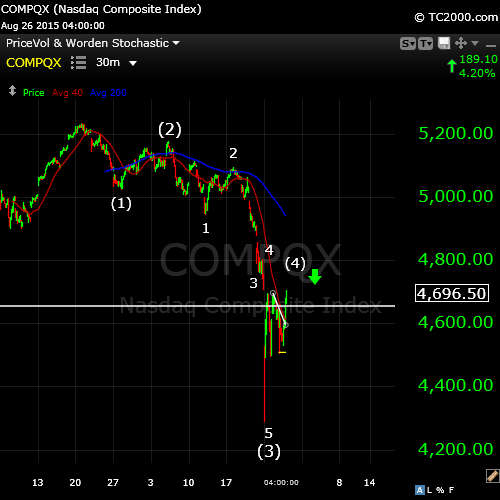
Here’s the Nasdaq (above). It has a similar look to the other indices. The Nasdaq has already retraced past the 38% level. Its target might be the previous fourth wave at $4808. It doesn’t have to reach that point, however, and will roll over when the other indices do so.
Cycles Analysis: Looking Ahead.
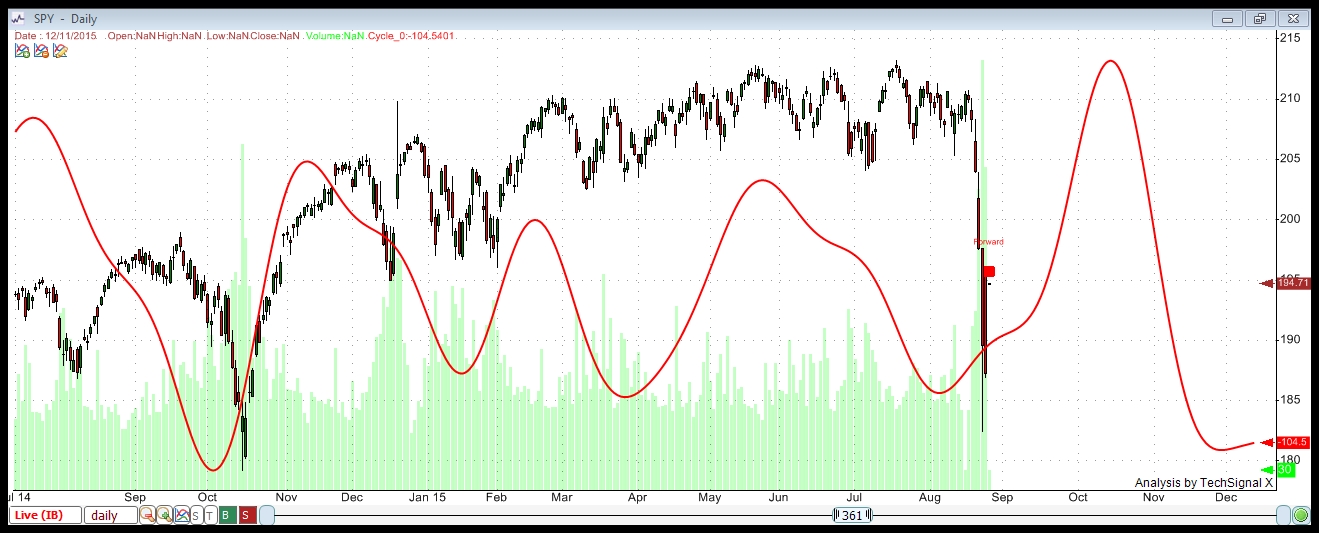
I’ve run a cycle analysis on the SPY (SP500) tonight. The important thing to note here is that the negative cycle period is coming to an end. Once this fifth wave finishes, we’ll be into a very supportive period through to October. After we complete 5 waves down, we will go into a second wave retrace. The second wave will retrace at least 62% of the entire drop. However, it cannot go to a new high.
Once the second wave finishes, likely sometime in October, we roll-over once again and head down in a new set of 5 waves very much longer than the set we’re in the midst of completing.
Sun-Jupiter Cycle (from Time-Price Research)
![150826 SUN-JUP Cycle [04]](https://worldcyclesinstitute.com/wp-content/uploads/2015/08/150826-SUN-JUP-Cycle-04.png)
I found the above chart very compelling. This chart shows September 4 as the possible bottom of the next wave down, which seems to work with our Elliott Wave prognosis. Wave 5 will be dramatic and may take the DOW down another two thousand points. I would suspect the wave will take about a week, which would be similar to the third wave.


Thanks, Peter,
nice chart. I hope the markets will follow it.
By chance, do I understand right that the target for the fourth wave is 1974 for S&P and 16500 for DJ (in your text 1714 and 15.500)?
Sorry, Dimitri,
I was really tired when I did that. I corrected the page … thanks for being so subtle … haha. 1972 and 16,500.00
Thank you for a great update Peter. Do you see 1975 as a resistance for wave 4 still? The sentiment now is quite bullish after the close as strong as it was today, so my two cents is that the market might chop for a few days before a big whooosh..,,,
Andre is spot on with his big 08/26 turn date call. I have 09/04 as Andre’s lower low prediction, which seems aligning with your count, assuming that the market chops back and forth until early next week…
Erick,
Fixed it. Thanks for flagging it. I was really tired when I did that (I went and had a sleep). 1972 and 16,500.00.
Some clarity would be a good thing …
Lots of work that you put in Peter. Much appreciated it as it helps me a great deal.
A cool wave measuring lesson for all my friends who frequent my blog: https://worldcyclesinstitute.com/wave-measuring/
Hope this helps.
Your wave measuring stuff is great Peter. Thank you!
Looks like wave 4 is commencing? SPX 1968 was filled, and the bounce already reached the 1975 target. I am out of my long positions and get ready to short.
Not sure about that. It certainly could be. If we’re going to the previous wave 4 targets, this may just be a subdivision in wave 5. In that case, we have a little ways to go yet. A double top will eventually give it away. This is the difficulty with countertrend moves. They’re not as accurate as waves in a trend, which is down at the moment.
🙂 Thanks!
I think I understand it. When we combine gravity with Gann we get more insight.
I see a Gann cycle from 8/23 into 8/27-28. But gravity gave a low on Wednesday, together with a solunar CIT. The market feels both forces. So the week cycle (Gann) is up, but gravity was down into Wednesday. This gave the jerky behavior. Gravity and Gann point towards this weekend.
This weekend I’ll post a new roadmap, integrating Gann and Gravity.
Cheers,
André
Hello Peter
Is it possible for wave 4 to reach the gap @ 2035 ?
Regards
AZ
Anything is possible, AZ. Probable? No.
I am watching the 62% retracement level on the NQ at about 4321. We’re ten bucks away. That would seem a likely stopping point. We’re in the final fifth of fifth wave. Shouldn’t be long. There are no rules here other than the fourth wave can’t go into the area of the first wave.
Ref cool wave measuring. The crashes of 29, 87, and 08 did not have more than three days sideways to up. That is what I was expecting, oh well. So I took the length of A up on Tuesday, 944 and added to the low and got 16,595. 1.6 would be 17,161.
Kent,
It’s interesting to note that on the DOW and SP (didn’t check the others), wave three extended to 2.6 times wave 1 exactly. Once we’re done, I’ll add this example to my wave measuring post. Now we’re working on wave 5, and it looks like we’re about to start on wave 5 of it. I don’t think it will make it to 1.6 times wave 1, but it could.
The previous wave 4 for the DOW is at 16,776, which is the other typical ending point for a wave 4 retrace and it would actually be around the point where wave 5 is 1.6 times wave 1. We’ll see.
The previous 4th on the SP500 is at about 2009, which also gives a length of wave 5 at 1.6 times wave 1. It’s starting to look like we’re going there for both, which may mean a top tomorrow.
The DOW racking up 500 points today would certainly lead to the euphoria typical just before a deep dive ….
Thanks Peter,
The jupiter /sun update also matches the next Mercury max elongation east on Sept 4
So I was wondering could this be a top or bottom time will tell.
Thanks
Everything else is pointing to a bottom.
imho now might a good time to be sidelines, waiting for wave 4 to commence. i am back in cash and waiting 🙂
I think you mean wave 5, but yes. I’ve been waiting for the turn, but I’m not day trading.
I now put the turn at tomorrow morning. We just did a fourth wave down (of the fifth of the C wave). We likely won’t top today. We have the fifth of the fifth to go and this would put us at the previous 4th wave.
With the fourth wave in, I put the target for the SP500 at 2007. That’s a match to the previous fourth wave.
Ref measuring. I tried a = c and came up with 16,595 for Dow. The previous crashes like 29, 87, and 08 did not go more than 3 days sideway or up before a new downleg started. That is what I thought would happen here, oh well. This is the 4th day counting the low day.
Oops double posted, sorry.
I just looked at the Shanghai index after the first wave down 5160- 4260 there was a recovery… that took 5 days after that it plunged in an other destructive wave near 3900.. in 5/6 days
I m looking at the AEX top 513 first wave down to 402 at the moment we are at 445 so we are close if I compare this with the Shanghai the next wave down should be arround 360-380.. by Sept 4.. at that time the papers will scream save us fed QE 4…please
And Super Mario has to take it’s superman suit out of the closed..
http://www.infouil.it/2013/01/28/super-mario-e-la-guerra-degli-eroi/
John,
The 5th wave is generally the same length as the first three, so for example, you can pretty much count on about 2000 points down in the DOW. But I’ll come up withe some targets once I see the turn.
I just read Mister MC Hugh saw the top at 1990 this evening and now straight down..
maybe 1820… in 3 days..
This is interesting analysis that has provoked yesterday’s 2% dip
http://www.zerohedge.com/news/2015-08-27/jpm-head-quant-warns-second-market-crash-may-be-imminent-violent-selling-could-retur
Today mercury shadow date. Tomorrow solar cit. This afternoon very likely the high. Gann cluster gave 8/27-28.
Based upon what the futures did overnight, we saw the top at the end of the day yesterday. We’ll head down this morning.
And btw, André, GOOD CALL. We have both sides matching now. We’ll see how the next couple of months goes regarding timing. I’ll post tonight and set some likely targets.
Looking forward what your downside target will be for the Dow and S&P Peter?
Cheers
A long way down to go … haha. DOW about 2K would be my initial guess.
For this wave ?
Another upside target maximum is sp 2014 I just read
We’re in the area of the previous 4th wave, so it will end very soon. Wave 5 down will be a 2K or so wave for the DOW.
John, if we’re going to finish a full 5th wave up here (1.618 times the first wave – the A wave), then it will go to 2023, but I don’t think that will happen. I think we’re finishing up now, but we’ll see.
Peter, do you think Fed will still mess up by printing money, or at sometime they will become irrelevant
Rose,
I think it’s already irrelevant. Once wave 5 hits bottom (likely the end of the first week of September), we then need to bounce in a larger degree second wave. The Fed could announce something then, but the point is that we’re going to have the bounce anyway. The event follows the market, not the other way around.
I have a video to finish and post this weekend on deflation, which is where we’re going. Money is tightening up.
Good real time calls Peter. I am positioning for the commence of wave 5 as well. I fully expect the sell-off resuming next week. 2000 points down for the Dow sounds very reasonable.
The market’s being obstinate! (One of my father’s favorite words) I thought we’d roll over today, but we’re really struggling to test the top, so maybe it won’t happen until Monday. Jury’s out on that one at the moment …
funny typical dutch word we say obstinaat
He was English. You don’t hear it much on the North American continent.
We might have had the turn already… I could be seeing a first wave down and a second wave up at very small degree.
I’m right down to the one minute chart …
Markets look super weak today. They still call roll over today before the close Peter 🙂
As I commented to John, we may have already seen the turn. I drilled down to the 1 minute chart.
I’m more inclined to think we need to see a clean double top.
Just flat what I had expected
Monday I think they wil try to move the market higher again I think..
We’ve completed 5 waves up in the flat, so the upside should be extremely limited.
That was one of the most frustrating days I’ve spent in the market. We went sideways all day long and I have no clue as to what it needs to do to keel over. I may get more of a clue from the futures and currencies on Sunday. I will post this weekend with suggested long term targets … however, I can’t add much as to when or how we’re going to turn over. We either have to do a double top, or we’ll have one small wave up on Monday morning.
I still look at the correlation AEX versus Shanghai and it’s still inline .
After the first wave down Shanghai recoverd for 5 days and the last day was a verry small green candle ,the day after it broke apart for 5 days straight down.
http://nl.investing.com/indices/netherlands-25-chart
http://nl.investing.com/indices/shanghai-composite-chart
Peter: Es mini commercial trader short big time
260,000 contracts
http://snalaska.com/cot/current/charts/ES.png
but sPX commericals long big time, what to make of it
58,000 contracts
http://snalaska.com/cot/current/charts/SP.png
Iwm stayed positive the whole day,
I am fully short, expecting a down week. The VIX hasn’t stopped spiking and has been a decent indicator of the market weakness since 08/19. Look forward to Peter and Andre’s analysis over the weekend. Tremendous work and great calls by both!
9/10 we have a natal heliocentric Venus conjunction. This is a magnet. The super full moon 8/30 will give an inversion (high). Strongest turndates 9/1, 9/4 and 9/9.
We are still down from 8/18. So I expect a low on Tuesday, then a retrace up into Friday (jobreport) and down again into 9/9. After that a longer retrace into autumn equinox.
Intermezzo.
Armstrong uses PI for timing. Euler’s identity says that PI and e (mathematical constant) are related. Nobody uses e, but I do.
From 18/8 we do 8 e into 9/9. 8 is a cardinal number in the square of nine and thus a natural number. It’s also fibo.
Don’t you believe me? From 19/9/2014 high to 21/5 high was 77,6 PI (ugly!) and 90 e (nice!). Combined with square of nine this gives us cardinal e-timing. Bet you never heard of that. 😉
9/10 is also 90 degrees in my Galactic Year and 120 degrees in my Natal Year, but only when we accept that a year has 346,36 days and not those absurd 365 days.
Cheers,
André
Really good, André,
I’ll have to get into this in more detail when I prepare a post later today. I can provide the path. Getting some fairly precise timing, too, is exciting.
Thanks Andre,
Much appreciated so 9/9 could be a major low and after that up into the autumn equinox
( arround Sept 23)..
I think we conna see a lot of complex bottoming ..
Cheers.
John,
I agree. And it will last until 9/9.
I believe we will have of a pivot high 9/9 instead of a low. From 9/9 down into the autumn equinox. This week, I see us going down to probe the lower supports levels already visited from last week. But than again, what do I. Good luck every one. know.
Gann cycles give 8/28-30 as the most significant dates after 8/22-23. Looks to me the market wanted to test this date. So now it’s time to blow off some steam. A low 9/1 would make sense. We need an inversion to change this and I can’t see where that would be coming from. But I know as much as you, so we’ll see what happens. Giving arguments – even if they prove to be wrong – feeds the learning process.
Thanks Andre” Best of Luck to you.
Peter,
Thanks for the excellent chart reference from TPR on Jupiter cycle. I printed it and will add it to my reference book. I think that based upon all of my indicators, that either we get the typical pattern of market seasonals from here into the new year OR and this matches your posts that we get a HUGE sell off THIS WEEK! I am long into Monday’s open and plan to move to cash at open. Venus inferior conjunction is usually most volatile time of its 16 month cycle and is occured on 8/15. Usually months following VIC are bullish so a steep sell off next week would set the stage for a substantial rally into the fall. Btw, PALS is mostly negative this entire week and mostly positive following week so I would expect any massive sell offs to happen by this Friday.
Valley,
Do you think we see a lower low by the and off the week SP 1776?
Cheers
Thanks, Valley,
We’re on the same page. New post live.
The Puzzle,
After the big drop I see a lot of zig-zag moves very difficult to play and you can lose money quickly
But here is my road map..
If the bumpy ride of 2011 can be a guide, I think we are now near a top maybe a little up monday and we can fall down again 50% let’s say 50-60 points near friday That would fit the analogy 2011 see the chart below ( 6 days up after the first blackswan), but after that we will go up and maybe make a new high near August 18 (end of wave 4) and after that we will go down till Oktober 7-9 (with a slight pup up end of september) that would mean the end of wave 5 .
The bradley has a high score from July 21 till now and shows a a flat line till middle of the month wich I interpret as volitale moves.
The bradley,Mercury and Jupiter are showing turning points Sept 4…
We have a new Mercury cit at Sept 18 and Sept 30 and Okt 7..SP target arround 1700
Mercury is the butterfly planet in my eyes the little one but clossest to the sun so the energy starts to change from there…..
So happy trading to all:
My motto..
May god bless you all to trade with a good hart so if you win share some profits with the one’s who need some help and are less fortunate in life
Chart crash 2011.
http://jugglingdynamite.com/wp-content/uploads/2011/10/TSX-back-to-50-day-moving-average-oct-24-2011.bmp
LOL. John. You must be reading my e mails. I agree with your road map into Oct 9th. Some how, we MAY see the Dow Jones going to as low as 14,320 into the Oct time frame.
Hi Dave,
I have read your posts on this site and Solar don’t know your emails or other posts?
I had a good position on the aex put options bought at 1,60 and they went sky high above 40.. it’s a pitty I sold friday at the close on 8.
What I learned from this a big decline often is a 3 day sell off.
The bradley was spot on I should have trusted it’s prediction…
Still happy though
Hi John, your 1700 sp seems to co-inside with my 14,320 Dow Jones. We MAY see in the near future. ( BY the middle of Oct ) or sooner. I mentioned in a earlier post a few weeks ago, that the Bears and Bulls will end end up losing money due to the wild swings that Mr Market will display. That is why I use both put options and 3x time ETFs . I again,will start layering the Bear etfs and put options for the next few weeks. (Started EOD Friday) Good luck every one.
A lot of bulls are going to get their ASSES KICKED here shortly. They keep on looking back from last falls sell off, which was a V shape correction. Mr Market is going to give them rude awakening here shortly.
New post up.