
Update: Friday, Feb 24, 9:30 am EST
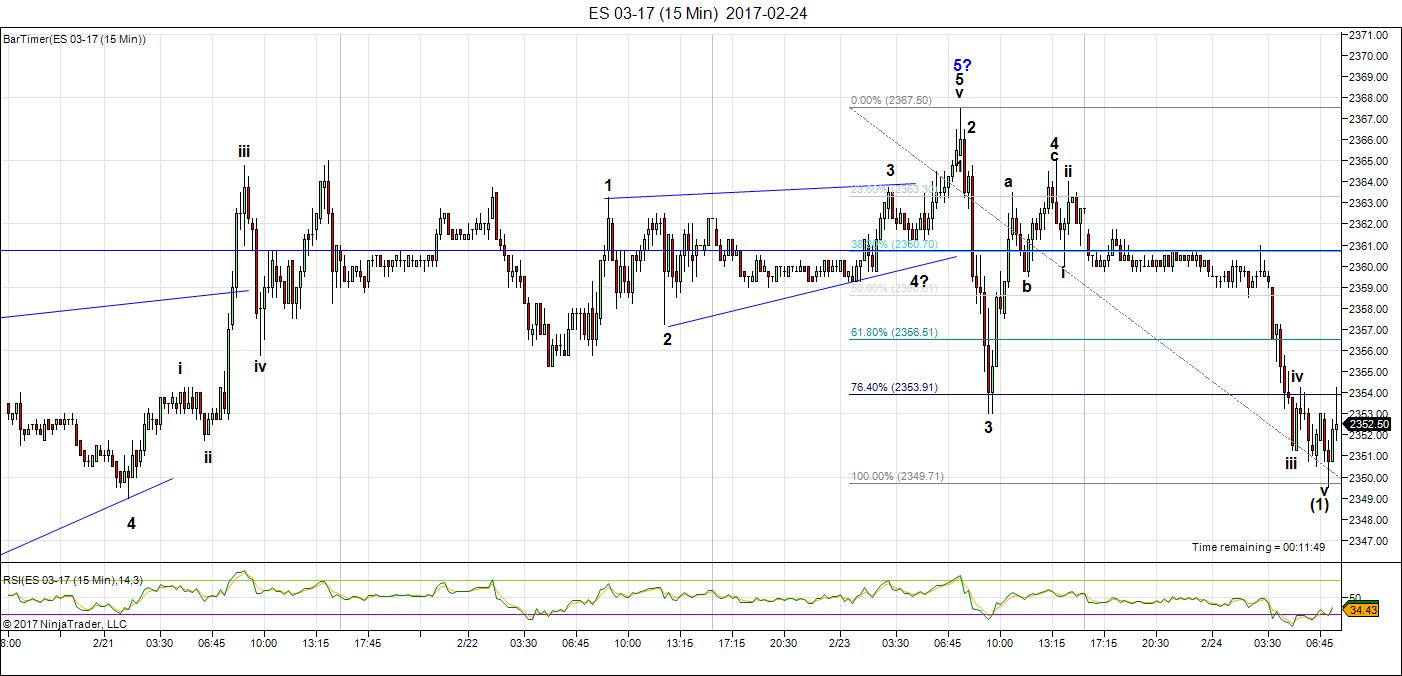
Above is the 15 minute chart of ES. This is an extremely strange configuration for wave 3 down, but I’m trusting it’s all there correctly, based on what NQ has done, (and AUSUSD), which is a bit more normal. Look for a 62% retrace to the 2361 area, which should be ripe for a short.
_____________________
Market Update for Friday, February 24, 2017
Market Update for February 24, 2017  |
 |
Make sure you zoom the video to full size with frame expander (arrows) in the bottom right hand corner and also set the quality to as high as your web connection allows. This is an HD quality video so the best viewing is at that level. |
_______________________________
Market Update for Thursday, February 23, 2017
Chart Show for Thursday signup
Market Update for February 23, 2017  |
|
Make sure you zoom the video to full size with frame expander (arrows) in the bottom right hand corner and also set the quality to as high as your web connection allows. This is an HD quality video so the best viewing is at that level. |
_______________________________
Market Update for Wednesday, February 22, 2017
Chart Show for Thursday signup
Market Update for February 22, 2017  |
|
Make sure you zoom the video to full size with frame expander (arrows) in the bottom right hand corner and also set the quality to as high as your web connection allows. This is an HD quality video so the best viewing is at that level. |
_______________________________
Update: Tuesday, February 21, 10 am EST
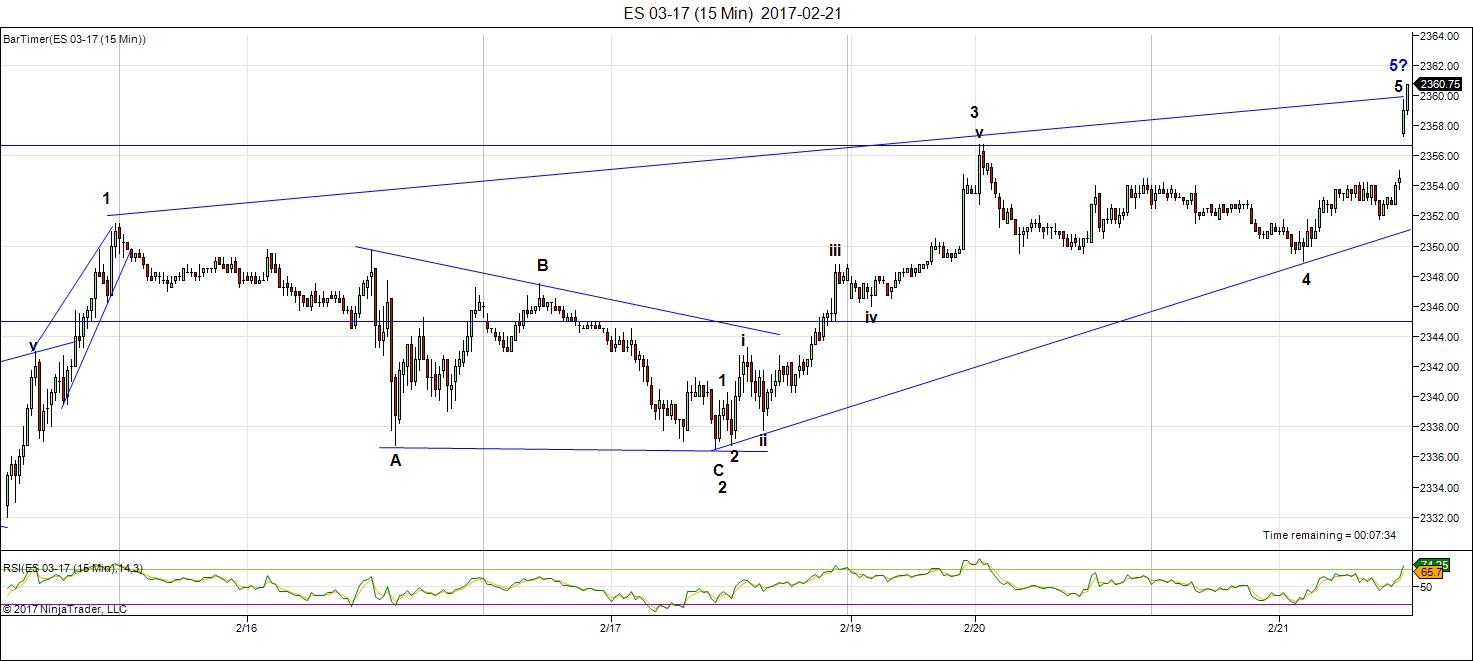
Above is a 15 minute chart of ES showing the ending diagonal. I have a projected top in ES based on the subwaves in the final wave up, but the ending diagonal may extend it a bit, because ending diagonals generally have a throw-over the upper trendline. However, it will have a dramatic turn down and the objective will be 2320, which looks like the start of the first wave of the ending diagonal
_________________________
The big news in the past week was the bullish thrust from a triangle in ES and SPX. It’s almost complete.
This has been another long haul weekend involving a lot of measurements and re-labelling, based upon the move up last week.
It’s now clear to me that we have just a few points (about 5 max) to move above our current high in SPX/ES and this should trigger a turn down into wave 4.
Wave 4 can take any of a number of patterns (triangle, zigzags, flat, combination) and we’ll have to see how the first set of waves shapes up in order to get a target for the bottom.

Above is the daily chart of SP500 shown in the video today. We are virtually done with the 3rd wave up, but may still have a couple of dollars more to go. Wave 3 is longer than wave 1 but not the 1.618 ratio we might expect and so the waves up are starting to compress.
The current state of the USD currency pairs (and the US dollar) are suggesting to me that wave 4 may be relatively short in time and in depth. It may not make it to the 2216 target I show on the screen.
As I explain in today’s video, the ultimate target for the larger wave (5) may be 2500.
I’m still projecting a final top to our five hundred year set of Supercycle waves sometime in the early part of this year. I’ve given up on being specific, as these waves have been moving very slowly. Ultimately, Mr. Elliott’s waves will forecast the end and give us adequate warning of the turn.
______________________________
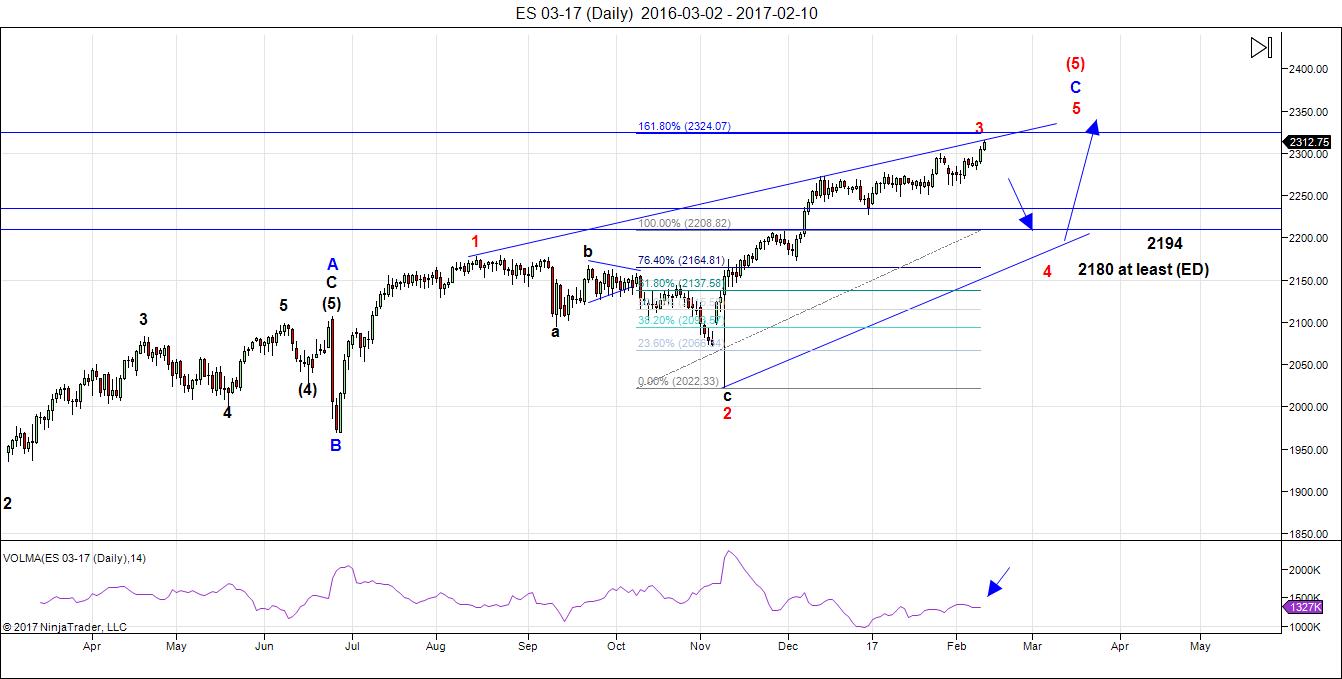
Here’s the latest daily chart of ES (emini futures)

Above is the daily chart of ES. The full wave up looks to be like a triple three (a combination wave) which is near or at completion. I’ve removed the trendlines as I believe the ending diagonal idea is finally dead.
The final pattern of the triple three is now labelled as a very rare running triangle with a final motive wave as the final thrust wave. There is only one wave out of a triangle in the “fourth wave” position and so for several reasons (mentioned in the video) we’re at a top with perhaps a few more points to go. This would be the top of wave red 3. In high degree wave structures, the thrust out of a triangle can be a blow-off wave, and that certainly seems to be what we got.
Note that the volume is extremely low, which is bearish.
A typical wave red 4 retracement would target the 38% level (2205, based on hitting 2352 on the upside). However, based on the fact that this entire structure looks corrective, wave four may be much smaller than average.
There’s also the consideration of the second waves in USD currencies. We’re currently part-way through in all currency pairs, which suggests a short 4th wave in US indices as they’re all more or less running in tandem to a final top.
The 4th wave will come down in three waves. After we finish the A and B waves, we should be able to project an end to the C wave of the 4th wave. Once we finish the fourth wave , we’ll get a final blow-off wave for the month of March, with a potential top that month or into very early April now.
Here are the path predictions going forward:
- Wave 4 will come down in 3 waves with any of the corrective patterns possibly in play.
- Wave 5 is likely to be an ending diagonal. In any event, it will be in 5 waves (not motive).
Summary: We’re at the top of wave 3 of the final 5 wave pattern, ready to turn down into four with one more very small wave up to a new high. There’s a major turn date predicted for Tuesday/Wednesday, February 23/24 with all major assets slated to turn this week. The larger wave (4) should come down in 3 waves.
After completing the fourth wave, we’ll have one more wave to go, which could be an ending diagonal as a fifth wave. The long awaited bear market is getting closer.
_______________________
Here’s the latest HOURLY chart of ES (emini futures):

Above is the 60 minute chart of ES showing our progress to the end of the day on Friday (click to enlarge). We’ve rallied to a new high, but we’re very near the end of larger wave (3).
The final wave up from blue E (last wave of the running triangle) is virtually complete, or will be, after one more small wave down (iv) and a fifth wave up (v). Measurements support a potential move up to 2355.
We have an Andy Pancholi turn date on Tuesday/Wednesdasy, so somewhere in this time frame, look for a turn.
Wave four will need to take at least a couple of weeks, I would think.
_____________________________
Some housekeeping:
Andy Pancholi Turn Dates (February, 2017)
- SP500: Feb. 23-24
- EURUSD: Feb. 24
There is also one more eclipse in February, on the 26th.
New Free Blog Post: Another Win for Usury: The Battle of Waterloo
The Chart Show sign up is live for Thursday, February 23. You can sign up now in the usual spot: Webinars
________________________
Here’s a video overview of the market for Tuesday, February 21, 2017
Note: A little longer today. I spend some time going over the bigger picture on the SP500.
Market Report for February 21 ,2017  |
|
Make sure you zoom the video to full size with frame expander (arrows) in the bottom right hand corner and also set the quality to as high as your web connection allows. This is an HD quality video so the best viewing is at that level. |
_______________________________
The Charts Going into Tuesday
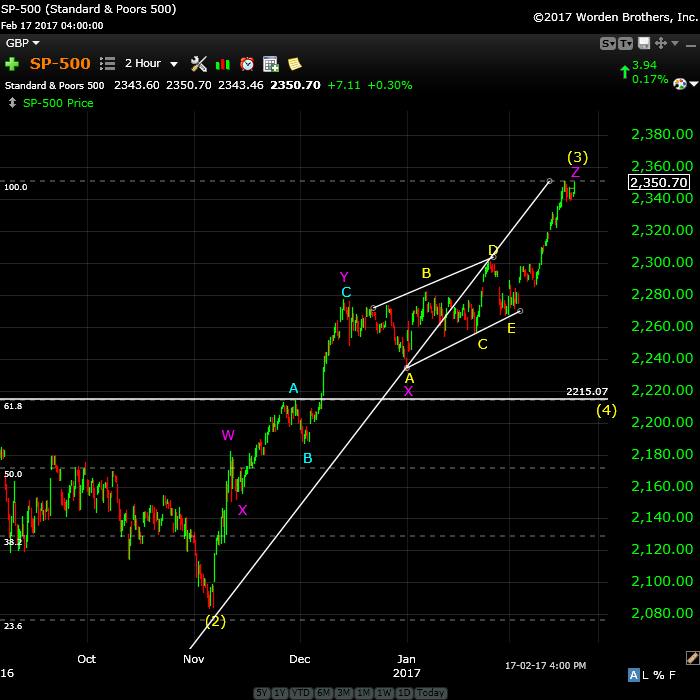
Above is the 2 hour chart of SP500 re-labelled to show the three sets of pattern in wave 3 (a triple three), which is a combination wave. The final pattern has been labelled as a rare running triangle.
I expect another small 5th of a 5th wave up to a slight new high to finish the third wave.
There’s an Andy Pancholi major turn date of Feb 23/24.
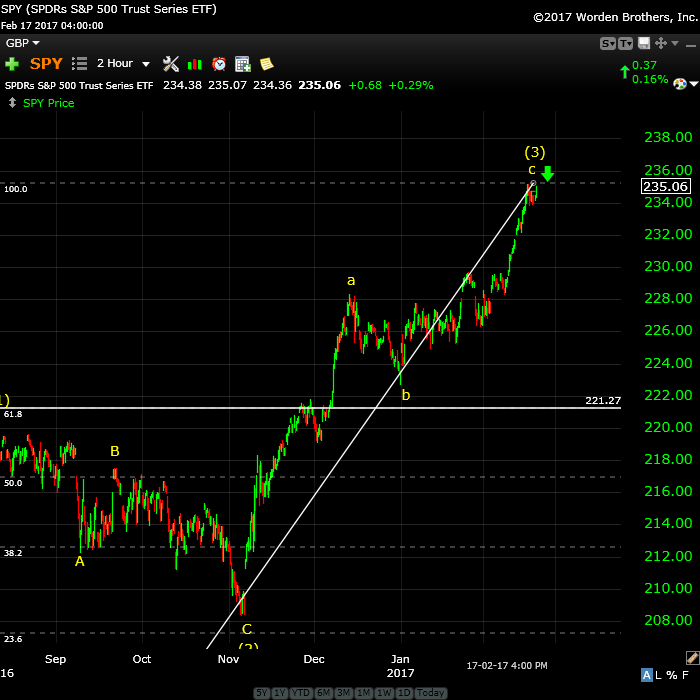
Above is the 2 hour chart of SPY showing a simple abc wave up. This labelling reinforces the idea that this wave up is corrective and has the same prognosis as the SP500 and ES. We’re at the top of wave 3 expecting a turn down within the next couple of days.
221.27 is approximately the 38% retrace level of wave (4). The bottom of the previous wave 4 up, which is also a likely stopping point, is ~222.67.
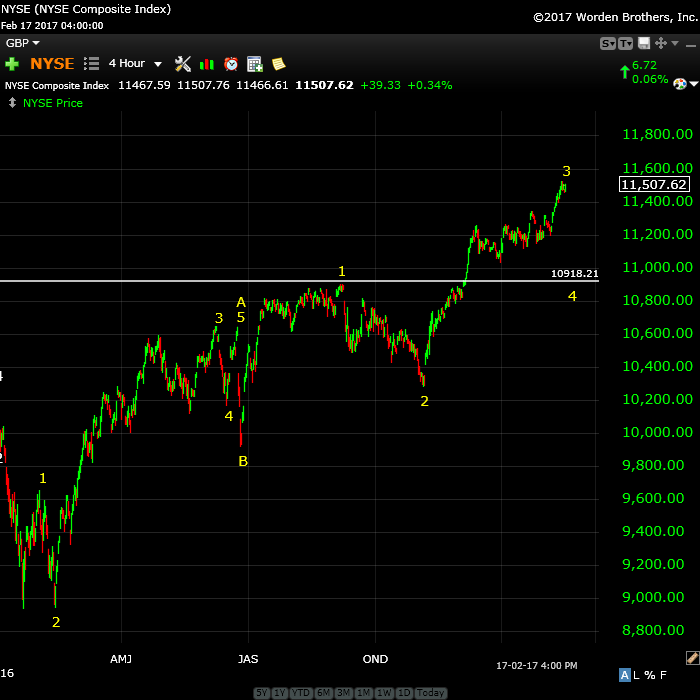
Above is the 4 hour chart of NYSE.
On a near term timeline, wave 3 is complete, or almost complete. The fourth wave down should parallel the configuration I’ve already mentioned for the other indices.
The 38% retrace level is at 10,918, which is just above the first wave area, so this index still has the potential to trace out an ending diagonal—still to be seen. Wave (3) up also looks to be in three waves, so this is not an impulsive wave. Expect a turn down with the other indices in the first part of this week.
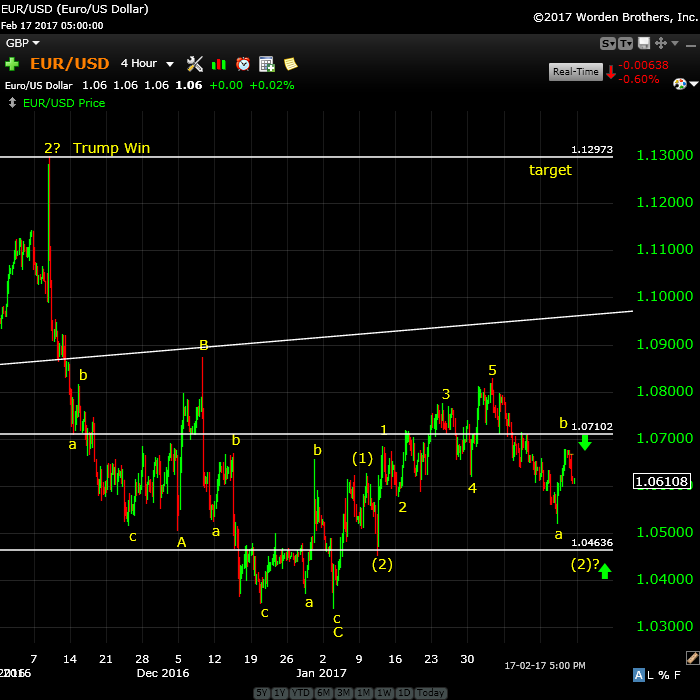
Above is the 4 hour chart of EURUSD. Here is the bigger picture for what I cover off in the video.
As I’ve been saying, EURUSD should continue down to a second wave (2) bottom at ~1.0464 (or a bit lower) before turning up into a third wave.
On a smaller scale (in the video) we seem to be completing wave b of the second wave. Wave b should still travel up to the horizontal line at 1.07102 before heading down to complete wave 2.

Above is the daily chart of USDCAD.
We’ve already hit my target of about 1.34 but I’ve been expecting a double wave (2) and we’ll slowly working our way to that end. We’ve completed blue wave A and B (in the video) and I’m expecting a C wave up in three or five waves before we turn over and head much lower. This is the look at the bigger picture. The next larger move is to the downside with a target of about 1.19.
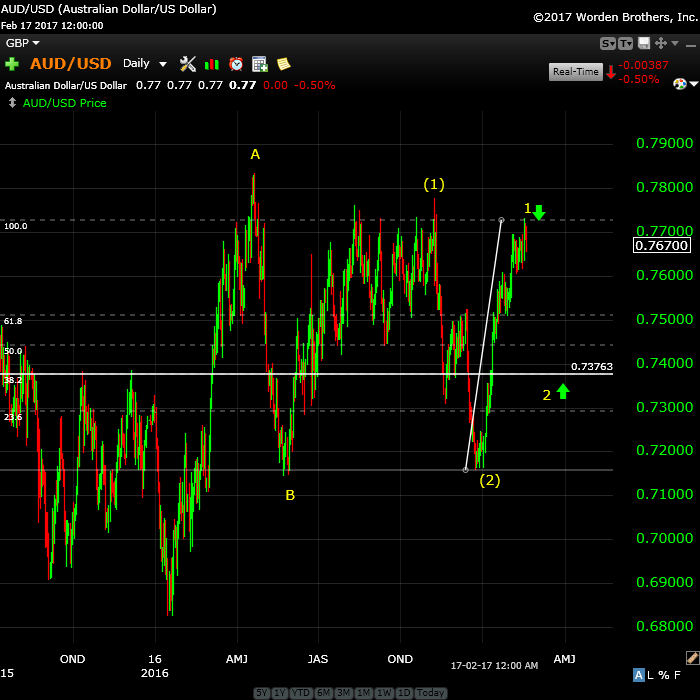
Above is the daily chart of the AUDUSD. This is the bigger picture to my short term projection in the video.
I’ve an eventual target of .828 for this pair, which is just shy of the 38% retracement level of the entire larger wave down (from the year 2011), which would make this wave 4.
In the video, I show that we’re already in wave 2 (within the A wave down). We will move to the target in three waves to approx. .737 before turning up into the larger third wave. More information for the short term direction is in the video.
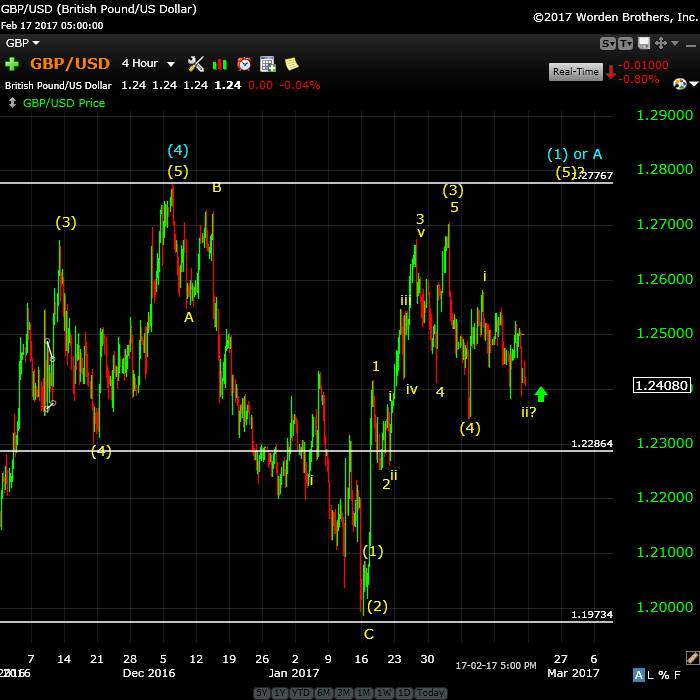
Above is the 4 hour chart of GPBUSD. During the past week, I’ve been calling for higher levels and the pound has not disappointed. This currency pair, however, is bucking the trend of the other pairs (moving counter to the EURUSD, for example), but will likely get back in sync soon. I would expect everything to head in to the 5th and final blow-off wave together.
Shorter term (in the chart above), we look to be in the final 5th wave of the larger first wave with a target of around 1.27767. After that, expect a turn down in a larger second wave to about 1.22864 (or lower).
My overall prediction here hasn’t changed from last week.
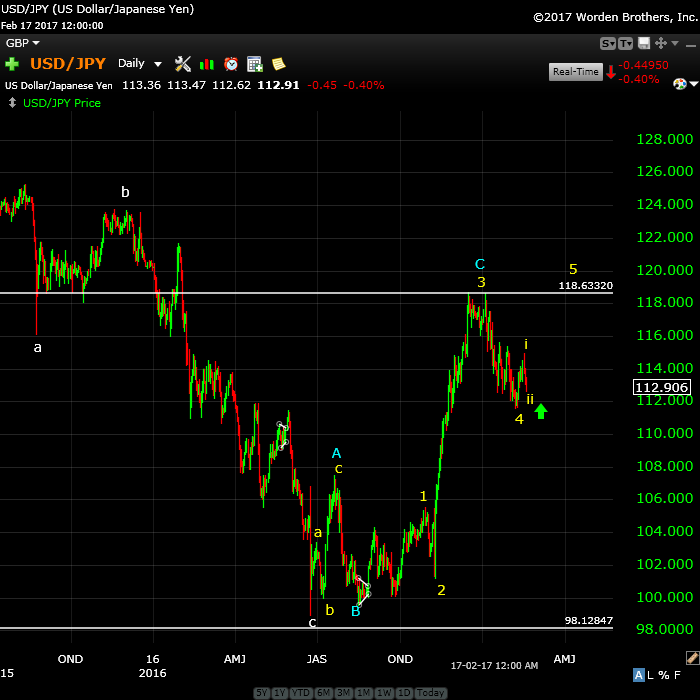
Above is the daily chart of USDJPY. We’re in a corrective pattern down and I’m expecting another correction up now to a target of about 118.63 (a double top). This will parallel the corrective moves in the other USD indices I cover (as they complete their second waves).
After hitting this target, expect a large C wave down with a target to come in the next update.
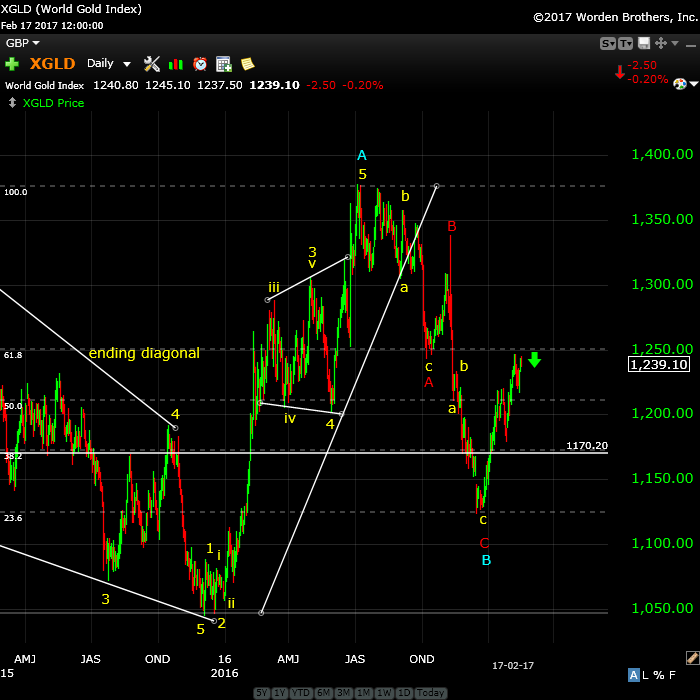
Above is the daily chart of gold. We’ve completed A wave up, but it looks to me as if it’s a wave four.
I’ve been calling for a double bottom for gold and this is still my preference. The wave up appears corrective to me. The wave up in silver appears even more corrective and they tend to follow each other. The alternative would be a drop down to the 62% area around 1170, but I prefer the double bottom at about 1122.
The final upside target is around 1585.
Above is the one hour chart of XGLD showing a potential double top shaping up. We’re not quite there yet. If you love risk, you can go short at the double top. If you’re risk averse, look for 5 waves down to a previous low and the three waves up to about 62% of that distance down and enter there. Silver looks to be completing an ending diagonal, which predicts a sharp turn down to the start of the ending diagonal (about 17.25).

Above is the daily chart of WTI oil. Not much new here. We look to be completing a topping process.
The waves down from the top were in 3 waves (shown in the video) and we look like we might we in a fourth wave triangle. My preference here is for a double top.
Once we top, the next move is down to a target of about 33.00 (in 3 waves).
Finally, we should get an E wave up to the upper trendline to complete the larger pattern. That would be followed by a final 5th wave down to a new all time low.
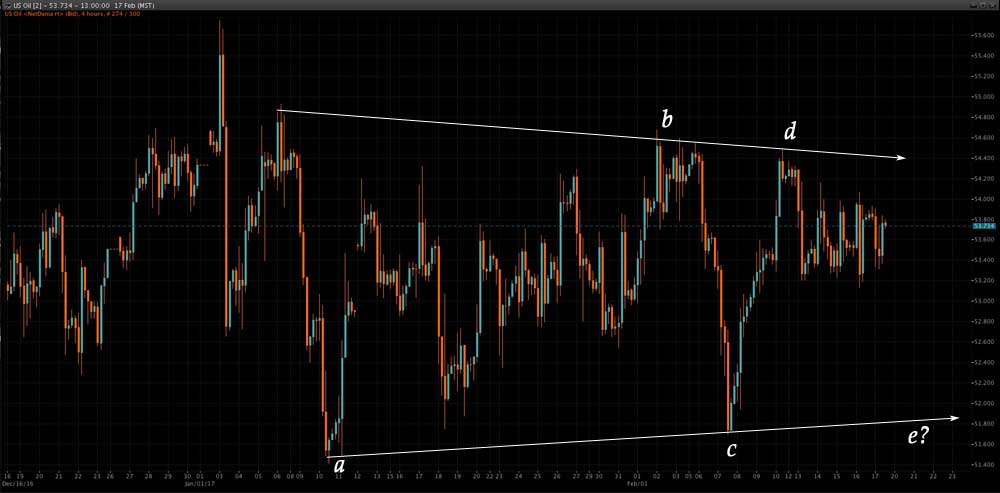
Above is the four hour chart of WTI Oil showing a possible triangle taking shape. If so, it will need one more wave down (E wave) before heading up to a double top. It may not be a triangle and in that case, may head up to a double top from here, but one way or the other, a double top is still my preference.
Good trading!
_______________________


Thx Peter for the update! Based on wave 4 most likely being narrow, I’m going to stay long/add to my SPX positions on the dip. Could take a long while to get to 2500+ on SPX. Should be a good ride! Happy profits!
Nothing certain there, so be careful. It’s just a guess, based on what I’m seeing.
Thank you! I have some tight stops in place at some of the retrace levels in the event it goes fast. Then will reload at the bottom of wave 4 for the grand finale.
As I expected phenomenal taxes has delayed wave 4. I would expect wave 4 to start when Trump publicises the tax plan and it should disappoint. Until then more flat/up in the markets.
I’m taking a wee break from the markets…set an alert at 2325 to warn me of wave 4. Will pop back at the weekends to read the updates but I don’t expect much on the downside this week. Keep an eye out for the Trump taxes speech.
Hi Peter
I have been hearing some people talk about Bitcoin recently and I know little about it but am starting to do some research about it. I just read that there is an ETF for Bitcoin awaiting approval – or denial – by March 11th which could have a major impact on the Bitcoin price.
With that said, my question is does EW apply to Bitcoin, or is it too new?
What are your thoughts on Bitcoin as an investment – is it similar to currencies without the chance of much manipulation?
Thanks
I don’t have any thoughts on Bitcoin as an investment.
EW is more or less operative on any trend, in or out of the market. I’ve seen 5 waves in lots of examples of trends, but then I’ve seen others where it’s not readily visible. The more “herd” involved, the more EW seems to apply.
A new free blog post is live at https://worldcyclesinstitute.com/another-win-for-usury-the-battle-of-waterloo/
Hi Peter
Do you think Oil has topped this morning?
Likely. I was looking at it last night late and it was almost there.
By my measurements, 2360 should be the top for ES. It had a double first wave and this is the second fifth wave. At 2360, the last fifth wave measures 1.618 X the first.
WTI Oil is at a double top.
ES is at the top of an ending diagonal.
The ending diagonal might negate that projected top and head a bit higher in ES.
I posted a chart of ES and the ending diagonal at the top of the post.
Peter you have more experience than most of us in these markets. How does one build a level of confidence in going short when the big bear starts when day after day everyone’s confidence is getting destroyed by the relentless rise. I getting concerned that after watching and waiting for the end of the bull to play out for over a year I will not have the confidence to go short when it really counts and miss the big drop. I tried to stay away from markets this week but i feel after following for so long why should i start giving in now! I need to learn to train myself mentally to not lose faith when then end just doesnt seem to come. Any advice would be much appreciated.
Q,
Extremely important question. I will share what I’ve learned shortly.
I lost a lot of money learning the markets early on and I went through stages of a loss of confidence in going long actually. I learned to short and couldn’t get it through my head that the market was intrinsically bullish. I say this just to make a point about the psychological demons you have to fight. Here are some thing I’ve learned (and I still find myself fighting to follow some of these rules (particularly overtrading).
1. Divorce yourself from news. News has nothing to do with the market. Now if you’re a fundamentals trader, that may be a different story. But if you’re a technical trader, then that’s what you have to be. There is no such thing as multi-tasking. Too much information just screws with your mind.
2. Don’t over-trade. Be in the market less than you’re out (depending on the market). There’s nothing wrong with being a student of the market and just watching it, which I’ve done for days on end, without actually being in it.
3. Use stops religiously. If you’re only in one asset and you have terrific discipline, then mental stops probably work for you, but you have to be watching the market. If you’re in more than one asset, then stops are a must. Again, that multi-tasking demon again.
4. Have a plan for each trade. I have learned to always have a target and to know when I’m wrong. When I’m wrong I get out. There’s another train coming today or the next day. Don’t hold onto a trade “hoping” it will turn around.
5. In this market, don’t get aggressive. Trade with half your normal amount. Seriously, this is the most dangerous market I’ve ever seen.
6. If you’re not absolutely sure of your trade, wait. The market will usually send a strong signal when it’s going to turn. Like the top of this third wave. We finally have an ending diagonal. That’s a sure sign of a turn. The waves leading up to it were kinda signalling a turn, but there was nothing definite. Either a double top or a pattern you know is an ending pattern is less risky turn point, but don’t pick tops and bottoms, which leads to my next point.
7. Don’t pick tops and bottoms. There will always be a “second wave.” That’s a lower high or higher low (depending on which way the market is going). They generally retrace 62% of the previous wave. You lose very little in waiting for that wave and you lessen the risk substantially. Stick a stop below or above the turn (and your entry).
8. Find yourself a preferred pattern and stick with it. If it’s the pattern in point seven, then don’t stray outside it unless there’s an opportunity that is absolutely stellar, but use stops when you trade it.
9. Don’t trade with money you can’t afford to lose. Trading successfully requires you to divorce yourself from emotions. This is a really important part of trading. You have to treat it like a business. I learned in business not to take on every client—there are good ones and bad ones, big ones and small ones. And never put too much work or reliance on only one client.
10. Look for opportunities across a range of assets (the market only gives easily at certain points and patterns). The point is that if your favourite asset isn’t performing well, don’t stick with it. The opportunities and patterns are what you need to look for. And if they don’t fit your criteria, pass.
Those are a lot of the important rules I try to live by. The most important one is to not over-trade. Most people do this. Or they get into too many assets at the same time, which become really difficult or overwhelming to manage. It’s much easier to work with one asset and add to it on retraces after you’re well in the black.
As with everything we learn in life, completing each separate task several times successfully gives us confidence. Trying too many tasks at once leads to overload and an loss of confidence. The market is the ultimate test and it can consume you and eat you up. I had to learn the hard lesson that it’s not a video game.
Hope this helps. There may be others that can add to this and that would be welcome.
In ES, we ‘re now in wave 4. If you’re contemplating getting in, I expect a first wave down to the previous 4th at about 2349 and then a bounce up to about 2360/1 (about 62%), That would be a likely short. The target for the larger A wave is 2320 (the origination of the ending diagonal.
In ES, we’ve already done a 62% retrace and are now heading down in a third wave. So my previous targets (except 2320 as the ultimate wave A target is still good) won’t work. This first wave will likely target the 2337 area and come down in 5 waves overall.
We want to see a new low, however. There’s still the option to go to a double top here until we see a new low below 2355.50.
I just zoomed into the 1 minute chart on ES. It looks to me like 3 waves down and 5 up, which means a double top is most likely.
Thanks for the lengthy response above Peter. Will try and follow your points. We also just hit the double top!
I see that and I have nothing to guarantee that it will hold. But the top, if it’s not here, is nearby.
Thanks Peter. I’ve decided to very strictly keep to entering at the 5 down 3 up point so will enter when I see that.
I’m still holding out for 2400 on top of wave 3. Getting closer! Seems just staying long has been the way to play wave 3 so far.
Peter, checked the EW count this afternoon, they project a down – up sequence before they complete wave 3, do you think that’s a reasonable alternate at this point? thanks
Tonight’s Market Update for Wednesday is at the top of the post.
AUD went above .76923. What does that mean for AUD back to test the previous high of .77?
It might very well. The wave down from about .769 (my marked fourth wave) went to a new low (at .765) and could be wave 5, but the wave down looks like 3 waves. If it’s truly 5 waves, the wave we’re in might be a second wave and end at .77011 roughly. If not, it’s going back to the top.
Quite frankly, I’m getting tired of this market. I’ve never experienced anything like it. We just seem to be wandering around. You think you’ve got 5 waves but then one subwave is out of place and the entire thing backs up on you again. So I’m not very trusting of anything at the moment.
At the same time, it’s not like we’re going very far. It’s just extremely frustrating (and a lot of work with little or no payback). I got out again early this morning at the low and I’m contemplating waiting until ES tops and/or waiting until the 5th wave sets up.
There are certain times when you should be completely out of the market and this appears to be one of them. Sorry I can’t provide much more insight.
AUDUSD has now been going sideways for about 3 weeks, so it should break down soon is another way of looking at it.
Thanks for the info.
Darin,
There is no momentum in this market right now until ES/SPX turns down, so I think we’re destined to wander around until then. Currencies are all out of sync, which says a whole lot about momentum.
AUDUSD is down in three waves from .771 so it has to go back up to the top, and a C wave the same length as the A wave will take it back up to the very top (.773 or so).
I just got reminded that Andy Pancholi’s turn dates are the 23/24, which is Wednesday/Thursday, rather than today (which I mentioned in the video). With the holiday, I’m getting my days mixed up.
So I’d expect a turn tomorrow or Thursday in ES/SPX and the 24th is a EURUSD turn date.
This has been great! Just buy on ES/SPX dips and it bounces back. Wave 3 has been one of the strongest waves in a while. I know I was half kidding about 2400 a while back but it now looks possible in the melt up on Wave 3. If we get that high from an EW perspective would that change anything as far as the drop in Wave 4. I can’t see any patterns that have any rules. Guess we just have to wait to see wave 1 down for more clues?
The FOMC minutes will be released at 2PM EST (from the Feb 1 meeting) and although I don’t know, I would think this may have an affect on a potential top in ES/SPX, which is in the works.
ES fell out of what looked like a smaller ending diagonal and now we’re just looking for a slight new high in ES and SPX.
FOMC barely had any effect. Doesn’t seem to matter any more if there are 0 rate rises or 12 in 2017.
Lets give Q-destruct another go! Sold march Dow puts at 20000.
We may not get a new high for SPX or ES. If I drill down to the one minute charts, I can make the argument that they’re both in second waves.
The Market Report Video for Thursday is live at the top of the post.
ES at 2800? Really? I don’t see how that fits into your picture of a wave 5 top within a couple months. The final high will be much lower I reckon.
Q,
Well, that’s the norm. Let’s see wave three took 3 months, so yeah, we might actually be looking at Sept by the time this thing tops. I gave up trying to pick top dates. EW doesn’t do that, so I’m not (my demented logic). 🙂
Quick question on that 2800. I agree with you Peter on 2800.
27 times the market had a positive jan and feb, and 27 times the market was up (100% of time). Average gain was 24%. 2238 to 2800 is guess 25%! I know that has nothing to do with EW, but pretty remarkable stats (anytime something its 100% over a long period of time).
Here’s my question though:
Wave 1 1810 2193 383 points
Wave 3 2083 2367 284 points
Wave 5 2238 2800 562 projected points
So a normal Wave 5 is almost the same size as the two previous waves (1 &3) combined?
Oh crap, I copied the wrong friggin number. It should be 2577 for ES. 2800 is 2.618 X wave 1. 2577 is 1.618. I’ll correct that in the chart show tomorrow. Thanks for flagging it, Jay! 🙂
Wave 5 is the same length as 1-3 combined often in the first wave. But this is not the first wave, it’s a C wave, so it won’t be.
Ok that makes more sense! Was thinking I missed something.
Looking at AUDUSD now, I’d say it’s topped. I can see three of five waves taking shape. The bottom of this wave should be about .7675
NQ is coming down fairly hard this morning out of an ending diagonal (15 min chart). ES did another tiny ending diagonal for a small new high and is starting down.
ES really should come down to 2355 before we get a second wave bounce. 2355 meansures to the end of the first wave for me and is also the start of the last ending diagonal. Then it should bounce 62%. That’s what we would call a small degree first wave.
ES: so far, so good. The second wave should bounce to at least 2362.75 and around there should be the short entry.
ES is extending, so the next bounce point is 2349.
ES has bottomed in an odd place, but if this is the second wave, the target on the upside at 62% should be about 2362. It should go up in 3 waves. There are a number of odd things going on, but this isn’t a normal market.
Looking close to a point for me to close out my wave 3 longs (nice ride!)… We look close to a good point to short SPX now?
Hi Peter, I’m sure you’re getting ready for the chart show. Just a quick question – it looks like we bottomed at about 2355 and then came up about 62% – in your estimation, have we done 5 waves down three waves up to signal the preferred short entry point?
Thanks!
Yes, it shouldn’t go above the present high just shy of 2364.
Uh oh! Another new high in SPX/ES. Wave 3 continues…
The Chart Show recording is live at https://worldcyclesinstitute.com/february-23-2017/
Does today’s new high in SPX change the count?
The Market Report Update for Friday is live at the top of the post.
Good morning Peter, have we had the 5 waves down, three waves up yet in the S&P?
Thanks for all you do!
I just placed a comment: We have a first wave down in ES, SPX, AUDUSD and now we’re looking for a 62% retrace in a second wave.
Perfect – thank you – the moment we have been waiting for!
We have a first wave down in ES, SPX, AUDUSD and now we’re looking for a 62% retrace in a second wave.
I posted a chart of ES, although the wave down is a strange one. However, based on where it bottomed and what else is happening, I’ll call it wave 1.
With ES, it has to go up in three waves. We have one so far. It may go up beyond the target, because of the strange configuration and the fact that there’s such an underlying bullishness, so best to wait for the turn down.
Gold looks like it came down and retraced 61.8%.
Shorted at 1257, on a tight lease with a stop .80 higher.
Mike,
You get an award for bravery. Actually, it doesn’t look all that bad. I can make an argument for 5 waves down and three up and also for a drop to a previous 4th. I’m eyeballing it and we seem to be about 62% right where you went short.
I also see what looks like a zigzag complete as the final set of waves up, although can’t be certain of that. Hope this pans out. I like it so far.
Most would say based on fundamentals, this trade makes no sense (since the US market just topped) and that’s why I don’t go there … 🙂
to fundamentals, that is. I’d rather stick with technicals.
One slight concern: Silver retraced higher than 61.8%
Screw fundamentals. I lost my a** trading that way. Technicals are the way to go. Usually the events/fundamentals play catch up to the charts.
IE — The election. I knew the S&P was going up, but thought HC would win. Doesn’t matter that I got the election result wrong, I got the market direction correct.
Prior to that, we saw S&P going down when it closed at a high. Shorted that Friday, and what do you know, FBI investigation opens up over the weekend and the market comes down.
It needs to get to at least 62%, so I wouldn’t be too concerned about silver. It also looks to have completed a zigzag on the last wave up and I was looking at a possible ending diagonal, although I haven’t been back today to look at that. I don’t like where it bottomed, but that may be a small concern.
And it completed a double top, a good thing.
Look at a 5min now on it. I was early, but no damage done. I see 3 up and it almost tagged 1258. Added at the top, closed the other position flat (so I’m in higher now). Would like to see it break 1255.81 before the close to instill a bit more confidence in this one, but judging by with AUD & Euro are doing, I’d say I’m okay.
Also nailed the Euro top this morning & been in AUD since .77291
Really looking forward to this thing hitting our target and going long. The swap fees on the sell side eat away profits the longer it takes. .738 to .84, could just buy the bottom and leave it there.
Looking very good on gold. I think you’ve nailed it. Silver went to a new high and it didn’t follow. The three up looks very bearish.
AUDUSD has been a bugger, but it’s got a really great-looking first wave down now. We are on the way on that one, finally.
Mike,
Well, less likely now, but we’re close on gold. We might get a double top here.
I think in the US market, we’re going to sit under our retrace target all weekend. Just because we’ve topped, doesn’t mean it’ll be any less frustrating …
And I’m out with a small profit of $9 near BE. Not in the mood to ruin a week of good, solid trades and a very nice morning. Worked my way out of an $1800 drawdown on AUD and turned it into a nice profit. Closing the week on a good note…
Good for you!:-)
Now that I look, I don’t have a turn date for gold until the 28th.
Gold is looking like a potential top with what looks like 5 down and 3 up to 62%.
ES has not reached its retrace target yet, but it’s close.
My target short entry on AUDUSD is .771
USD/JPY falling through the floor!
Well, it’s not yet but it likely will. I have a target now for 111.4621, where the C wave is = to the A wave.
ES is through the target so probably a double top or new high coming up. The everlasting wait continues…
Yeah it looks like Andy’s turn was a low with new highs on the way? Doesn’t look like Wave 4 will ever begin lol
As I commented earlier today, I was expecting a higher wave for SPX than the retrace target, so this doesn’t surprise me in the least. They all have to get to the retrace level and some are closer than others. NQ is just barely above it, so lets not jump to conclusions before we see what’s going on. AUDUSD still has a ways to go.
SPX / ES have not made new highs.
The new post is now live at: https://worldcyclesinstitute.com/the-first-wave-sequence/