
Update Thursday morning: The futures dropped further overnight, so what we have now is almost a full set of five waves down, which will likely complete this morning. Then we should retrace about 62% rather than to the top of the wave. Not a huge change but the good news is the downtrend is confirmed now as it looks like we’re into the third wave. So we’ll open lower rather than higher. Just mind the retrace and then it should be all downhill from there.
Bottom Line: The third wave down is just about to get started. It has a lot of downside to go.
Yesterday, the SP500 just missed my projected target of 2104 (it hit 2103.46) but keeled over anyway. Overnight and into this morning, the main US indices may have come down in five waves, although it still looks like a 3 to me. With the announcement of the Fed minutes today, the market rallied back up in 3 waves, filling the appropriate gaps and then came right back down again. But it came down in 3 waves, so the likelihood (which I’m starting to see in the futures tonight) is that we head back up to test the spike at the top of the second wave we just created today at 2096.17 in the SP. We could also head just high enough to test 2114 as I’m not 100% certain that today’s wave down was a complete 5 waves.
The bottom line is we’re heading lower over the next couple of days.
Today was a very telling day—there were three stocks down for every one up. It was a broad-based decline, even though the Fed minutes gave the market a little bit of buoyancy. The advance decline was negative all day.
The market has been like a yo-yo lately, but as the bulls fail time and again to make any progress, the selling pressure starts to show up. Today was a good indication of what’s to come.
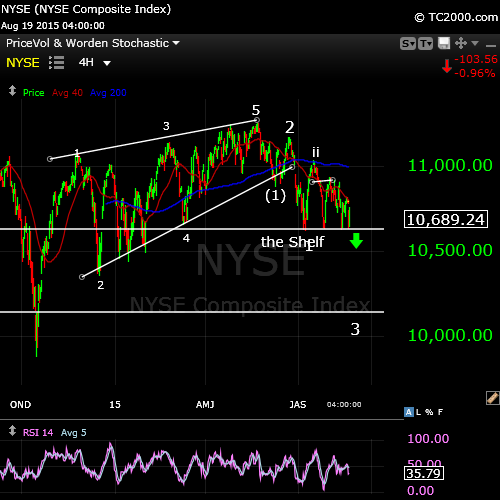
Let’s look at the big picture first. The NYSE above (the biggest exchange in the world) is progressing nicely downhill. We need to drop through the shelf, which I’ve identified in previous posts before the pace really picks up. So far, we seem to have been in a series of bounces within the third wave as we work through the resistance.
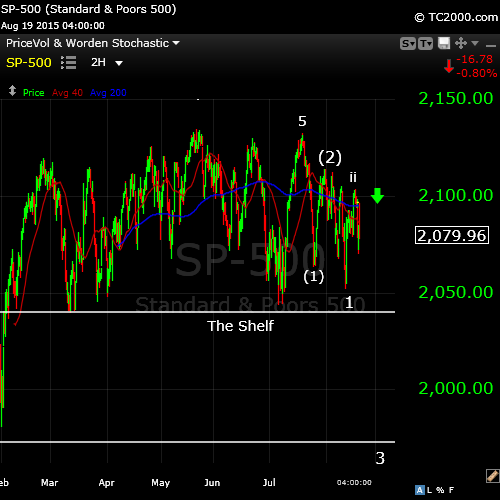
The bigger picture on the SP500 (above) is much the same. I’ve changed the labelling slightly to reflect the fact that it appears we did a slightly truncated double top at the very top of the market (the wave marked ‘5’ on my chart missed the previous high by less than $2.00—$1.88 to be exact). It certainly makes the count a little cleaner, but the market overall is a bit messy. We’ll jump in for a closer look at the more recent action.
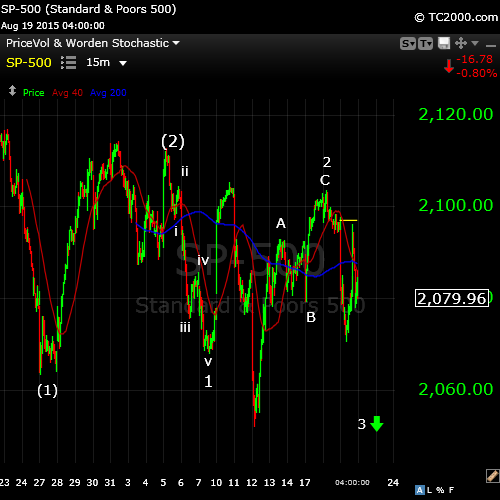
Zooming in on recent market action in the SP500 (above), you can see wave 1 came down in 5 waves. Today’s wave also looks like a motive 5 down and then we went back up today in 3, then down in three. So today’s wave will likely retrace to test the top of the wave and then turn down. The challenge in these counts is that the double tops are missing an exact double top by a dollar or so, but that indicates a very fractured and weak market. If we somehow head up above the previous high at 2104, we would have to turn down at 2114, or this count is incorrect. However, I’m confident at this point that we’ll head lower and when we traverse “the shelf,” we should drop dramatically lower.
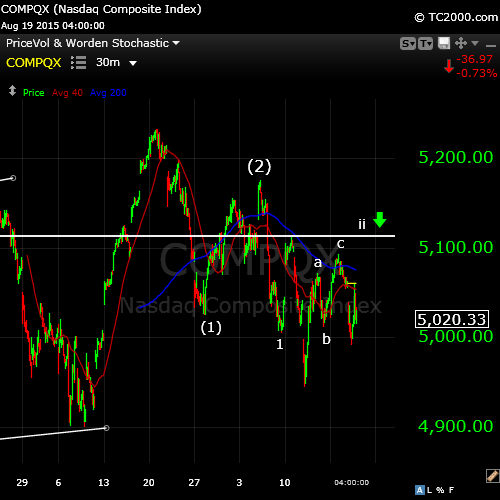
The Nasdaq is similar to the other indices now. After reaching the top in 5 waves, it came down in five waves to complete the first wave down. We’ve also completed a 3 wave second wave and now we’re working on the third wave. After today’s move down, I’m still expecting the Nasdaq to make the wave ii target at 5112.47. It may not, but it’s the most obvious target and would create slightly more complex wave, but still obviously a countertrend wave. The trend is down.
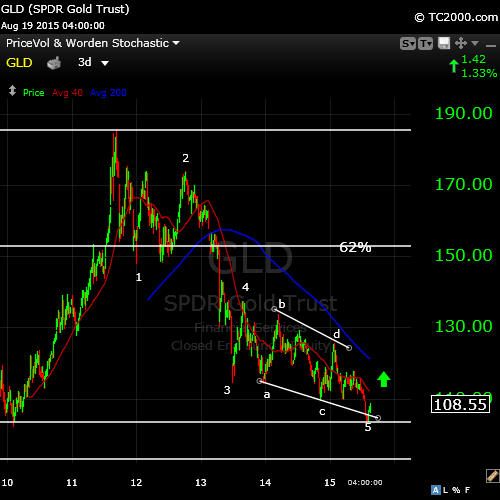
Some time ago, I flagged GLD (gold ETF) as having completed an ending diagonal. Ending diagonals are ending patterns of a wave sequence, appearing in the fourth wave position. They typically involve a “throw-over” which sends them slightly below the lower trendline, which was the case here. Then they head up dramatically in the opposite direction. This has been textbook so far. I expect it to reach the 62% retracement line. It’s a countertrend move, so once it gets there, it will reverse downward into a C wave, which will eventually reach new lows.
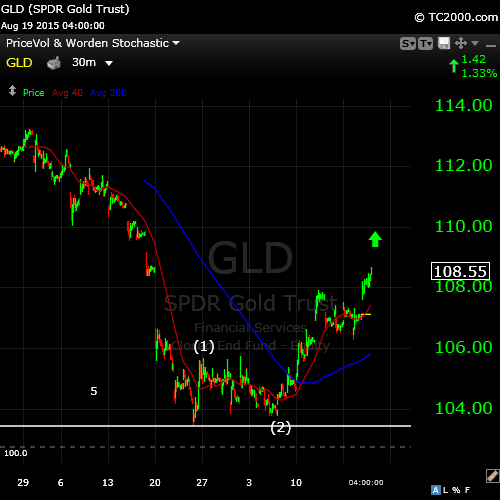
Zooming in to GLD, you can see the bottom of the ending diagonal. Wave (1) went up in a clear 5 waves, wave (2) came down in 3 waves and now we’re well into wave (3). Wave 3, as a indicated in the previous chart has a long way to go. It also adds to the expectation of a downtrend in the US market, as when the market moves down, there’s often a flight to gold.
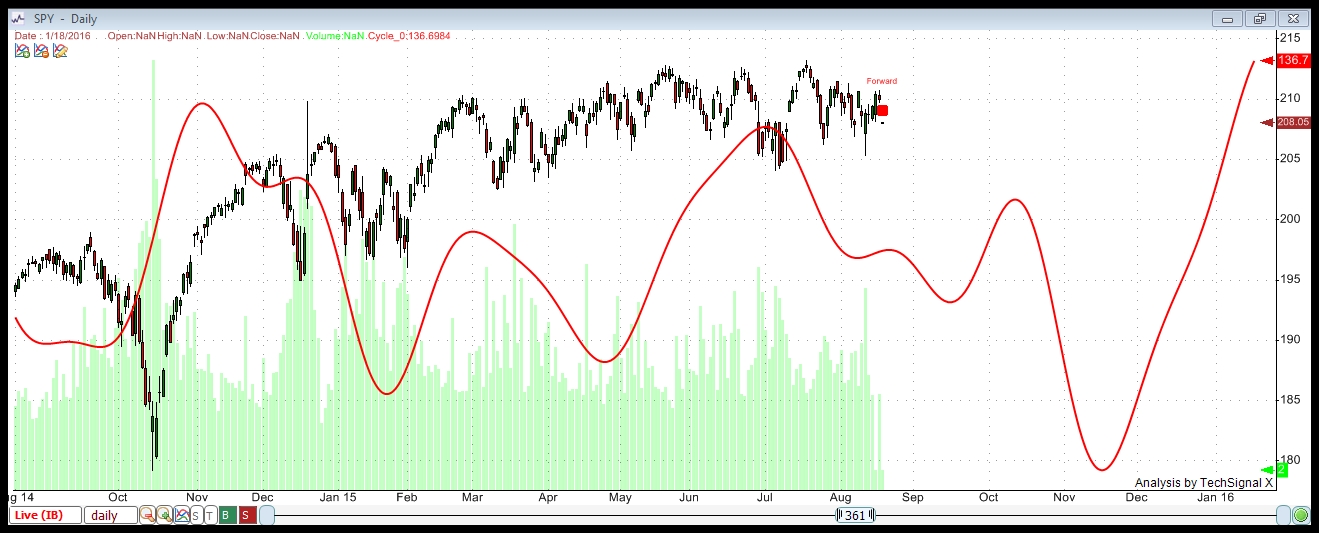
Finally, here’s a cycles analysis of the SPY (SP500), showing the longer length cycles are clearly heading down short term into the beginning of September with a bounce coming at the time. I would suspect we’ll see a full set of 5 waves down be the beginning of September. This uses TechSignal 10 from the Foundation for the Study of Cycles, ground-breaking software that analyses cycles within any market asset within seconds. The above analysis uses 13 year of data. I have selected the cycles with the highest profitability to plot a combined projection.
Have a great evening!


Still my hero! Keep up the good job Peter. 🙂
Cheers,
W
Its morning now, 6.20 am , Good call Peter. I like your slow cautious approach.
We have a good blog going on now, . Please every one be nice to each other, lets not
turn this place, like so many others..have done. Thanks ….n
Just a quick note that I’m going to do a quick update. Futures came down further overnight and so now we have a full wave down. We won’t retrace to the top of this wave now. The downtrend looks to be confirmed.
Hey Nicola,
If anybody is gonna ruin this blog, I will personally track him/her down and put my feet up his/her ***. ^^
Cheers to you all,
W
Now even I’m scared!
Hi Peter,
I’m full short since July.
We are going down in Europe, but on really small volumes.
It means that institutionals don’t sell the paper, only may be hedging the positions.
So, there are two possibilities: either very violent up to squeeze all the stops or the institutionals will realise that “this time is really different” and begin to sell. But in this case it will be scare movie
Well, the US market is going down. NYSE dropped below “the shelf” so we’re committed. Third waves are “nowhere to hide” waves.
Do you mean that the third wave shouldn’t be necessarily accompanied by a significant volume?
“Significant volume” is relative. Yes, but it’s summer and there’s relatively no volume compared to just about anytime in history. Volume should certainly pick up as we get further down into the third wave and fear starts to pick up. NYSE’s at a new low, DOW’s at a new low, but the SP and Nasdaq haven’t broken down yet. It will take a bit more time to work our way through the resistance. VIX is also taking off …
I have a target for the SP of at least 2000, but I think it will go significantly lower in this wave … remains to be seen.
You da man!…..n
Thanks. Just the start. The toughest part is now over.
How nice it to finally see things happen that we thought would happen Peet? 🙂
Tomorrow, when I am in Barcelona (1 week holiday whihahahahahoe), I will drink my first Estrella Damm beer to you Peter! And let’s not forget André, where are you mate? 🙂
Cheers guys,
W
Yeah, have two for me … I’ll drink André’s. Have a great holiday. More when you get back. Yeah, we’ve been waiting for this market to get its act together for a while. Now, it’s all about measuring waves.
The way I see it for now, tomorrow (turn date for me) we go up again until 25 aug. There we set the top for wave 2 of BIG WAVE 3 DOWN. AEX maximum 490 (underside gap), but than it needs to be a very hard up ABC zigzag. After that HARD DOWN AGAIN!
We will see, just my 2 cents for next week. 🙂
Greetings,
W
In the US market? I wouldn’t count on it.
Great call, Peter. By the time a bear market starts, I have been “trained” to take profits quickly, as all my shorts have not worked. So is this a Crash’, and how do we play it, not getting out too soon.
Hi Kent,
As I don’t know what you’re targeting asset-wise (stocks, currencies, indices), hard to say specifically. I try to give targets … like SP500 2000, so you can be sure that’s it’s going to go to that level. Not all stocks will follow, of course. They would have to have a similar EW pattern. If you have the capability of fibonacci measurements, the third wave is always at least 1.6 times the length of the first wave and the fifth wave will also be at least 1.6 times the length of the first wave. We’re near the bottom of the third wave so I’m expecting a bounce soon into a 4th wave. That wave will be in a clear 3 wave pattern and rise about 38% to the area of the previous 4th wave. I will be doing a post this weekend and if we’re into the bounce, will give some guidelines.
Other than that, in the SPY for example, you can trade at the top of three wave spikes, knowing that we’re in a strong downtrend. This downtrend won’t be over for another week or two. I hope this helps.
In terms of it being a crash … I always find it a funny term, as waves have finite lengths and nothing goes straight down. So, the patterns are somewhat predictable and wavelengths even more so. eg- if wave three isn’t 1.6 times wave 1, it will likely be 2.7 times. So if you drop over the initial level, you can count on the next one being the probably target.
This week I’ve been concentrating on Gann timing. Maybe I can talk about that a bit this weekend. My forecast last week was right. And I gave you the reason : the moon was finishing a rate of change inversion 8/18. That’s when the decline started. The challenge I now see is to integrate all my tools so that I get strong confirmations.
The more I see the more I am convinced that maybe my 19 year cycle – that peaked 6/16 – isn’t so bad. My Dow 1929 system has been confirmed and is stronger than I could have imagined. I see a long term high in november 2020, but before that we’ll be down into 2018, possibly around april. In that case we would do 2 times 360 degrees, half of the 4 times we did from the high in 2007 into the high in 2015. My system gave 5/15, pretty consistent with Peter’s long term target. Still a lot of work to do. This weekend I will tell some more about Gann. With all the analysis I have done so far I can honestly say it works.
Cheers.
André
P.s. No beer for me 😉
You’re losing me in the latter half of your comment, but look forward to your post this weekend. 🙂
Peter,
My Dow system is built on square of nine principles. One step further away from the center is one circle or 360 degrees.
Hope this helps.
I’m aware of Gann’s square of nine and that’s about as far as it goes. I have a couple of his books, but the wrong ones for learning about that principle. I’ll have to look around as I’m interested in learning it. Thanks for this.
Peter,
This weekend I’ll tell you what I know. Once you get it it is really simple and it is the most powerful system I have ever seen.
Cool! 🙂
Looks like we just did a small ending diagonal in the SP, so this third wave should be done. We should bounce about 38% from here (1985 or so SP500) to the previous fourth to around 2030. Then a fifth wave down.
Kent,
Just let me add that questions like this are great as I’m contemplating putting together a course to help people and also going to consider going to video posts on the market in which I’ll be able to explain more … 🙂
André,
This weekend, I’m going to be moving my site to a faster server so there may be a few hours of downtime and could lose a comment during the process, but if that happens, I’ll be able to transfer it from the old site shortly after the move. Hoping it will be relatively seamless.
I saw your forecast on gold above. Do you have any for bonds and the $? I like solarcycles. I saw your comment on it while looking back to see if you had any other markets forecast. A few day traders seem to have taken over the comments, but John H. stuff is great.
I follow TLT. Very similar to GLD in that it’s in a third wave of a new bullish sequence … from $115.00. Long way to go on that one, too.
Missed your reference to the dollar the first read through, sorry. It’s in a countertrend move right now. It started by doing three waves down. So, it’s eventually (I think soon) going to turn around and head up.
Peter, congratulations for your analysis. You nailed it!
Assume we rebound next week from 1950-1970 area. What could be the final target for w4, maybe around 2030-2040?
Thank you.
Hi Ricardo,
Thanks! We should bounce starting now (so the futures will head up Sunday). 38% is at about 2021. The previous fourth is about 2025 so somewhere in that range. The 5th wave will be large and should get to 1820, so don’t want to miss it.
Sunday? Mmm. S&P made high 2130.82 on 5/20. Take square root of high (46,2) and add to 5/20 : 7/5. Take square root of 46,2, add 1, and re-square = 60,7. Add to 5/20 gives 7/19 (Wait a minute, wasn’t that a high?). Do this trick again (square root, add 1, re-square), now we get 8/5. One more is 8/23. 8/23? Sunday!
After the 7/19 high we had to add 1 twice to get to 8/23. 2 represents one full circle or 360 degrees. So now we could say 8/23 is 360 degrees from 7/19 high.
So 8/23 seems like an important date, and the market will react. The long term trend is down so the bounce will not be impressive. Still think 9/4 is a more impressive low. So next week some strong inversions almost every day. 8/26 seems like the strongest turndate, with the sun conjunct Jupiter at 153 degrees and the nodes square the apex. Moon at 135 degrees, Venus at 16 degrees And Mercury crossing the equator and a tidal change in trend.
So we’ll consolidate into Wednesday But then we’ll head down again.
8/3 was major turn. Add PI squared twice and you get 8/22. No coincidence! 8/22 is first quarter and a full moon in the natal chart. So this weekend is special. With a low either Friday or Monday.
I don’t really “get” what you’re doing yet, but that could be the timing. Let’s take the SP. We need to start Sunday up with a target of about 2020-25 (38%, or previous 4th wave). Then we’ll turn down. This should be as long at least as the second wave took to form, so 2-3 days sounds about right. It’s interesting to me to note (and I’ll put this in the next post) that when I did the plot of the path of the drop about a week to ten days ago, I projected the low of wave three at 1972. Well, we’re at 1971.95 tonight, which should be the wave 3 low. Not bad.
I’ll put that chart up in the post this weekend.
Peter,
It took me a while to get my head around this and you are way smarter than me, so you will get there. The alternative is that you concentrate on EW and I’ll do Gann.
Let’s confuse you some more. The high on S&P this year was 2134. Let’s subtract 5 times 360 and we get 334. Look at the square of 9. 334 is a cardinal number at 180 degrees (west) in the 9th ring. Not just any number!.
1972? subtract 5 times 360 and we get 172. Look at sqo9. 176 is a cardinal number in the 7th ring opposite 334. This seems to me a more natural number. As S&P wasn’t able to stop there, there is likely more downside. Natural reversal points are 170, 163, 157 and 151.
151 is same position as 334 but 3 steps inward or the 6th ring. This would indicate that 1951 is a very strong magnet and likely the low on 9/4.
So, two possibilities. 1976 was opposite the yearly high; a very powerful level.
So, this could have been an overthrow. Other option is that this isn’t the low yet and S&P will dip to 1970 on Monday.
Pullback targets : 1983, 1990, 1997 and 2004. This last number will be 2 full circles from yearly high. 38,2 % of 2134-1970 decline would give 2033. Look at sqo9. 233 is 360 degrees from 1976 opposite yearly high.
This all is still a bit experimental for me, but let’s see what happens. 2004-2033 is from my perspective the critical zone for a reversal.
Smarter? Don’t sell yourself short! I don’t really have time for Gann at the moment—it’s a longer term desire. So, for the moment, you “own” it … haha.
Thanks for the updates Peter and Andre,
Bulls eye..
I m looking forward to read Gann I m a big fan ,if he was still a live these were interesting times..
The turbocycle was also spot on (the blue line fast annual) it predicts a bottom Sept 1.
And after that a big bounce
Also The mercury latitude was spot on August 18/19
Looking forward reading beautifull things on this site..
Nice weekend all..
Andre I will drink your Heineken my pleasure
Hi John,
You’re welcome. Much more to to come. Have a great weekend.
Hi Guys!
Congrats to Peter for his calls of late. I am down 3% since Thursday mid day, tho’ I did catch some of the down move with an inverse etf. I have been trying to use the PALS system in concert with buying recent lows, and selling recent highs which turned into a bad idea with last two days of trading. Margin calls and retail selling may have Monday and Tuesday lower, but expect a short term bounce into rising declination and perigee full moon weekend. May not do anything next week as the market is in a state of flux. Interesting Jupiter is conjunct on 8/26 which has marked turns in past, tho’ given macro picture this may be the beginning of the valley of the shadow into October. Much obliged to Andre’ who is getting better with age, and is kind of inspiring with his knowledge and connective power.
By the way, Venus inferior conjunction has been very good for gold miners for a few months after so I took a modest (play money) position in GDXJ recently, and may add to it if profits roll in. Expect to lose tho’ as not sure GDXJ will not be much lower before it has an inevitable rally.
valley… i am heavily positioned with GDXJ as I think this holding could be long term instead of just 8 weeks as I initially thought… I believe that the current intermediate cycle would not top until gold at least hit 1200. Every dip now is a good opportunity to buy imho. I might be very bias in thinking that this current gold bear market rally could turn out to be one of the strongest we have ever experienced.
Hi Erick,
I am in GDXJ with micro position. I am playing VIC for a few months, think GDXJ will eventually be 10 bagger, but may not set up for another year or so (totally guessing).
I am in cash waiting for a big sell off Monday to go long on the bounce, then go short again into end of the month. Cat like efficiency is going to be required next few months cause market seems like it is going to be increasingly volatile with no clear trend. But moon effects (phase, distance, declination) and seasonals will play out to give an advantage on direction.
That sounds like a wonderful strategy valley. I feel good that my strategy is aligning with yours 🙂 I am still short now, but I might exit all my short positions on Monday morning. What Peter said makes sense, that wave 3 is complete or almost complete, that SPX is due for a wave 4 retracement. My personal EW count indicates another 5-10 point drop in SPX before a bounce, but that is close enough with Peter’s count. His counts have been one of the best, and I love Peter’s gutsy call for a completion of wave 3, while most analyst I am reading are screaming waterfall from here.
Agreed so much on miners. There is no doubt that the intermediate cycle low was already behind us. I would go as far as saying July 20 could have marked the end of the gold bear market as well, especially if gold spikes over 1250 and beyond. No matter how low gold dips in the next couple months, GDX/GDXJ is a must hold for the next 2 years imv.
Kudoes to Peter. I am thankful for your EW counts. Always checking my against yours before I am making any big move. Your calls have been spot on. I am shorting heavily this week since my counts are confirmed by you. THANK YOU.
Big thanks to andre and also valley. So happy to see you on this board too valley.
What is your thought of next week? Is a strong reversal in sight or more selling to come?. I don’t think wave 3 has been concluded yet as SPX might target 1965 before bouncing. Some more sell-off to come, then a powerful reversal to the 2100s according to my count. There are so many people calling a crash on Monday, which makes me quite nervous 🙂
Look forward to your read.
I was able to move my site tonight without huge issues so I will blog tomorrow. Short story is wave 3 is done. You’ll find my projection in the comments. I’ll be much more specific in the next post. I wouldn’t be short Monday.
Thank you much Peter. I’ve seen your comments now. Look forward to your next post.
Hi Erick,
PALS next week:
Distance: ++
Declination: +
Phase: +Wednesday to Friday
Seasonals: –
Planets: ++
Summary: Seasonals are negative, yet most lunar aspects are price supportive all week. So, mixed picture, Monday deep sell off is my entry for a very short term long position.
Thank you much valley. i am building your geo indicators into my core of indicators for swing trading model. Your indicators combine with EW make my calls a lot more reliable. BIG THANKS
Hi Peter,
you are projecting the 3rd wave low at 1972. That means standard 1.6 of the first wave. And the 5th low you expect at 1820 (extended to 2.6 of the 1st).
Don’t you think that instead this 3rd one could extend to 2.6 like in August 2011. That means low at approx. 1890.
Like I told you few days ago once the BTFDers realise that “this time is different” and stop buying the mouvie would become really “scary”.
It could. But we’ve had five waves down, it ended in an ending diagonal, and indicators are diverging. Plus the markets came to a stop near the end of the day, which indicates to me that buy pressure has abated for the moment. Then you have cycles and planetary influences, which seem to be turning up short term …. EW in a trend is amazing precise. I’ll go with what the waves are telling me.
Thank you, Peter,
what time frame do you use to see that?
Oh … one more important element. We’re at the bottom right now of a previous low … a previous wave four. That’s the typical stopping place for waves, travelling in the opposite direction. You can see that on the four hour chart or the daily.
Otherwise, I drill to to one minute charts if I need to in order to see structure of underlying waves. Because a motive wave is fractal, they all have to be in 5’s.
As I look now, the ending diagonal was way more pronounced in the futures, but you can still see it in a 5 minute chart in the SP with a large overthrow, which then became another ending diagonal on its own … but you’d need to get down to the one minute chart for that. It’s the same in all the main indexes.
Thanks, Peter,
very amasing
New post up that explains a bit more.
I’ve been full short since few weeks.
I’ve sold 25% of the shorts at friday close and covered the rest with a small call.
I think that even if You have the reason and we bounce back from here, any way Monday morning Asia will sell off with the US futures deep in red and the Europe will follow with the gap down turning up in US open.
The 3rd wave is done if it is the standard one. But it looks so impulsive that it could extend like in 2011