
Ralph Nelson Elliott’s Work
Ralph Elliott’s ground-breaking book, Nature’s Law — The Secret of the Universe, was published on June 10, 1946. He died less than two years later, on January 15, 1948. He has been in ill health for over twenty years, an affliction that struck a couple of years before the 1929 stock market crash.
In 1932, having lost a large amount of his own money in the crash, at the age of 64, he was forced to turn to a new profession; he became intensely interested in the stock market.
What’s remarkable about his work is that he undertook it without computers and, in fact, had to invent his own ruler, called a “proportional divider,” the fulcrum of which could be moved to measure a 61.8% (the fibonacci “golden mean”) wavelength at various degrees of trend (as the market traces out the same patterns over and over again in a fractal manner).
Even at this early stage, Elliott was able to predict market moves with astounding accuracy and became somewhat of a sensation among a relatively small contingent of wall street brokers, most notably Charles Collins and Hamilton Bolton. Both had written books on various aspects of the stock market during the 1930s.
It takes some time to get comfortable with the quite unbelievable accuracy of this method in determining market moves. It took me about five years to master, which included an intense study of the market during that period (over 20,000 hours). It has taken a bit longer to feel totally comfortable with it’s reliability; it takes time to buy into the fact that it simply never fails to follow Elliott’s rules.
If it fails for some reason, it’s the analyst who’s at fault, in my experience. Typically, the analyst allows some level of bias to get into their analysis and this results often in missing key measurements, or simply not delving deeply enough into the wave pattern.
In my work, I’ve discovered errors in the Elliott Wave Principle book and refined some of the rules, discounted others, to develop a system that seems to me to be almost infallible. The small number of errors I make have always been due to my own lack of discipline.
The Elliott Wave Principle has proven to me to be astounding in its accuracy and reliability.
A Top the Whole World Will Enjoy
 Thanks to the work of Ralph Nelson Elliott in figuring out how the market moves, we know that ending waves are always in five waves. Final waves of a trend can either be an impulsive five waves or a triangle pattern of five waves. Those are the only choices; the final wave must be a fifth wave and it must consist of five sub-waves.
The US indices are tracing out their individual patterns, based upon this rule. The DOW looks to be tracing out an impulsive 5 wave pattern, while the NYSE and SP500 are tracing out contracting triangles. These triangles will result in one more relatively small wave to a new high.
Triangles in fourth wave positions trace out five waves, and warn of only one more actionable wave before a trend change. That final wave out of the triangle will rally in five wave to a new high. A five wave impulsive pattern also ends the trend.
Ending diagonals end is a final fifth wave that traces out three subwaves. It’s the only other pattern than can end a trend.
All the USD currency pairs are in corrective waves but are also in fourth waves positions. They all have one more wave to complete before their trends change, similar to the US Dollar. USDJPY is slightly different: It’s in a corrective second wave, with one more wave to trace out before a turn up into an impulsive third wave.
It’s a parade, but the outcome for the world will not be a happy one.
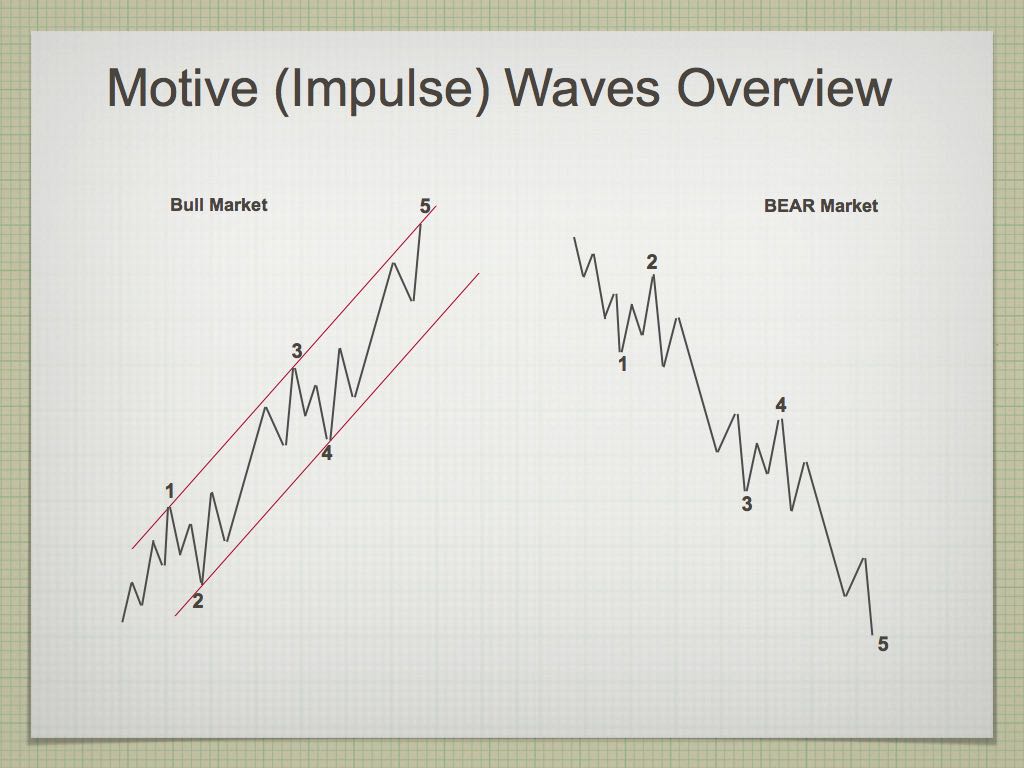
Above is a diagram of a typical impulsive five wave pattern. What’s as important as the actual “count” (five waves) is the look and measurement of the underlying wave structure.
Corrective waves (waves 2 and 4) must be balanced in terms of size, and all waves must conform to specific fibonacci-based wave lengths, in order to meat the “impulsive” wave test. What’s referred to as “the right look” is often ignored my analysts, and the specifics on wave measurement are for the most part, undocumented.
So, when I continually run up against the skepticism that this system can’t possible work, I “get it.” Most people aren’t willing to put in the work to master this method of forecasting the market. Those who do know that’s it’s the most accurate method known. It’s very simply how the market moves.
Elliott Wave Basics
There are two types of Elliott wave patterns:
- Motive (or impulsive waves) which are “trend” waves.
- Corrective waves, which are “counter trend” waves.
Motive waves contain five distinct waves that move the market forward in a trend. Counter trend waves are in 3 waves and simply correct the trend. These patterns move at what we call multiple degrees of trend (they are fractal, meaning there are smaller series of waves that move in the same patterns within the larger patterns). The keys to analyzing Elliott waves is being able to recognize the patterns and the degree of trend that you’re working within.
The motive waves shown above are typical in terms of their look and length. Subwaves of motive waves measure out to specific lengths (fibonacci ratios) very accurately. Motive waves are the easiest waves to trade.
Waves 1, 3, and 5 of a motive wave pattern each contain 5 motive subwaves. Waves 2 and 4 are countertrend waves and move in 3 waves.
Motive waves also travel in channels. The red channel above can be drawn from the apexes of wave 1 and 3 on one side and waves 2 and 4 of the other. The end of wave 5 typically meets the trend line on the wave 1 & 3 side before it reverses.
Countertrend waves move in 3 waves and always retrace. You’ll find much more about them in the countertrend section and the page on The Right Look.
To use Elliott wave analysis accurately, you must be able to recognize the difference between a trend wave (motive) and a countertrend wave (corrective).
____________________________
Registration for Commenting
Want to comment? You need to be logged in to comment. You can register here.
If you register, it protects your information. It also allows you to comment without filling in your information each time. Once you’re registered, simply go to the home page and click on the login link top right in order to log yourself in. Usually, you’ll be logged in for several days before needing to be logged in again.
______________________________
Problem receiving blog comment emails? Try whitelisting the address. More info.
______________________________
Rise above the rest … SM 2
Rise above the rest …I have only ever met a few people who, in their chosen fields (astrology, medicine, music, martial arts, technical analysis), rise above all the rest and you are one of them…you have ‘the gift’…and that’s why I’m a Trader’s Gold member. —SM |
The best of them JL 2
The best of them …Last couple of years, I subscribed to several ‘market traders’. You are by far the best of them and the personal contact is awesome. Daily and daily updates are very well written! Besides your expertise in EW, I also like your cycles analysis. Best investment I ever made! —JL |
Have not had a losing week RW 2
Have not had a losing week …I have been with Peter almost a year. The only thing that matters is have I made money with his service. I think I have finally turned the corner using Peter’s EW. I have not had a losing week in the last 5 months. Thanks Peter, for your amazing amount of hard work. —RW |
Get an upper hand … JC 2
Get an upper hand in trading …Seeing all the different currency pairs and the wave structures and hearing you explain why this has to do that on a nightly bases gives one a upper hand when trading. Elliott Wave applies to all stock and indices and can be applied to any candlestick chart. If someone ask what you want for Christmas – Tell them a membership to Peter’s “Traders Gold!”—JC |
Couldn’t be happier … KK 2
Couldn’t be happier …The analysis and insight you provide is simply amazing! I’ve been trading the futures and equity markets for well over thirty years and usually average around 5% monthly. Since joining your Traders Gold Service two months ago, that number has better than doubled. I couldn’t be happier.—KK |
the real deal SM 2
The real deal …‘Educational, insightful and thorough market analysis for all levels of traders. It’s Elliott Wave at its best….Peter Temple is the real deal’ —SM |
Tops in your field DZ 2
Tops in your field …You are tops in your field. Tried to follow Elliot Wave international for years. They were always behind the market. After discovering you, I perceive that you are an expert in reading the waves, which puts you way ahead of the rest of your peers. And you can read the Waves like you are reading tomorrow’s financial section. I pray you stay healthy. —DZ |
A true expert in Elliott Wave FL 2
A true expert in Elliott Wave …You are a true expert in EW analysis. What you provide is not available anywhere and is priceless. Subscription on your services is the best thing I have ever done. Many thanks for your effort to make me a better investor. I now have more trust in my investment decisions. I hope you will continue the excellent work! —FL |
The Market This Week
Here's the latest daily chart of ES (emini futures)
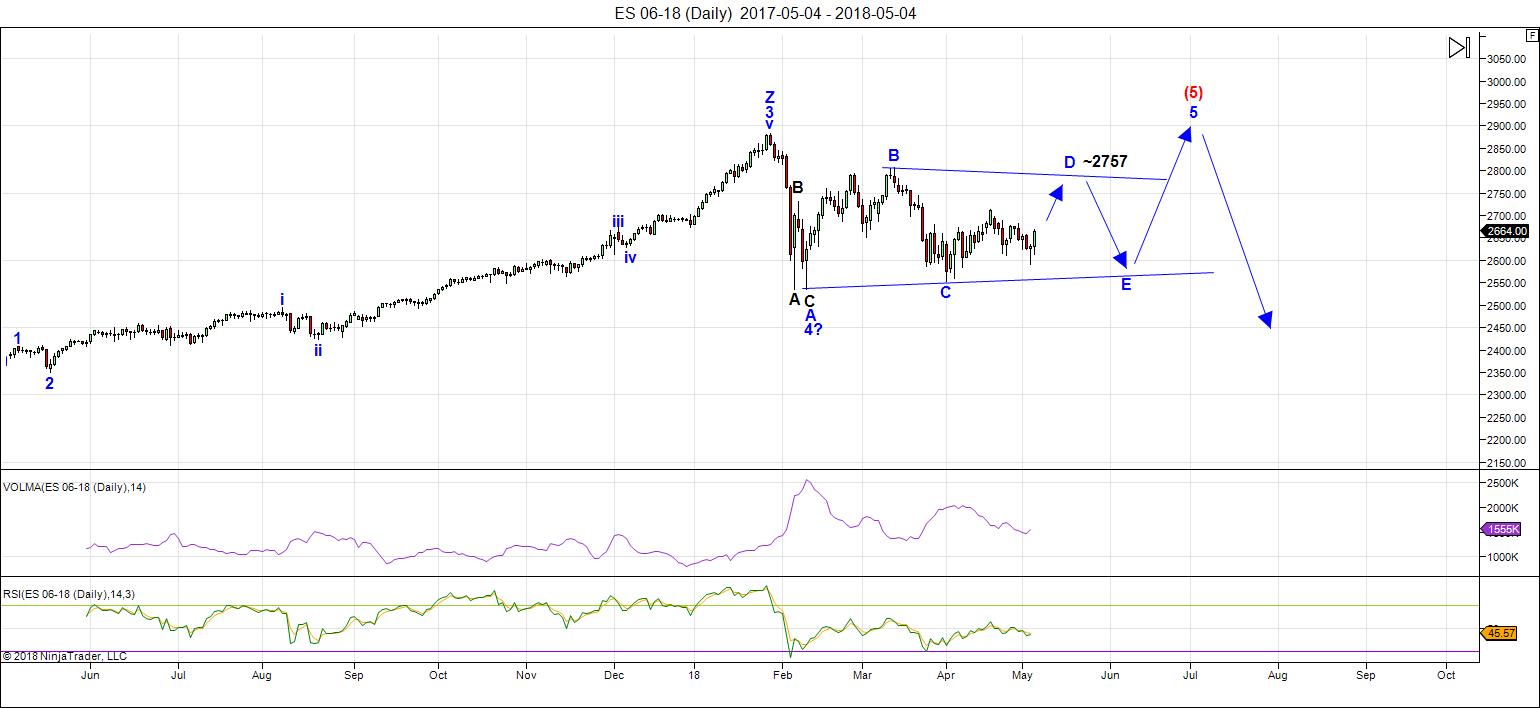
Above is the daily chart of ES (click to enlarge, as with any of my charts). No changes really in the projection. From here to the final top should be fairly straight-forward.
This past week was bearish and produced a larger B wave in the continued rally of the D leg of the contracting triangle — the final fourth wave of the trend.
The drop this week changed the target slightly — that and the fact that the length of time for this rally is changing the level at which we'll connect with the down-sloping, upper trendline. The target on the upside now looks to be in the 2750 area.
After the top of the D wave, we'll turn down into the E wave, a higher probability trade, as the completion of the D wave actually confirms the triangle. It's not until that point that we have the slopes of the upper and lower trendlines in place.
After the E wave down is complete, we'll take off again to the upside in a fifth wave, which will simply finish off the pattern. We'll get to a new high and probably more, but don't expect (as I've been saying for a very long time) a large fifth wave that travels any great distance. (I think 3000 is possible but at the high end of the probability spectrum)
Summary: We should continue up in the balance of the D leg this week. It looks like we'll have some weakness this weekend, but should turn up early in the week. Once D wave is complete, only the E leg (down) and a final fifth wave to a new high are left. That fifth wave up to a new high will be the end of the 500 year bull market.
___________________________
Trader's Gold Subscribers get a comprehensive view of the market, including hourly (and even smaller timeframes, when appropriate) on a daily basis. They also receive updates through the comments area. I provide only the daily timeframe for the free blog, as a "snapshot" of where the market currently trades and the next move on a weekly basis.
______________________________________
Sign up for: The Chart Show
Next Date: Wednesday, May 16 at 5:00 pm EST (US market time)

The Chart Show is a one hour webinar in which Peter Temple provides the Elliott Wave analysis in real time for the US market, gold, silver, oil, major USD currency pairs, and more. You won't find a more accurate or comprehensive market prediction anywhere for this price.
Get caught up on the market from an Elliott Wave perspective. You’ll also get Andy Pancholi cycle turn dates for the SP500 for the balance of the current month. There’ll be a Q&A session during and at the end of the webinar and the possibility (depending on time) of taking requests.
All registrants will receive the video playback of the webinar, so even if you miss it, you’ll be sent the full video replay within about an hour of its conclusion. For more information and to sign up, click here.


Thanks!
You’re very welcome!
Peter
Thank you for your time and efforts putting these weekend updates together .
Officially I’m on the fence and conflicted with timing ( were still in a bearish cycle until January 2019 )
Vs the wave count . Because of this conflict I must allow for a more complex pattern .
If I look at the $RUT on a general wave count basis only . It should now be in a 3 rd wave of sorts .
My gut though questions this as what will actually take place .
My bias was up from April 20 into May 7 th and we are now entering that time frame .
There is also a mixed message dealing with the June 6-9th time frame that I have not resolved .
Come August-Sept we enter the stronger bearish cycle which runs into January 2019.
My main issue with this present bearish cycle which began several months ago is that the market
Has failed to break down to any degree . The triangle formation you have been forecasting makes
Perfect sense to me yet since to me anyways we still have many months to go before this bearish cycle ends
I must give the wave count more time to prove itself .
Bottom line : the failure of the market to break down in any meaningful way by October #1 and January 2019
#2 will target astronomical higher price targets into early 2020. For these reasons I’m not going to get overly bearish
Nor overly bullish at this juncture .
Come the next main cycle turn in August-Sept I will look for a bearish set up and if it does show A decent risk reward
I’ll take a short position .
Additionally I’m seeing some overbought readings as of today .
I don’t like trading when my views are mixed so for what it’s worth
I’m standing back and leaving my money in cash .
My positions in several stocks I have kept though this decline I plan to hold .
45 % stocks 55 % cash . Speculate money will stay in cash until August .
Staying open minded for now
Joe
Thanks Joe and Peter and Verne! Your comments keep this site humming along!
It is appreciated!
I’m expecting a reversal in ES after the open and a corrective fourth wave (fourth of the third, I think). This may finally force currency pairs to top at the bottom of a correction.
The larger direction in ES/SPX is up.
For ES, the usual target would be a 38% retrace, which is at around 2650.
Yep! 🙂
Hi Peter, I am bearisch with a smile 🙂 so I think my indicators are predicting a decline form today until 16/17 may (not in a direct Line) 10th is give a LOW at the end of tradingday of S&P 500. A litlle rebound on Friday?
Then there could/would be a further decline untill 16/17 may= Lowest LOW.
Every day I get new information and I will update it.
http://www.prognoseus500.nl/
Willem,
More or less, yes. The important phrase is “not in a direct line.” That probably constitutes the remainder of the rally of the D leg of the triangle. Down today, then up for at least a couple, then down.
O.K. Peter today (8th) can be a higher high, but – I don’t expect this – then must go down with a little rebounce on wednesday in to the weekend. We can get a rebound on a pivot Low (ver Low) and then go up in to the weekend.
This is the information that my indicators are telling me. Thanks for the reply. We will see and mostly … I will learne.
http://www.prognoseus500.nl/
Hi again Peter. You’ve been closing out recent blog posts warning of the end of a 500yr bull. Do you have a column that elaborates on your VLT count? (Or, will you be posting one once we get closer?) I found one from your May 2015 post, that shows EWI’s view over 300 yrs. But per that chart, they have us ‘merely’ in a large 4th degree off the 2000 top. That’s not the same as the end of the bull market 5th that you are calling for. Is this the end of private central banking, and a transition to cryptos or some other regime? TIA!
Hi Pieter,
What’s VLT? My daily chart in the blog post is showing the top of the bull market, so I’m perhaps not sure what you’re looking for. Perhaps you can be more specific.
Cryptocurrencies are a bubble and have no future. As the entire financial system is going to collapse at some point, I don’t see a long term happy place for central bankers. I think we’ve about had it with that crazy scheme.
Sorry Peter .. VLT = very long term.
So a fifth wave on a daily chart isn’t going to be much use establishing that its the end of a centuries long pattern. When you contend that we’re at the end of a 500 YEAR bull market, that implies to me that we’re in a 5 of 5 of 5 of 5 of 5 or the like, where the largest degree five goes back at least to 1932 if not before. “Perhaps you can be more specific.” I guess I’m curious where you put 1,2,3 and 4, as each predate the SPX and several predate the Union even. And the subdivisions in this 5th wave from wherever you place the 4, if not 1932. I’ve seen a variety of VLT counts, and to be truthful, I’ve yet to find a method for validating one of them over any of the others. I do think the log form for the chart is appropriate of course, as EWI used in your 5/5/15 blog post.
Oh, OK. I have a chart somewhere in the forum posts. I can dig it up. But you’ll have to give me a day or two, as I’m quite behind at the moment. I also have a chart showing the B wave we’re currently in (which, of course, is not allowed, if you were to believe Prechter. Elliott was fine with it, but for different reasons).
Yeah, I’m trying to sort out a conflict in my mind between the idea of a B wave top soon (off the 2009 lows I presume) and The End of a 500yr Bull. I can grasp it (in EW counting terms) ending in 2000, with a B wave rally midway through a correction that manages to exceed that fifth wave 2000 high. But if that B is part of an ABC (or even something more complex), wouldn’t the next rally extend this Bull further? Wouldn’t a 500yr bull die with an impulsive decline at higher degree (a 1, and not an A?). So Ending a 500yr bull would seem to be different than correcting a 500yr bull, in terms of EW pattern expectations, no? What am I missing?
Pieter,
I will do something on this for the report on the weekend. The “orthodox” top was in 2007, then three waves down in 2008, and yes a B wave up from the bottom in 2009.
reality of the unreality………………….albeit…………..only long term………
very long term…………….alludes me
ES – https://invst.ly/7e21k
or said otherwise………using color………….ES -https://invst.ly/7e24i
“BE TOLD”!!………………… :-))
https://invst.ly/7e24i
sweet corn…………….the real taste of the southern grit…..
ES napalm in the morning……….note the neg divergence on the 60 min time frame….
https://invst.ly/7e2cc
….and closer yet….
applied is an old school pattern………………rarely spoken about in today’s modernity of programming………….. https://invst.ly/7e2d5
The measured move of the potential H&S would demolish the 200 day SMA and fully negate the triangle pattern. That is quite a call! 🙂
I would not be surprised by another tag of the 200 day but I am expecting that it will continue to provide strong support. We should know in the next 24-48 hours…
All the data I have been updating. From 2681 there must be a Hughe decline in to the weekend if I follow my indicators. Be carefull. http://www.prognoseus500.nl/
Willem,
agreed………………………. in this playchart…….NYSE……i was taken at the non EW similarities ……………with the now ………..versus 2015…….
https://invst.ly/7e2qn
is it smoked haddock??
noooooooo …………….its the DXY chart…….you all have seen many many times
let’s peek in on those projections i made at the end of 2017
https://invst.ly/7e2j8
and the long term DXY chart……..on the weekly time frame – otherwise known as
…………….”the bread of Mexico”……………………………. https://invst.ly/7e2mp
red dog…………..remember way back ….when you were just ………”red pup”….
and that bitcoin chart……………….well lines that are left untouched……..here be the update
https://invst.ly/7e2v1
Sweet – hope this crypto deal stays strong for a few years. Could be the next internet type phase, think early 80’s. We are about to launch a very cool ICO that is real. Australia’s biggest processing computer – think AI, deep learning, rendering and mining etc. Even if the crypto job falls over, this blockchain technology will be around for a long time and processing demand will go through the roof.
blockchain technology…………………is the “eye” of sauron!!!………
would you build out your own prison?? every currency transaction and asset digitized and recorded on an open ledger………………….nope………………only good could come of that!!!
are you loyal to the system?……………..no worries…………you can be with blockchain………………………
unloyal………………..need to speak some truth…………………..well ……the gate keepers will shut you out.
the original block chain was the slave trade………….and as a slave you were blocked and chained…………………..that system broke down because the collateral [human beings] could never be perfected……………you could run away or die……………..or be sold off……….
bankers loans………………..to finance the slave trade………..went unpaid…………and they could never get their hands on the underlying collateral……………………………but this could never happen under blockchain 2.0!!!!
Interesting analogy.
…………………..and for all the equity only folks……
the 10 yr T-note futures…………… https://invst.ly/7e30u
Andy Pancholi recently distributed three free videos on the state of the stock market: “S&P500 at A Critical Juncture” on May 1, 2018 https://tinyurl.com/y93jtr66 ; “Update on the S&P500 Market Pattern” on May 3, 2018 https://tinyurl.com/yctjgudc ; and “Market Pattern Video Update” on May 5, 2018 https://tinyurl.com/ybmy56h5 . In each of the videos Pancholi emphasized “Market Poised For Change…MAY 10TH +/- 2 DAYS”. When considering Pancholi’s ‘alerts’ it is important to note that for the better part of two years he repeatedly pointed to the October 2017 time frame for a major change in the stock market.
In my view, a significant deficiency in Pancholi’s timing methodology is the inability to anticipate a directional bias…’you will know it when you see it’ doesn’t cut it for me. Therefore, if you give credence to his ‘histograms’ for timing you have to look elsewhere to anticipate direction, i.e., technicals indicators and other knowledgeable stock market analysts.
rotrot………
the Central Banks ……ARE ………..the markets………….
could it be, that Pancholi is correct………………yet……………..his correctness meets head on…………with the FED????………….and their “uncorrectness”??…otherwise called rigging??
“the Central Banks ……ARE ………..the markets………….”
obviously the Central Banks are ‘banking on’ people believing that they are in control of the financial markets…2000…2007…2018…
https://tinyurl.com/yas627c2
rot,
Nomi prins new book – “COLLUSION”……with 97 pages of footnotes and source material……………………shows empirical evidence, that the CB’s have #1 colluded to paper over 137 trillion dollars of toxic assets sold by US banks before 2008, #2 have in effect ….BECOME ……the markets – with the never ending flow of subsidies and free money to banks and other financial participants….
she concludes…………that central banks……..”are the markets”……
https://www.amazon.com/Collusion-Central-Bankers-Rigged-World/dp/1568585624
“In each of the videos Pancholi emphasized “Market Poised For Change…MAY 10TH +/- 2 DAYS”.
Interesting date Rotrot.
Early February, I shared space.com’s observation regarding the 1/31/18 blue moon.
As per space.com “the total eclipse of a Blue Moon hasn’t occurred since March 31, 1866.” What happened in 1866?
As per Wikipedia (lol), “the Panic of 1866 (May 11, 1866, Friday) was an international financial downturn that accompanied the failure of Overend, Gurney and Company in London, and the corso forzoso abandonment of the silver standard in Italy.”
(https://worldcyclesinstitute.com/way-too-much-bull/comment-page-2/#comment-27471)
Liz H…thanks for the feedback…just sent you a private message in the WCI Forum…
https://dailyreckoning.com/collusion-central-bankers-rigged-world/
“…starting on Sunday 13th May in London…Banks as we knew them in the 20th century will no longer rule. It begins with a storm. A shock. A lightning bolt – just four days away…”
– JA | May 9, 2018
“9th May 2018 Special Video Update” on May 9, 2018 https://tinyurl.com/ybrbjqs9
“15 Days of Waxing Electrical Heat” – Olga Morales | May 9, 2018
https://twitter.com/AstroGann33/status/994378231410126848
“I’m sure you can feel the energy around you growing in intensity”
https://twitter.com/AstroGann33/status/994381952869253121
A tremendous amount of buying power expended today. They could only manage a dragonfly doji and a weak tag of the 50 day. The next few days indeed looking inauspicious for the bulls. We did not quite hit 2650 but a lower low and lower high nonetheless. The rest of the week should be most interesting!
its………………….WORLD WAR 3 ……….all over again!!!! markets will plunge…….
iran/china/russia – versus – US/Britain/Isreal
iran deal ………….no deal…………………….move embassy to jerusalem…..
it is very clear to me…………………Trump = ZION…………and Zion spelled backwards.
……………….is………………..”NOIZ”!!!!! …………………………..brace yourself………
and be right with the “abba father”……………!………..cough………………..sniff……sob..!
We’re at the 21st century “Waterloo.” It’s all about “Money, Money, Money.” “Fernando” should be sending out a “S.O.S.” Oh “Mamma Mia!”
Just trying to get onside with the abba father …
…………………young man, you are ………….WELL…….. going over my KNEE!!
its called a whoppin!!………………….abba father LOVES you…….which is why i have to ………………BEAT………….you senseless!!!
pure musical blasphemy that is!!!……………………..”BE TOLD”!!! :-))
My next turning point is May 15, we should top there,
Everyone is quite convinced that the triangle has completed and a new impulse up underway. I think Peter is correct in calling this just the continuation of a final wave up of D. I seriously doubt Mr. Market is going to allow them to enjoy the ride until the 15. RUT is now pinned against its upper B band and prior visits to that area have generally resulted in a substantial retreat. I expect it will not do so alone…
If Willem is correct about a strong decline into the week-end D up will have to complete the next day or two…we will see…
in my new morning series…………..called
“NAPALM IN THE MORNING”………….
i take you through the intricacies of preparing the chef inspired breakfast eggs ….5000 different ways…………..note to readers…………pre buy ………..NUTMEG! whole nuts.
…………………..and if there is time………………a post of the overnight ES.
ES 5 min time frame…………………https://invst.ly/7euug
ES 60 min……………………….https://invst.ly/7euza
and a quick programming note……………………………”NAMASTE”………i am being told by my producer………………..it is ……………NAMASTE IN THE MORNING……….
apparently …….”.NAPALM IN THE MORNING”……… is the name of a new hair gel by Fructis Garnier…………..trademarked and registerd…………………wow!!!
RUT looks to me to be in an ascending bullish triangle which would issue in an upward break-out. It does appear to me to be not quite done. Andy’s forecast cannot look back two days as we were already in a short term uptrend and that would hardly qualify as an inflection point. This leaves today, tomorrow or Monday for the market to turn down and confirm, or negate his claim regarding today, plus two days, being critical market inflection points. To be quite honest, I find actually looking at real time price action to be much more useful.
I have yet to discover and reliable consistency in pronouncements from various and sundry prognosticators about what Mr. Market will or will not do. At least with EW one can objectively look at a proposed count and conclude whether or not one agrees with it.
Another label for “an ascending bullish triangle” would be an ending diagonal. Technically, it’s a little early to call it, but that’s most likely what it is.
Aha! We know how those end not don’t we?! Thanks for the tip Peter! 🙂
To complete the picture, the DOW is in an impulsive 5 waves up, the 2000 is in a contracting triangle, as is SPX, and the Nasdaq will likely do an ending diagonal, but it’s a little early to call that one.
Throwing timing out the window .
The $RUT to me is/was the cleanest triangle formation
Which as noted prior in this thread looked like a 3 rd wave
That leaves wave 3 to peak then waves 4 and 5.
The Dow can go above 25,800 ( the Feb highs ) and be
Considered as a “B” wave .
No comment on spx or nasdaq .
One thing I have learned over the years is
That a failed triangle ( a break down instead of up )
Gets ugly when everyone realizes they were wrong .
Watch the apex .
Also what I’ve learned from the late George Lindsay’s work .
I’ll paraphrase: beware of a breakout following a triangle
That lasted 11 months.
In short : my view is I do not trust this present triangle
Despite its validity .
Staying open minded for the remainder of this year
And keeping a bearish bias yet…..a failure to break down in
Any meaningful way by Oct as well as January will in my view
Project much higher prices .
The $RUT has its most important support at its April/ May lows.
This present move up can be labeled 123 with 4 5 to go.
Which could also be just a larger wave ( 1 ) or the market is about
Done.
Not going to predict that at this point .
Russel 2000 rebalance announcement should be soon.
According to 1 person RDVT will be toast .
https://www.google.com/amp/s/seekingalpha.com/amp/article/4172238-red-violet-spin-0_00-possible-russell-2000-mistake-questionable-management
It is somewhat amusing that after all kinds of permutations about what kind of structure may be unfolding in SPX, quite a few analysts are finally converging on the pattern that Peter T has had up for a number of weeks now. lol!
Welcome aboard you stragglers…! 🙂
Verne
I’d rather see everyone Not agree .
Those damn bankers 🙂
Haha! The problem is that eventually what is happening becomes so obvious that folk have no choice, but that is what separates the men from the boys is it not?
(My apologies ladies) 🙂
$RUT
the B wave high back on march 13 at 1609.05 has been broken.
this Detail leaves 2 choices . the triangle has already completed and
new highs due shortly ( as already posted ))
OR
this is a B wave .
A triangle thrust targets the 1700 area which is 100 points further
which i tend to doubt .
support at the may 1 low is key and must hold >1527.71 by my data.
this cannot be a wave D of a contracting triangle because wave
B has been broken . ( TALKING $RUT ONLY ! )
getting back into work mode .
have a great weekend everyone
$RUT should extend higher in this 3rd wave ideally on a daily chart .
the 2.2 extension sits at 1615 YET 1622-1639 would be a better 3 rd
wave objective if that is what we are seeing.
REGARDLESS: WE have waves 1 2 3 in place . a wave 4 and 5 is needed
at new all time highs to complete the structure .
my view anyways .
my summary of the broader market using all of the index”s combined .
we are in a ” B ” wave triangle which will have a BEARISH OUTCOME.
wave( A ) was the FEB LOWS
since these lows we have been going sideways .
minor wave a was the late feb high , wave b the early march low
this present rally being wave C of a further developing waves D and E.
wave E should therefor be a high and the starting point of the next DECLINE.
OR
this is a ( B ) wave rally .
giving the market more time to prove itself ( ALL INDEX’S COMBINED )
WEEKLY CHART
THE B WAVE
https://imgur.com/Vt81aBt
looks like we have a bit of time before taking any aggressive bearish trades .
late may into june 9 is a window for a high yet aug_sept will be more important
for the start point of a larger decline .
bottom line staying hedged
SPX
ill say its stuck in a range : 2758-2773 in wave C of a bearish triangle .
2594 would have to be broken in wave D . wave E would surround the .618
at 2707-2742 then comes the breakdown in wave C .
Bottom line : MORE SIDEWAYS WITH A BEARISH OUTCOME.
WE WILL SEE SOON.
SORRY FOR CAPS BUT KEY BOARD STUCK
Interesting. It is now looking like SPX completed its c of D wave up. If correct, although it also looks like we only completed the four of the C wave, we should go a bit higher and get our final E wave down of the triangle sometime next week.
Correct. Not quite done the D wave.
Joe,
Thank You for your intriguing perspective on the market. I appreciate you updating your unique “broader market index” which uses all the indices. I hope you will keep us updated on how that continues to unfold.
I think we have a seminal week ahead. I will be loading the BIG CANONS.
I am going to need a sound battle plan and an excellent bird’s view road map.
Time for a visit to the chart show…turbulence ahead…!
Well, my trading account is up 80% in the thirty trading days … and planning on doubling it (again) in the next wave down (ES along with a currency perhaps). So this Chart Show should be another good one.
I also had an excellent trade on 100 contracts from a bearish SPY 265/266 bear call spread. I was able to actually get the 266 calls at zero cost basis by buying back the 265 short calls on the b wave down of D and then sell the 266 long calls tfor 5.75 on Thursday. I sold a bit too early but not complaining. Nice trade!
I want to trade the E wave down with another bear call spread but this time with 200 contracts so I really need to get the timing exactly right and choose the short calls at the exact or very close to the top of D for the trade to give the maximum return by letting me get positioned for the end of E down. Spreads are great for trading triangle legs! I am hoping your fib ruler gives a good upside target for executing the spread. I don’t think SPX will go past 2750 but sure won’t want to get stopped out of that many contracts….ouch! 🙂
Verne – How far do you go out with bear call spreads. So are you planning to do the same get spy bear call spread for june like 269/270, you will probably get it for very cheap. One problem with SPY is there are dividends and expiry. You can replace it with SPX trades.
Peter – In past you said on a 5 year horizon home prices will fall 80 percents. So a 500k house in texas below or at 100k, how do you justify that with current salary avg salary in my area is 130k. Are you expecting dollar and currency mishaps. Any road maps and thoughts. Point me to post if you have talked about it ealier. Thanks for sharing and helping us.
Hi Bill.
Ordinarily I like to go out at least thirty days when making option trades. With triangles I tend to keep expiration a bit tighter, about two weeks. A lot of traders complain about triangles but once the first two or three potential legs are in, you have a pretty good idea of price point and duration of the remaining legs. I opened the spread on April 27 which as it turns out was the middle of the small b leg down of the middle wave, and bought back half the short calls on May first as soon as I was at break even, and the remaining half the following day which actually meant a small profit on the short calls. I was essentially paid to open a long SPY 266 call position with this strategy. Option traders do not have to be concerned about dividend payments. That applies only if you have actually shorted shares of the ETF. As to trading wave E down, I expect D to complete around 273 so I will probably use the 273/275 bear call credit spread with March 25 expiration. It is possible that E could form a complex wave as all the others appear to be simple zig zags so its duration could be an issue. E waves tend to complete swiftly and often fall short of the A/C trend-line so I think it should be done by expiration. The idea would then of course be to ride the 275 calls up in the final fifth wave, rolling them out if needed depending on how hight the fifth wave continues. Peter has already cautioned us to not expect it to be an extended affair. The idea of holding the short calls only for as long as it takes to get positioned as close to zero cost basis as possibly will be particularly important for the E wave as they often end abruptly. Some traders get greedy and forget the aim of the strategy is to make the real gains on the price reversal. For the more conservative trader, completion of triangles offer one of the most explosive trading opportunities there is, so I will be looking to add to my long calls the moment the triangle’s completion is confirmed. This would be a good week to attend the chart show as I am sure Peter will be able to more precisely pin point price points for a turn and give some insight about duration of the remaining leg.
Thanks Verne. I think biggest pitfall to this 273/275 bear call spread is you dont exit if the market rockets up to say 280. where do you exit is biggest problem. I hate bear call spread because of emotion/hope and greed which plays with your mind.
Instead a put spread and then a call spread is better, reason being I am surely going to be deer in headlight when it goes up to 280, by default inaction will lead to loss but will be only what i paid. this are just my thought…. thanks for giving a opportunity to have a good discusion
Bill spreads are no different than any other kind of trade. There should be a number that says you are wrong, namely your stop loss.
The nice thing about credit spreads is your risk is limited, and for a two point spread that is 200 per contract. If price moved past my stop if 274.50, I simply exit the short 273. calls for a small loss and hold the 275 calls for additional gains. One coud also hedge the trade with a bull put spread if confident of an eventual reversal. In this case if price negated the triangle, which can and does happen, clearly the sttategy would have to change.
https://mmacycles.com/index.php?route=blog/article&category_id=1&article_id=198
Looking ahead, shorter-term, we note that Mars will begin its 4-month square aspect to Uranus, May 18-September 18, and Jupiter will make its second passage of a waning trine to Neptune on May 25, with the third and final one occurring August 19. These two aspects are contradictory in their themes, just like Uranus in Taurus, and suggests a very wild time of opposite forces affecting world events and hence financial markets for the next 4 months. Jupiter in aspect with Neptune seeks peace. This combination is given towards expressing grandiose ideals for the future of the planet. But then the Mars square Uranus is a reminder that the world is still far from safe, and not all people will be expressing grandiose ideals, but instead acting very irrational and erratic, oftentimes contradicting their words via their behaviors, i.e. “I stand for peace, but we need to fight a war to achieve it.” Psychopathic rage leading to violence is one possibility of expression during the Mars/Uranus aspect, so it would be wise to avoid dangerous situations and people if you are able to sense them before they erupt.
Market-wise, Jupiter and Neptune tend to correlate with rising stock markets amidst irrational exuberance. However, Mars/Uranus symbolizes sudden disruptions and sharp reversals in financial markets. We may see an example of this between this week and the end of the month, for both of these geocosmic signatures will occur (May 18 and May 25).
(Note: my post above in regards to the last week of May .)
Waning Crescent Moon
The moon is currently in Aries
The moon is 26 days old
Distance: 59 earth radii
Ecliptic latitude: -4 degrees
Ecliptic longitude: 12 degrees
It is possible to actually see two triangles, with the smaller one having completed an E wave at the last low. The larger triangle pattern with the last low being seen as a b wave of D is also legit, in which case you would expect the a wave of the zig zag to be exceeded by the c wave of D, which is9 currently unfolding. If that viewv is incorrect, and the next move down turns out to be a second wave, I suspect it will bounce hard off the 50 day.
A new weekend blog post is live at: https://worldcyclesinstitute.com/the-500-year-market-top/
This website is for educational purposes relating to Elliott Wave, natural cycles, and the Quantum Revolution (Great Awakening). I welcome questions or comments about any of these subjects. Due to a heavy schedule, I may not have the time to answer questions that relate to my area of expertise.
I reserve the right to remove any comment that is deemed negative, is unhelpful, or off-topic. Such comments may be removed.
Want to comment? You need to be logged in to comment. You can register here.