

Looking for the Trigger
Look no further than the US Dollar.
I’ve been maintaining for the last couple of years that once the US Dollar found its low (it’s in a large fourth wave—a corrective wave), that it would mark the top of the US market.
As per my graphic above, it seems like this bull market will never end, but we’re extremely close and it could fall over any time.
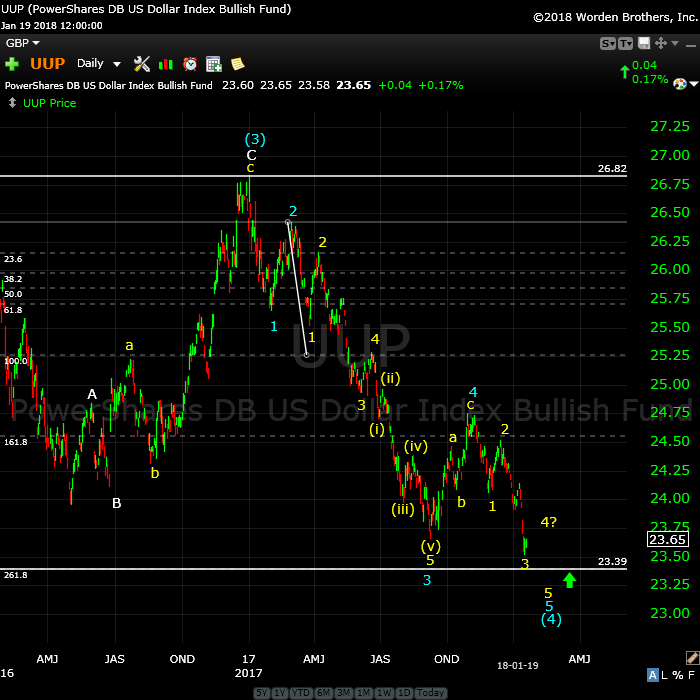
Above is the daily chart of UUP (US Dollar ETF). UUP is representative of the structure of DXY (the US index) and will provide an excellent predictor of the impending top in currency pairs and the US indices.
On Friday, the US Dollar began to trace out what looks like a small fourth wave. I’m looking for a bit more upside on this before it drops to my target of 23.40, or so. This target represents a measurement of the length of blue wave one near the top of the chart and extending it 2.618 times that length. It’s a likely stopping point for this blue wave (4).
The turn up will eventually lead to a new high. The dollar will turn with the euro, which is at a new high, and very close to my long term target.
Now, with the US dollar at the obvious end of a fifth wave of a corrective fourth wave (blue circle 4 on the chart), for those who think there’s another wave 4 and 5 to go, where is it they expect the dollar to go? You only get 5 waves before a trend change. The counts are all in the fifth waves.
The movement of the dollar strongly influences the movement of just about everything else, so it’s important to pay attention to what it’s doing on a large scale.
___________________________
DAX is now virtually at a new high (a potential double top). AAPL is at the top of a small ending diagonal, at the top of a fifth wave. EURUSD and GBPUSD are extremely close to my long-term targets, the 38%, 4th wave retrace level. AUDUSD and USDCAD appear to have turned (with first waves arguably already in place). Oil is topping, or has topped already. Gold and silver are heading down with USDJPY. The VIX has also foreshadowing trouble on the horizon. We’re all set—we just need the trigger.
Note that TSLA (yes, Mr. Musk’s baby, below) is sitting right at the 62% retrace level (352.60) after a corrective 3 waves up. Look for a turn down here, as I’ve been predicting. This highly speculative house of cards is foreshadowing our upcoming major bear market.
In summary, everything is at an inflection point, or very close to a turn, but a little more patience is warranted.
Bitcoin: here’s my take.
All The Same Market
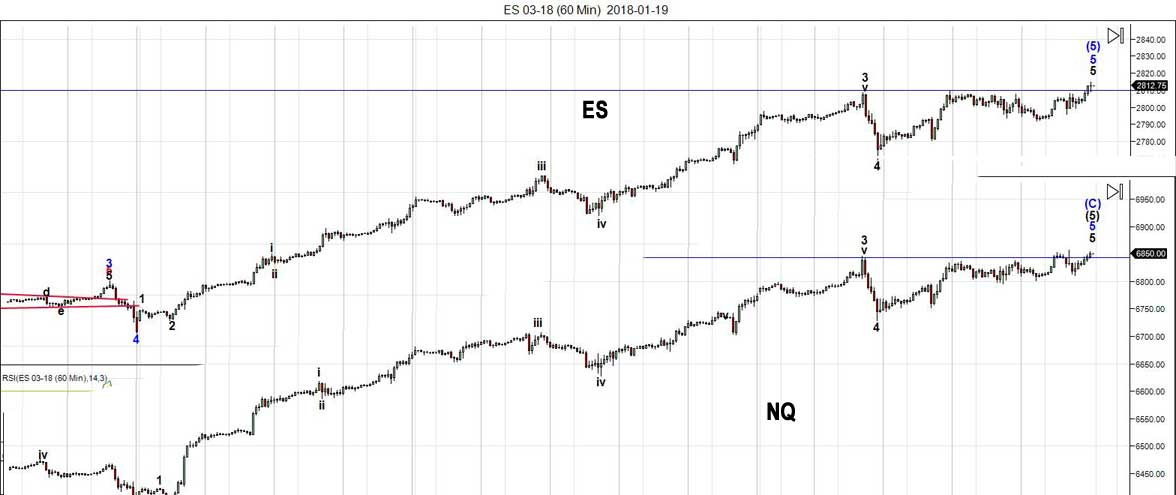
Above is the hourly chart of NQ (Nasdaq emini futures) superimposed over the same timeframe chart of ES (SP500 emini futures). For over a year, I’ve been talking about all assets classes moving more and more as one as we strive to reach the final high.
Here’s an example of how tightly aligned the two major exchanges that constitute the US equities market actually are. This is the first time I’ve seen the Nasdaq and SP500 move in absolute lock-step. We’re seeing the final stages of this rally, as all assets move to a final high.
To a lesser degree, you can find the same phenomenon across all major asset classes. There’s a very small gap now between their ultimate targets and present positions … right across the board.
The vigil continues.
______________________________
Tesla at the Target
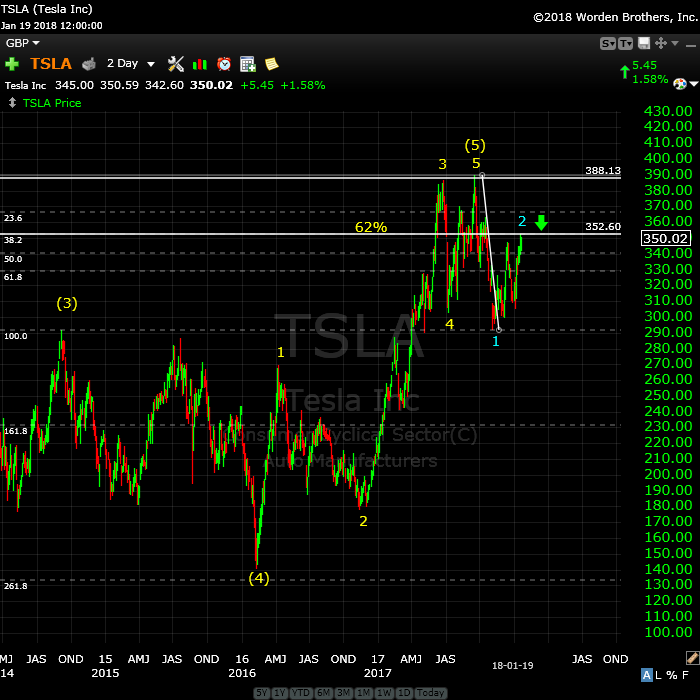
Above is the 2 day chart of Tesla.
Tesla sits at the 62% retrace target as we wait for the turn. Blue wave 2 is corrective and we’ve completed a double top. The next move should be down.
Last week, I suggested we’d head up in a “double-pronged” second wave, which is exactly what we’ve done. We’re getting ready for a turn down into a third wave.
__________________________
Changes to the Free Blog
This weekend, I rebuilt the site, replacing all the WordPress core files in an attempt to quash the free blog. After spending almost all night at it, it doesn’t seem to have had an affect. I will therefore move forward to requiring all commenters to log in, starting sometime early this week (it will take some time to get this up).
This will provide much more control over transient bloggers and protect all names and email addresses. It will also mean that once you’re logged in, you can comment at will, without having to include your name and email each time. I should have this in place in the early part of this week.
Registration for Commenting
Want to comment? You need to be logged in to comment. You can register here.
If you register, it protects your information. It also allows you to comment without filling in your information each time. Once you’re registered, simply go to the home page and click on the login link top right in order to log yourself in. Usually, you’ll be logged in for several days before needing to be logged in again.
______________________________
Problem receiving blog comment emails? Try whitelisting the address. More info.
______________________________
Have not had a losing week RW 2
Have not had a losing week …I have been with Peter almost a year. The only thing that matters is have I made money with his service. I think I have finally turned the corner using Peter’s EW. I have not had a losing week in the last 5 months. Thanks Peter, for your amazing amount of hard work. —RW |
Rise above the rest … SM 2
Rise above the rest …I have only ever met a few people who, in their chosen fields (astrology, medicine, music, martial arts, technical analysis), rise above all the rest and you are one of them…you have ‘the gift’…and that’s why I’m a Trader’s Gold member. —SM |
The best of them JL 2
The best of them …Last couple of years, I subscribed to several ‘market traders’. You are by far the best of them and the personal contact is awesome. Daily and daily updates are very well written! Besides your expertise in EW, I also like your cycles analysis. Best investment I ever made! —JL |
Get an upper hand … JC 2
Get an upper hand in trading …Seeing all the different currency pairs and the wave structures and hearing you explain why this has to do that on a nightly bases gives one a upper hand when trading. Elliott Wave applies to all stock and indices and can be applied to any candlestick chart. If someone ask what you want for Christmas – Tell them a membership to Peter’s “Traders Gold!”—JC |
Tops in your field DZ 2
Tops in your field …You are tops in your field. Tried to follow Elliot Wave international for years. They were always behind the market. After discovering you, I perceive that you are an expert in reading the waves, which puts you way ahead of the rest of your peers. And you can read the Waves like you are reading tomorrow’s financial section. I pray you stay healthy. —DZ |
A true expert in Elliott Wave FL 2
A true expert in Elliott Wave …You are a true expert in EW analysis. What you provide is not available anywhere and is priceless. Subscription on your services is the best thing I have ever done. Many thanks for your effort to make me a better investor. I now have more trust in my investment decisions. I hope you will continue the excellent work! —FL |
Couldn’t be happier … KK 2
Couldn’t be happier …The analysis and insight you provide is simply amazing! I’ve been trading the futures and equity markets for well over thirty years and usually average around 5% monthly. Since joining your Traders Gold Service two months ago, that number has better than doubled. I couldn’t be happier.—KK |
the real deal SM 2
The real deal …‘Educational, insightful and thorough market analysis for all levels of traders. It’s Elliott Wave at its best….Peter Temple is the real deal’ —SM |
The Market This Week
Here's the latest daily chart of ES (emini futures)
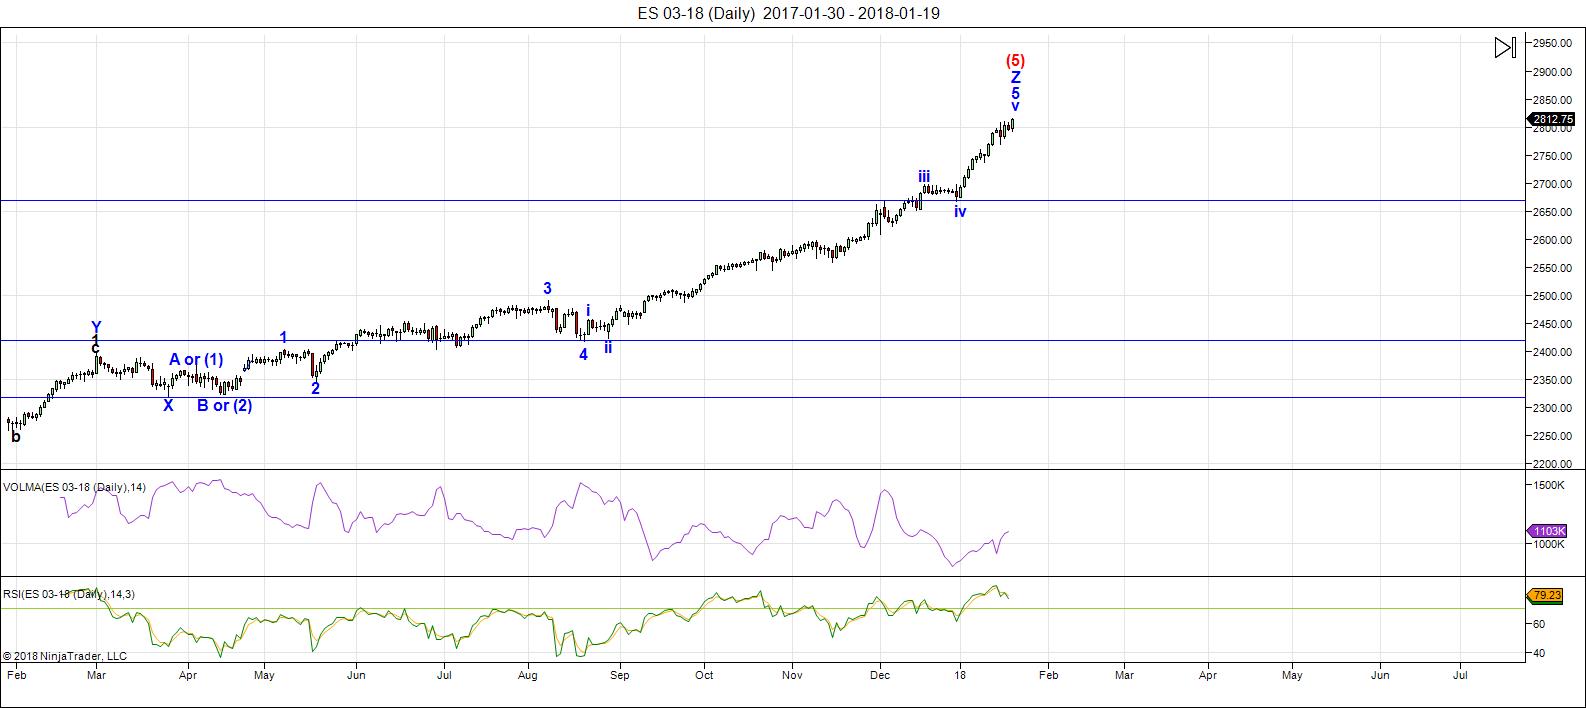
Above is the daily chart of ES (click to enlarge, as with any of my charts).
There have been no material changes to my prognosis. We are at the high. I expect this final wave to turn down imminently. But, we may end up with a double top, so the first turn might not be the final one.
Another frustrating week as the US Dollar tries to find its bottom. As a result, virtually everything has inched a little bit higher in yet another subwave of the 5th wave.
Bearish financial advisors dropped to 12.7% this past week, the lowest level in 31 years. In other words, the bulk of them have given up and decided to go long—a perfect scenario for a turn. "Everybody's in!"
We're ultimately looking for an impulsive wave down in the US indices (and a double top beforehand would be a very nice predictor). Again, we may get a double top so the first move down will be important to watch for clues as to whether it's permanent, or not.
There will be tons of time to react; after all, this bear market will last years. So, while I expect the US market to start down this week, I would not be at all surprised to see a test of the final highs before heading down in earnest.
Volume: It's dismal. Its the purple line, the top indicator at the bottom of the chart.
Summary: The count is full for the US market in general, except for small subwaves that form the balance of a motive set of waves in SPX and some other major US indices. We're watching for a turn, which will change the trend and end the 500 year bull market.
___________________________
Trader's Gold Subscribers get a comprehensive view of the market, including hourly (and even smaller timeframes, when appropriate) on a daily basis. They also receive updates through the comments area. I provide only the daily timeframe for the free blog, as a "snapshot" of where the market currently trades and the next move on a weekly basis.
______________________________________
Sign up for: The Chart Show
Next Date: Thursday, February 1 at 1:00 pm EST (US market time)

The Chart Show is a one hour webinar in which Peter Temple provides the Elliott Wave analysis in real time for the US market, gold, silver, oil, major USD currency pairs, and more. You won't find a more accurate or comprehensive market prediction anywhere for this price.
Get caught up on the market from an Elliott Wave perspective. You’ll also get Andy Pancholi cycle turn dates for the SP500 for the balance of the current month. There’ll be a Q&A session during and at the end of the webinar and the possibility (depending on time) of taking requests.
All registrants will receive the video playback of the webinar, so even if you miss it, you’ll be sent the full video replay within about an hour of its conclusion. For more information and to sign up, click here.


im watching the 1055 pst timeline.
ill give it 10 minutes and ill be looking at the .618 retrace
and using oex as my guide. if it sets up ill take a short position
and ill admit the wave count is a bit sloppy
No MACD bullish crossover in UUP as yet. Looks like a bit more downside…
DJT put in a bearish engulfing candle six sessions ago! Maket hanging tough.
Peter,
Do I remember correctly, that you said in the EW book(Frost & Prechter) that the portion on “Leading diagonals” is incorrect because they do not exist?
There is no known example in captivity.
🙂
haha! Thx..
in and out
\next time line 1120, ill give this another try
by by , is this wave 3 down ?
out of timelines at 1150 , maybe one more attempt
yet this is now the moment of truth .
24 hour chart on dow futures is now into its 7 wave with in a
narrowing wedge
Peter G,
Concerning your from last week…What if you used a “close only” line chart? Your bottom trend line would be drawn using the November 2016 low and the August 2017 low! Then draw a parallel upper trend line with the beginning point being the July 2016 closing high! Does that change things enough to still be operating in the channel you visualize?
Another overnight with no impulsive futures decline and I will be revising my wave count. If that happens we are going higher imho, as the only way to interpret the price action would be an ongoing remarkable wave extension.
Scaling out of a portion of some of my long term holdings this week for risk management. Some of my positions have increased so much that they are not weighted properly now. Still very long and continue to adjust stops based on my system. No predictions on the future – just following my price based system. One trade I am thinking about taking soon is shorting TSLA although it is not a short yet based on my system. It is just a fraudulent company that is way overpriced.
I agree. Along with NFLX and GE, they are all eventually going to zero, for that is exactly what they are worth.
Peter G,
Previous post should read… concerning your “chart” from last week…
We closed above that yesterday, Ed, albeit not by much, and today we are right on it as I snapped the chart pic… I am looking at a log-based chart and channel whose parameters are still interesting and we are close to. If we hit it, I will try to post it…no promises…One more channel of great interest because the entity has been so strong. Daily a-d line NYSE… October ’11 low through Feb ’16 low paralleled to the July ’14 high. At yesterday’s close the a-d was around 1,000 units below the line. There are different quote services with different a-d quoted every day. I use the official numbers from the WSJ for my a-d line… Here’s the pic of the closing price channel https://imgur.com/a/Y5GXg
Today was incredible
just about every time line hit ( the ones i posted definitely did ?)
24 hour futures are now in wave 9 .
a failure to make a new low argues a completed corrective move.
A B C X A B C D and now in wave E.
I have no timelines to go by .
Flat with no trades from no to the close
see you tomorrow 🙂
Verne
you like triangles
this is what i have been watching all day .
YM 5 minute 24 hour chart .
we should know either in the overnight or tomorrow
yet there is now 9 waves .
i have one issue with this yet 9 waves are rare so
either a break up or break down most likely in the overnight session
id like to see a poke below 26183 and maybe a hit on the 26178 level
yet if it breaks below 26172 then lower prices .
leaving it as a bullish count for now
https://imgur.com/Q5Vogb8
There is in my opinion a 90% chance the break from this sideways triangular movement will ultimately be to the upside. That has been the pattern now for a very long time as the market has marched ever higher. I doubt this will change until we see that breath-taking initial impulse down…
GE recovering from a triple digit trade to a low of 15.80 yesterday. We will get a few days march toward the upper B band before another short opportunity sets up. This is the most amazingly reliable short trade set-up in the market. 🙂
we should know which way the market will break soon enough
there is no more swings left to be had .
id still like to see a re test though of the 26183 level
before a turn higher if that is what is going on .
breaking 26172 is not a good sign in my opinion .
a sell off from here into the close would not surprise me at all.
then its all about the overnight session regardless
I just got done re-listening to James Flanagan’s video and his take is that there is no chance of a crash in this market as its “DNA” resembles only one other period in market history and that was back in the 1950s which saw a similar period of a sustained un-interrupted advance. It is truly stunning that the only thing he seems to take into consideration in issuing this prediction is the similarity of the duration, and size of the price advance. He is confident that that cycle history will vindicate his call, and that at the worst we will see only a mild correction with much more to go in the bull run. I do think he is correct in calling an upcoming end to the decades old bond bull market with interest rates going higher. Fascinating!
done for the day
ill let the market decide on how it closes .
decent day overall for me .
The long term MACD on the SPX is in the stratosphere on all time frames – daily, weekly, monthly. This is a parabolic market that has rarely been seen. Will it end? Of course it will. But no one knows when and how. Shorting into this has been a losing trade for a long time and all top predictions have been dead wrong for a long time. If you haven’t been long, best to trade other markets and wait. The huge problem with trying to short a market like this is it could have a quick 10% correction and still not violate the long term uptrend which could trap bears even again. Have to look at big picture and price and quit relying on “predictive” tools. To break this trend, the market would have to trade several hundred points lower. Anything is possible from here on out. We are in unchartered waters.
Yep. This market could see a correction all the way to the 200 day MA and STILL be in an unbroken uptrend. A drop of that magnitude though, will certainly end the bull market because of the incredible leverage now existing in the market and the short vol trade. In fact, I would argue that as little as a 5% decline is going to cause this market to unravel in ways that that kind of correction would not ordinarily trigger. In that sense we certainly are in uncharted waters. What is NOT uncharted is the inevitable outcome of this level of bullishness on the part of market participants, as well as this length of time and distance trading beyond moving averages. I agree that while we do know that the market WILL regress, it is manifest that trying to predict WHEN has been entirely an exercise in futility. 🙂
Wow! Jody every trader has been there my friend.
I lost a lot of money thinking that Bob Prechter and EWI were infallible.
That is a lesson you should only have to learn once. Making trades based on anything other than one’s own personal, very careful due diligence is a recipe for disaster.
The most basic rule for staying in the trading game is limiting your risk.
It is truly stunning how few traders pay attention to this.
Stop losses are essential.
Position sizing is essential.
One of the best pieces of advice I was ever given about trading is that the focus should never be on how much you can profit in a trade, but how much you could loose!
Lastly, I have made it a rule to be able to walk away from every trade I make with a 100% loss and still live to fight another day. This should always be the case if you are exposing no more than 3% of you account with each trade.
Please don’t despair. Where there is life there is hope…always!
Careful of Trolls there Verne
Emily,
In the user area of the site (when you click on edit my profile, there’s a place there to select the public display name. You had your whole name selected. I just changed it to Emily.
I can delete these if you like and you can re-enter. Let me know.
I changed the ‘e’ to a capital.
am looking @ the VIX’en FAMILIA also — but $VVIX is MY NUMERO UNO — see IF it dips to the low 70’s or hits its March 2017 – 52wk Low of 71.75 … then you damn well go short the markets.
also looked @ $BPSPX closed UP .80 @ 82.60 … also noted earlier today that on May **22**, 2013 — THE high was @ 90.20 .. which you never know IF this market has more legs — MIGHT see the 90s.
https://twitter.com/BUDDIEE18/status/955866281609056256
I don’t know why your comments are going to moderation, though. (sigh … the technology). I have yet another company looking at the “bug” so maybe it’s part and parcel of the same thing.
ha ha… maybe so that I can delete..if change of heart/mind ? it if that’s possible ? 😉
thanks for changing my name to just 1st name, Peter 🙂
Hmmm. Now you’re not going to moderation, all of a sudden. The deleting part will lead to negotiation, and I don’t have the Donald’s book, so I should be ok.
🙂
I’m not the big on strings of superlatives.
lol.. ok 🙂
the only thing/s that stood out for me today — were the 3 amigos $FVX $TNX $TYX and waited eod for $SKEW/X (Canadian version w/ an “x’) & of course $VVIX.
I know most of you look @ EW — I kind of wing it — look at the moon phases to numerology to basic T/A — see if RSI is at > 50 or CCI is >100 , etc etc
read some where they think 10-20% downdraft coming. I only see about 3% and that’s either Valentine’s Day area &/GANN New Year Day – March 21, 2018 area.
but then there’s that month of July
Moon Phases — the LUNAR is B4 the SOLARs this year — so they not as damaging — words right now escape me what I’m trying to say. lol
want to put as much info on one post instead of different posts.
on another note :: am waiting for Twitter to reinstate my last 2 twitter accounts so I can lock 3 of them — but they sneaky — have like 20/18 PHANTOM followers on the buddiee18 one. ticks me off to no end. lol so am insulting them. am NOT into political correctness bs.
& on another note — some of you must have heard of him/his site ? am using “Search Twitter” w/one of my accounts to see some tweets of mine — came across this one :: http://www.timingsolution.com/TS/Articles/optimistic_sentiments/index.htm
The 17.6 Year Stock Market Cycle in June/July issue of MoneyMaker Magazine, p.96-97. http://issuu.com/moneymakermagazine/docs/junjul2013?mode=window&backgroundColor=%23222222 … … … … …
don’t know — but methinks all hell will break loose & heads will roll @ the FBI DOJ . been following Judicial Watch & The Pundit …so am thinking Valentine’s Day (Massacre) or Ides of March — March 21, 2018 (GANN) we might have that 3% dip in the marketplace ? seems the elites TIME their events w/numerology & moon phases — not kidding you .
BREAKING***- VIDEO: House Homeland Security Chairman Rep. Johnson Confirms True Pundit Intel Exposing FBI “Secret Society”
https://twitter.com/Thomas1774Paine/status/955961040243707905
ok.. enuf of my posting. g’night all
emily,
methinks we should adopt a nomenclature that is more accurate than this title word………’elite’……………………… to lie, steal, cheat, hide, and kill life [both human and non human]…………….without remorse……………. describes a “degenerate” rather than an elite………….. [degenerate + elite = delite]………
*******************************************************************
e·lite
əˈlēt,āˈlēt/
noun
noun: elite; plural noun: elites
1. a select part of a group that is superior to the rest in terms of ability or qualities.
… or in this case, money …
I have to figure out why your comments are going to moderation, luri, but I likely won’t get time to work on that during the day today.
UUP at 23.36 in pre market.
About 3-4 cents away from my target …
23.3 so were in range
We’ve exceeded the target, which is fine. I’m expecting a turn.
https://invst.ly/6fhry
DXY update……. wake up people’s……we haveth …..”work”……….to do!
the sun riseth, and the wind bloweth…………..”BE WARNED”!!!
Stelios is a business associate of Dale Pinkert’s and an exceptional currency trader…
https://twitter.com/bbki2611/status/956135710377086977
https://www.cnbc.com/2018/01/24/a-weaker-dollar-is-good-for-the-us-treasury-secretary-mnuchin-says.html
Yeah, that helps. Like it when it hits the news.
🙂
thought I’d pass this site out b4 the regular markets open. got this from my OSS newsletter.
it’s quite interesting re watching the “news” people…and following their lead. just turn off the tv & just watch the price action & know your fibonacci levels.
month of February prediction is quite interesting (for me). gather no Valentine’s “massacre” lol.
anyhow — enjoy & GL trading today.
Mahendra’s 2018 Financial Predictions
https://www.mahendraprophecy.com/latest-news.php?id=1172
Another change of mind from Dr. Fraud.
It is nothing short of stunning to see what is going on in the world of prognosticators. I watched a video by James Flanagan last night who is now convinced that the current bull market most closely resembles the one from 1956 to 1959 and confidently asserts there is no chance of a significant market decline, and that the bull market will continue for some time yet. Several prior predictions based on the same kind of cycle reasoning and comparisons failed spectacularly last year, but I suppose we can be confident that the current comparison will hold true. Now Mehendra is telling us that the stars have suddenly gone from displaying bearish portents to being full bore bullish and that SPX 3200 is now clearly written in the stars. I have always tried to maintain an open mind when it comes to the approach others take to the markets, but it seems to me that there comes a point when one has to begin to view pronouncements of this kind with deep skepticism. If fact some of the talk I have hearing and reading in my view borders in sheer insanity. The statements people are making seem strangely divorced from any kind of reality, and I find myself wondering if we are all talking about the same market.
Setting aside the current market extremes for the moment, the key consideration I think in all this is that the current market advance is based primarily on a fantastic mountain of debt that ultimately cannot be sustained, and which will never be repaid. Most of that debt will face deflationary destruction, and since most of it is dollar-denominated, this is bullish for the dollar. When dollar denominated debt is destroyed, in reduces the amount of available dollars, the dollar therefore becomes more valuable, simple.
Interest rates are completing a decades old cycle and will be rising into the fore-seeable future. FED or no FED, Contrary to popular belief, the follow the market, they don’t lead it. Rising interest rates is injurious to the bond market. The bond defaults will run into the hundreds of billions as rates rise and debt service implodes. The impact on equities will be inevitable. None of these facts are secret.
I can understand how the uninformed retail investor could be carried away with the frenzy of the herd. But how people who are charging others for their opinions can be recklessly purveying these inane notions for public consumption is beyond my ability to even faintly comprehend. Take care everyone!
Verne, I couldn’t disagree with a word you said, which lately, probably means you’ll lose money thinking like that.. 🙁
But seriously, I think the reason that the opinion’ers get caught up in the euphoria, is because their CLIENTS get caught up in the euphoria, and if you’re not on-board with that thinking, you’re gonna lose that customer…
There are some that fight that, but it’s the reality of customers and their money…
And it works, until it doesn’t…
Ultimately you lose the customer (or at least a good deal of their money doing that) anyway, but, while the party is going on, if you’re not partying on with it, you’re not gonna keep, or attract new, customers…
And ~that~ is where they make their money… Not in the actual long-term trading…
Unless you’re in a constant-bid one-way market, which clearly we’re in…
For how long, no idea… Maybe not much longer at all…
But hard to think about how much money I’ve missed out on (and lost) placing “sell” orders when I simply could have clicked the “buy” button instead…
Just. That. Simple….. Up to this moment, anyway….
That is interesting. I did not occur to me that they would put their readers money at risk just to ensure a paying readership, as opposed to themselves drinking the bullish kool-aid.
Despite today’s impulsive move down, the fact that they have stepped in and arrested it suggests to be we are not done yet. I still expect the turn to come via the futures market, and their failure of their attempts to halt the water-fall decline will be obvious to anyone watching. These gaps that end up being filled immediately have been exhaustion gap false flags for many months now and in my view should be discounted. There will be absolutely no question when this market finally turns.
These are very nice impulsive waves we’re seeing in ES and the like. Looking good.
My target for SPX was 2850.
utilize an ‘unconventional and dynamic’ moving average to identify potential support/resistance…it is currently at 2815.61 on the SPX…let’s see what happens…
you know those ……………………..”thick”………………coke bottle’esque’ reading glasses your granny uses???…………………. well – “PUT THEM DOWN”…………!
https://invst.ly/6flx-
just in case the …………”pump and dumpers”……………..have another “pump” in the left……………………….https://invst.ly/6fmr2
latest energy chart
this week inverted so far
https://ibb.co/hyS51w
Hmm. Suggesting a top may be in. We’ll see. Tomorrow should tell.
the “UP” channel………………………must fail…………………….first, and overlap second!
then……….and only then……………….. – we celebrate………………… https://invst.ly/6fn7-
We have an extending wave, imho…
the uptrend still in tact. know am in a lonely camp here. lol … but yea.. expected today some temporary downdraft…based on SKEW/X & the 3 AMIGOS FVX TNX TYX — but you notice that TODAY they green ? also notice $BPSPX — not a dint (yet).
also if you into numerology — noticed yesterday — the mirror image of “42.24” in SPX NEW 52wk HIGH of 2842.24 ?? 😉 and today the low was 2824.81 (so far).
I use DeMark calculators :: https://www.tradeviewforex.com/demarks-pivots.php & also follow SPLV which many a times seems to “lead” SPX. yea.. know… many think I’m crazy to think that…but its been able to keep me out of trouble.
R1 = BUY signal S1 = SELL signal
SPLV
R1 = 48.6225
P = 48.4538
S1 = 48.3725
today’s range (so far) 48.39 – 48.65 (NEW 52wk high) buttt ..
$SPX
R1 = 2846.31
P = 2838.55
S1 = 2834.86 — which was breached & 2824.81 day low (so far w/1 more hour to go)
for NDX — I use NDX : VXN indicator for daily — might see 347.02 — Dec low — but don’t think so — not yet.
oh yea.. and the $VIX : $VXV is NOT > 0.91 — so not panicking and doubt we going lower this week.
anyhow — there’s more – but I won’t bore you.
luri — that was funny re “elites” — call them deletes, eh!
btw — did you know that in Freemasonry the combo of “ie” is bad ? and the letter “l” don’t exist. also if you look at the word “be_LIE_f” .. kinda telling, no ? 😉
I also daily check $XLY & $IAI — kinda telling which direction we headed ?
I hate to keep posting — butttt — NOTICE ?? how from the VIX’en FAMILIA — the ONLY 2 REAL high — are $VVIX & $VSTN (near term volatility) — while rest are anemic.
Last Chg
VIX 11.44 +0.34
VVIX 99.72 +1.13
VWB 11.23 +0.40
VWA 11.64 +0.31
VIF 11.78 +0.68
VIN 11.42 +0.26
VSTF 11.38 +0.37
VSTN 12.71 +1.43
VXST 11.38 +0.36
SPLV 48.54 +0.08
SPX 2,839.04 -0.09
TYX 29.38 +0.36
TNX 26.54 +0.30
FVX 24.41 +0.20
BANK 4,224.36 -16.86
& $BANK also made another NEW 52wk HIGH and it certainly is NOT that red. seen it 80-120 some days in the red & also in the green.
had to get these out of the way. sorry for the multiple posts.
Finally! USD capitulation. I think we have a hammer. Look for a series of upside gaps to confirm the deal. Things are going to get real interesting!
verne,
………………ahem…………………”you are wanted in ………TRIAGE……….dr verne……..stat!”
……………with the greatest of respect…..Herr Verne……….we must be looking at two different DXY charts …………..me no ………….see…………….no bottoming wick???
https://invst.ly/6fnyx
Sorry about that. I was looking at UUP! 🙂
We still do have a very bearish MACD reading but I expect that will change in the not-too-distant-future…
Peter G,
Thank you for posting the “link” to the close only line chart for the S&P. That is a powerful chart!
For others…It is Peter G’s response to my request made on January 23rd at 1:01pm.
Very much appreciated!
Possible 2 scenarios for me:
1) Today was a swing high and low day like 7/27/17.
2) Refer to fractal described here https://worldcyclesinstitute.com/christmas-stalking/#comment-25446
Based on day-counting, it’s not yet April 20, 2016 but the fractal suggests that today is April 20th.
For either scenario my hypothesis suggests a lower low in between the month-end window dressing/Potus’ State of the Union address high (lower high?).
From the potential 1/31st high, 2/7/2018 is the potential swing low because…
Luri… it’s a 911 day.
Jan. 31 FB earnings after hours. Feb. 1 earnings AMZN, AAPL, GOOGL, MA. So 1/31 to 2/1 are important days.
Not April 20 but April 19.
Today’s 300 +- swing looks like a lot of nothing
This is reminding of the July August period of 2017
The US dollar index and interest rates and utilities
Are following the cycle yet the Dow so far is only
Slightly getting in sync .
Without digging further my gut is telling me it is failing .
I’m staying bearish yet there is massive risk .
I only risk a tiny portion of my money on bearish trades
I am long some 47 stocks , I use my bearish trades as a hedge.
For those of you who are new to trading you should understand
That not everything falls or rises together .
GE is a good example and there is several examples .
The utility index is following the bear cycles
We have a total lunar eclipse at the end of January and a solar eclipse
In the middle of Feb. You can agree or disagree yet we are in a 51 trade days
Cycle which ends in early April.
The big move whether up or down begins March 1 st ( the full moon )
We are coming up on a full Moon now as well at the end of the month .
Jody
I have been in your shoes and it sucks and may bother you for a long time
Yet life is worth living .
Updating a few cycle charts today and dealing with a few computer issues
So transferring data back to my laptop .
This present cycle we are in tends to repeat or should I say almost always
Repeats almost exact each time .
The past 2 years it has been exactly opposite with a bullish resolve
The set up is always the same .
I need to see the visual to make any claim on direction .
Jan 26- Feb 2 should be a high of sorts .
I cannot rule out a new high or at least a ‘re test .
That said a choppy sloppy sideways trend is expected into early
March . If it’s a slight down bias I’ll call it bearish
If it’s a slight upward bias I’ll call it bullish despite my bearish bias .
The big move though begins March 1 st .
Us dollar index
Wave 5 on monthly chart will be .618 times waves 1-3 at 87.233
A 50% retrace of the entire move from the 2008 low to the 2017 high
Sits at 87.257
87.233-87.257 looks like a magnet
The monthly indicators on the US dollar are no where close to giving an
Oversold reading .
From Sept 1992 to July 2001 the dollar rallied for 106 months
From March 2008 to Jan 2017 the dollar rallied for 106 months
James Flanagan :
He was bearish last year based on the 60 year cycle and comparing
The market to 1957 , that analysis failed to come true .
1958 was an extremely bullish year which is why he is extremely bullish .
His webinars are his best work in my opinion , his actual news letter
Is not all that good .
My opinion on newsletters is they need to be educational .
If you can’t learn the process how can you go out on your own ?
Elliott wave theory is the simplest method and has predefined risk so
You know when your wrong . You can combine your wave counts with
Cycles and indicators to quantify your wave count yet the wave count will
Stand on its own . James Flanagan is mostly focused on the 60 year cycle
And what he calls the DNA of a market and how that DNA of the past
Compares to today
It’s great when it works but it doesn’t always work .
The dollar index rallied for 106 months and is now down in 5 waves
On a monthly chart . The indicators are no where close to being oversold .
The next bounce will tell the tail
The last decline in the US dollar following a 106 month rally
Lasted 80 months ( 6.66 years )
Waves 1-3 lasted 31 months ( 2.58 years )
The dollar fell in 5 waves from its year 2001 high to its year 2008 low
It then bounced in a 3 wave move and peaked . It now has a 5 wave structure
To the downside .based solely on the wave count the US dollar is in a very long term
Down trend . Like it or not that is what the wave count is telling us .
This puts into question just how this great depression will unfold .
We can alter the wave count to our liking and say the real peak in the US dollar
Was in the year 2015 and that places us in wave C of an expanded flat .
If that is true then the US dollar would scream much much higher in the years
To come .
That said , it is being creative with the wave count and not just seeing what is right in front of us .
The bullish dollar count can only be considered with a break above the Jan 2017 high
That is Elliott principle 100 . It defines your risk and tells you when your wrong .
The US dollar breaks above the Jan 2017 high I’ll accept it whole heartedly .
Until then and after some 20 years of thought . I am now an official dollars bear .
A move back to the 97 – 100 price level I’d consider as a wave 2 .
Bottom line based on the DNA of the previous drop the dollar will be much lower
In 2024 than it is today .
The debt cycle will destroy the dollar .
I have changed my mind because the Elliott wave count .
This wave 2 in the dollar should usher in a longer term decline
And a major bottom in gold .
You can argue your bias but you can’t argue what the wave count has stated .
The dollar is toast and it will bring the stock market down with it as foreign money
Goes back home .
Welcome to the future 🙂
Interesting info on the duration of dollar declines following the last 106 months of advance. We certainly have not had anywhere near six years of decline since as you noted, we only peaked in January of 2017. If I knew nothing about EW theory, the current macro-economic prospects for a deflationary cycle would lead me to expect an EW count that saw a higher dollar. My view on prospects for the dollar in a deflationary environment is exactly the opposite of yours Joe, and I think supported by past history. I think Peter T’s wave count that has us completing a fourth wave is correct as that count calls for the dollar to move on to a new high in a fifth wave. I agree with you on the dollar’s ultimate demise. That will not come, in my opinion,until the FED embark on a crusade to battle the coming deflationary cycle with massive money printing unlike anything the world has ever seen. I think being on the right or wrong side of this debate is going to make or destroy and incredible amount of wealth, so folk really need to do their homework on this score. I think what most folk are missing is that the vast majority of the world’s debt is dollar denominated. First deflation, then inflation. At least that is my understanding of what is just ahead. It is a fascinating discussion to be certain.
CRASH ALERT!
I don’t post crash alerts unless I see something in the energy charts that catches my attention and tomorrow is going to be a very interesting day. I see 2 major lows, 1st @ approx. 11:00am and the Big Whopper low @ approx. 2:30 to 2:45 with a “V” shaped recovery into the close.
Thanks Tom. I was also looking at the Sept. 6-8, 2016 fractal but I can’t figure out what would trigger a Sept. 9-like huge drop. Perhaps bad pre-market earnings & warning report from either CAT, celgene, biogen, fcx, raytheon, 3m & the other 2 airlines.
Hi Tom ,do you have a chart for us?
I see a big turn on Jan 31
Thanks.
I am not so sure I would consider a price decline that is recovered as a “crash”, so much as I would a “dip” 🙂
But seriously, that is exactly the kind of price action I would expect going forward, until and unless the sentiment of the herd changes sufficiently dramatically enough to cause the banksters to loose control. I read an interesting article today in which Dalio is making fun of folk (like moi) mostly in cash and talking about how they are going to continue feeling quite stupid. A more thoughtful (and humble) Schiller is pointing out that markets do not need a “trigger” to sell off precipitously.
He pointed out that in the Summer of 2006 people were lining up to buy condos in Florida. One month later, the lines had completely disappeared, and not owing to any trigger anyone could point to. Sentiment simply had changed. The same could happen in this market environment. I think this a most salient point!
Took a quick gander at futures and viola! Yet another triangle of some kind!
This is nuts on steroids. This triangle was clearly entered in what looks like a similar degree downtrend so chances are quite high that the break will be to the downside.
I agree with Tom about price direction tomorrow. About the “V” recovery, I guess we will just have to wait for Mr. Market.
I will repeat it until I am blue in the face – a rout that does not begin in futures probably will not stick. I guess I am saying we will get a snap back of some kind unless futures action changes. Will somebody make up my mind? ha! ha!
That was clearly, in hindsight, a triangle entered as part of the larger uptrend so probably a fourth wave of some kind. This would make the thrust out of it a likely fifth and terminal of the current wave up. If correct, I expect yet another higher VIX close.
young man ……………….. you are ……….”sooooo”………….going over my knee right about now…….. in the days of old…………..discipline was called ………………”a whoppin”!
https://invst.ly/6fwx0 – ES in da mornin!
https://invst.ly/6fwyd – DXY – so it was a continuation candle……i need to see capitulation today – or else we could potentially go ALOT lower!!!!
Hey luri, there is your hammer ( 15 min). Would you like any fries with that? 😀
Wow! Looks like Tom’s call right on the money. Despite new futures high, it looks like we are setting up for an interesting opening. If we get a VIX gap up at the open that would be Yuge….
that afternoon drop should have been way deeper. They countered the fall by ramping up the US dollar vs Yen trade. They do this all the time. It’s called in your face manipulation by the insiders.
Look at that dollar go! Momma mia thatsa bigga spicy candle! 🙂
If we take out 88.44 I will be doing some serious hedging of my long dollar trade.Looking forward to breathing a bit easier when we cross 90 to the upside….
Correction. That hammer low was actually 88.27, not 88.44….
New highs in futures ignored by the cash session is rare. Bearish!
verne,
yesterday’s high of 2855.25 in the ES is still standing…………….. where do you see a new high in the ES today???……………………………………..just say ……….”NO”………to cocaine verne……………………… just say …………..NOOOoooooooo!!! :-)))
Luri,
I added a whitelist plugin and added you to it. It seems to be working.
Thar’ she blows lads, off the starboard bow! 🙂
This website is for educational purposes relating to Elliott Wave, natural cycles, and the Quantum Revolution (Great Awakening). I welcome questions or comments about any of these subjects. Due to a heavy schedule, I may not have the time to answer questions that relate to my area of expertise.
I reserve the right to remove any comment that is deemed negative, is unhelpful, or off-topic. Such comments may be removed.
Want to comment? You need to be logged in to comment. You can register here.