
 Global pandemics always break wide open when climate turns cold and dry and social mood negative. We’re also now in a situation where household incomes are stretched, food prices are high, and poverty levels are rising. Whenever people are not well-nourished, disease sets in. You could call it a perfect storm and it’s a worldwide phenomenon.
We’re heading into a colder, dryer, climate now as predicted decades ago. Dr. Raymond Wheeler created the Drought Clock in the 1950s, which predicted cycles of colder and dryer weather. Climate changes on a predictable basis.
Cycles That Impact Civilizations and the Economy
Now, let’s take a look at larger cycles, spanning many decades, for example, 172 and 516 year cycles.
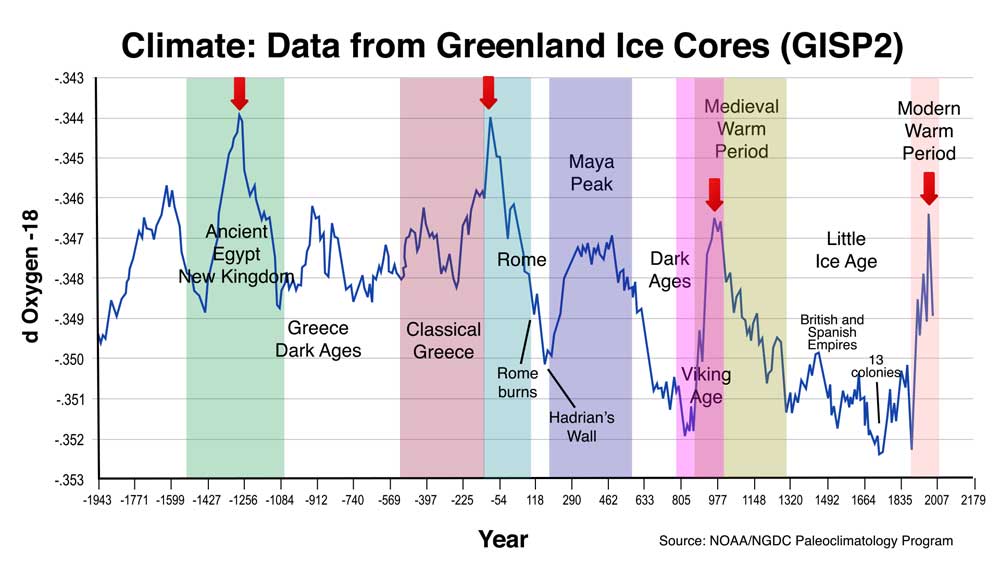
The data above comes from the National Oceanographic and Atmospheric Administration—from the Greenland Ice Core Research project ending in 1992. Ice cores are an extremely accurate method of determining temperature (blue line in the chart) back through the centuries. This data is undisputed by the scientific community, but has been suppressed by the UN-associated, man-made warming advocates. It also reinforces the findings of Dr. Raymond Wheeler in his research over fifty years earlier of tree ring data, weather records, military records, locust plagues, historical chronicles, sunspot records, etc.
The blue line that represents the major climate cycles, is a temperature indicator. Rainfall more or less follows the temperature pattern but creates its own fluctuating cycles in its own rhythm.
The red arrows on the diagram above mark large cycles of approximately 1050 years. The period from about 1256 BC to 54 BC had one extra 172 year cycle, so there can be fluctuations in overall cycle length, but they tend to be plus or minus one sub-cycle.
Civilizations rise and fall on climate, because a warm-wet climate provides plentiful food and water for people around the world. It’s the cold and dry climate cycles that destroy those civilizations, or at least dismantle to the dominant empire of the period.
The Other Side: Cold and Dry Cycles
You can see this on the chart below.
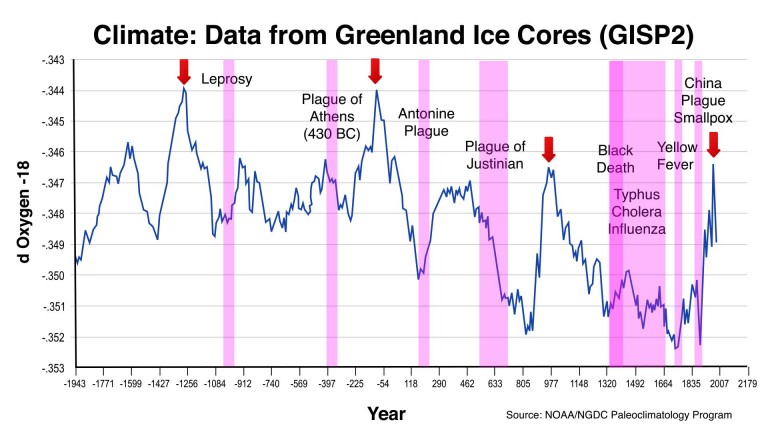
The red arrows mark the temperature highs. They happen approximately every 1030 years and then it turns colder for several hundred years. There are smaller spikes at regular periods in between the major highs.
However, whenever there’s a downturn in the temperature, human health suffers. There isn’t necessarily a cause and effect link between climate and health. But there is between mood and health, disease and famine. When people are fearful or suffer from a financial depression, their health deteriorates.
These downturns also turn human mood negative. Civilizations tend to crumble and the economy takes a big dive.
The 172 year cycle is one of the biggest culprits. It usually leads to colder climate accompanied by drought. It’s almost always accompanied by a global pandemic of one kind or another, and they’re deadly. These pandemics typically follow a major downturn in the economy.
Here’s a list of pandemics throughout the world over the past 2500 years: https://en.wikipedia.org/wiki/List_of_epidemics
The fear of a pandemic can result in substantial costs to the economy. People stay home rather than work and shop, for example. People who are in the hospital can’t come to work. People who are dead never return to work at all. Travel becomes restricted.
The 1918 flu pandemic is estimated to have killed at least 2.5% of the world population. With the current world population, similar results would mean some 170 million deaths worldwide.
With fewer people, there’s less demand for products and services. Less demand results in lower prices–potentially for everything (food, housing, consumer goods, factory equipment). Pandemics in a depression tend to add to the depressionary environment.
Here’s a brief description of some of the outbreaks identified on the chart above (from Wikipedia):
- Plague of Athens, 430 BC. Possibly typhoid fever killed a quarter of the Athenian troops, and a quarter of the population over four years. This disease fatally weakened the dominance of Athens, but the sheer virulence of the disease prevented its wider spread; i.e. it killed off its hosts at a rate faster than they could spread it. The exact cause of the plague was unknown for many years. In January 2006, researchers from the University of Athens analyzed teeth recovered from a mass grave underneath the city, and confirmed the presence of bacteria responsible for typhoid.
- Antonine Plague, 165–180 AD. Possibly smallpox brought to the Italian peninsula by soldiers returning from the Near East; it killed a quarter of those infected, and up to five million in all. At the height of a second outbreak, the Plague of Cyprian (251–266), which may have been the same disease, 5,000 people a day were said to be dying in Rome.
- Plague of Justinian, from 541 to 750, was the first recorded outbreak of the bubonic plague. It started in Egypt, and reached Constantinople the following spring, killing (according to the Byzantine chronicler Procopius) 10,000 a day at its height, and perhaps 40% of the city’s inhabitants. The plague went on to eliminate a quarter to a half of the human population that it struck throughout the known world. It caused Europe’s populationto drop by around 50% between 550 and 700.
- Black Death, from 1347 to 1453. The total number of deaths worldwide is estimated at 75 million people. Eight hundred years after the last outbreak, the plague returned to Europe. Starting in Asia, the disease reached Mediterranean and western Europe in 1348 (possibly from Italian merchants fleeing fighting in Crimea), and killed an estimated 20 to 30 million Europeans in six years; a third of the total population, and up to a half in the worst-affected urban areas. It was the first of a cycle of European plague epidemics that continued until the 18th century. There were more than 100 plague epidemics in Europe in this period. The disease recurred in England every two to five years from 1361 to 1480. By the 1370s, England’s population was reduced by 50%. The Great Plague of London of 1665–66 was the last major outbreak of the plague in England. The disease killed approximately 100,000 people, 20% of London’s population.
- The third plague pandemic started in China in 1855, and spread to India, where 10 million people died. During this pandemic, the United States saw its first outbreak: the San Francisco plague of 1900–1904. Today, isolated cases of plague are still found in the western United States.
The Earth has a habit of culling the population on a regular schedule. Are you ready for the upcoming pandemic? There are ways to prepare. I cover these in my programs and talks.


A good piece to read thanks Peter,
I never expected the market to turn up so much,congrats so new highs on the SP today or tomorrow?
The dollar index is all ready turning up again and with a turn date comming up feb 7.The surprise drop may begin.
Mercury retograde starting feb 17 should make it complete.
Thanks, Johannes,
Not a “happy” post.
Well, it’s never a surprise. The waves play out their very predictable end pattern. A few days more.
Well, we are allready getting close, the bradley (geo version) has a turningpoint feb 8.
Last one was feb 1, and we had the big upswing..
I m watching point feb 17, that’s also when mercury goes retograde.
We could drop from here till the beginning of March.
My best guess turn down feb 7 till feb 13, after that up again feb 17.
Did worked out prety well…. so 1 wave up…for now 2e wave down…one more to go..
So we got the new high on the SP500 , but not your dollar index level.
Is that a problem for the 4th wave to come down?
Thanks in advance
John.
Good article Peter
I’m currently running a zero sunspot day comparison
With the prior cycle ( it’s just a correlation I’m watching is all )
So far this present solar minimum has Not achieved
The same amount of zero spot days as the previous cycle
Of 2007-2009 .
The continuation also is still following the dalton minimum
And I’m kind of surprised this correlation has held up so well
For this long ( from 2009 to date )
If everything stays on track then we won’t see a meaningful
Life in the sunspot activity for the rest of 2020.
That’s as far as I’m running the data sets at this point
Yet no doubt this solar minimum can extend no matter what I think.
A lot of cycles coming together between now and July
As well as Jan feb 2021 .
Keeping with sunspots , you wrote an article a few years ago
In which DR Wheeler mentioned it gets colder as the sunspot
Cycle turns Up.
You are the only person to have mentioned that and
I think it’s going to be an important detail as we move
Forward over the next several years ( decades as well )
@Joe…Can you plz elaborate more how you are comparing sunspot day with prior cycle? I mean which website gives such limd of data its juat few days i got to know about it and curious to see how it works. Thanks in advance.