
Four or Three?
Last weekend here, I predicted that we had one more wave up to go before we hit the top of the third wave:
“… the market made it very obvious we’re not quite done with this third wave. All boats have risen to a new high, but the market has signalled one more wave up … and this is across most currency pairs and US indices and futures.”
We indeed went up one more time to a new high. On Wednesday in the Chart Show, I predicted the turnover would happen within hours after Yellen’s announcement, but that it might not happen until the next morning because very often after after a Fed meeting announcement, the market moves in one direction to finish off the day, only to move in the opposite direction the next day.
Sure enough, that’s what happened. ES moved down about 25 points on Thursday. I now place us in wave four.
However, with a market at bullish extremes, and an EW expectation that it will take perhaps ten weeks to trace out all of wave four (a projected SPX length of 175 points), it’s likely to be a choppy and difficult path down. (That works out to 17.5 points a week).
It won’t be much better than the difficult market conditions we’ve experienced over the past several months. Plus, it’s summer. Expect wave four from hell.
Last Weekend: Predicting the Top of Three
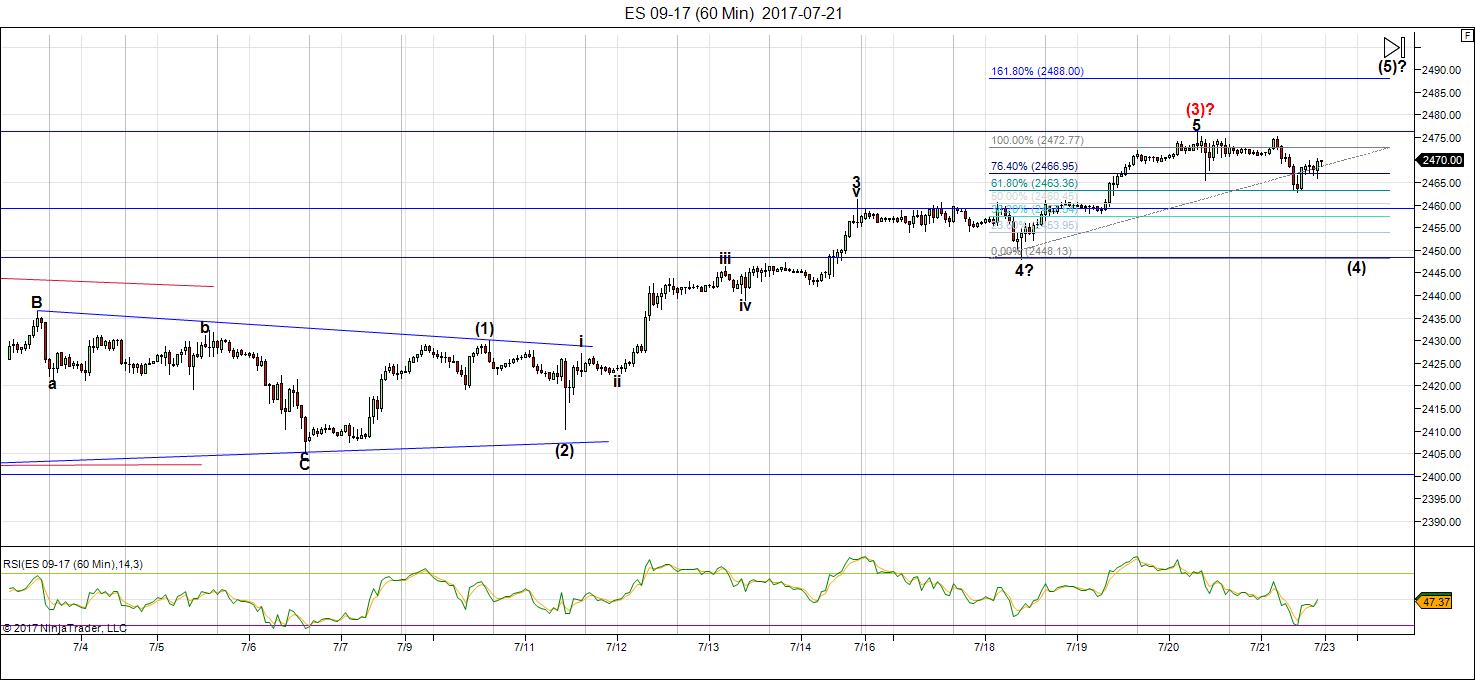
Above is the 60 minute chart of ES that I posted in from the Traders Gold subscription area on July 22, 2017 (last weekend).
I predicted (as per the fibonacci tool overlay top right) the if the fifth of the fifth rose to its full allowable length (1.618 X wave 1) that it could reach 2488. It topped on this past Thursday morning at 2481.
I had also predicted a top for NQ at 5990 for the same reason. NQ topped out at 2997 on Thursday morning, as well.
_______________________
A Rare Event: The Market at Extremes
You don’t have to have even a medium level understanding of Elliott Wave wave movement to know the market is at extremes. But if you do, you know that we’ve had some rare extreme movements in key assets, most notably the US Dollar and Euro (which move counter to each other).
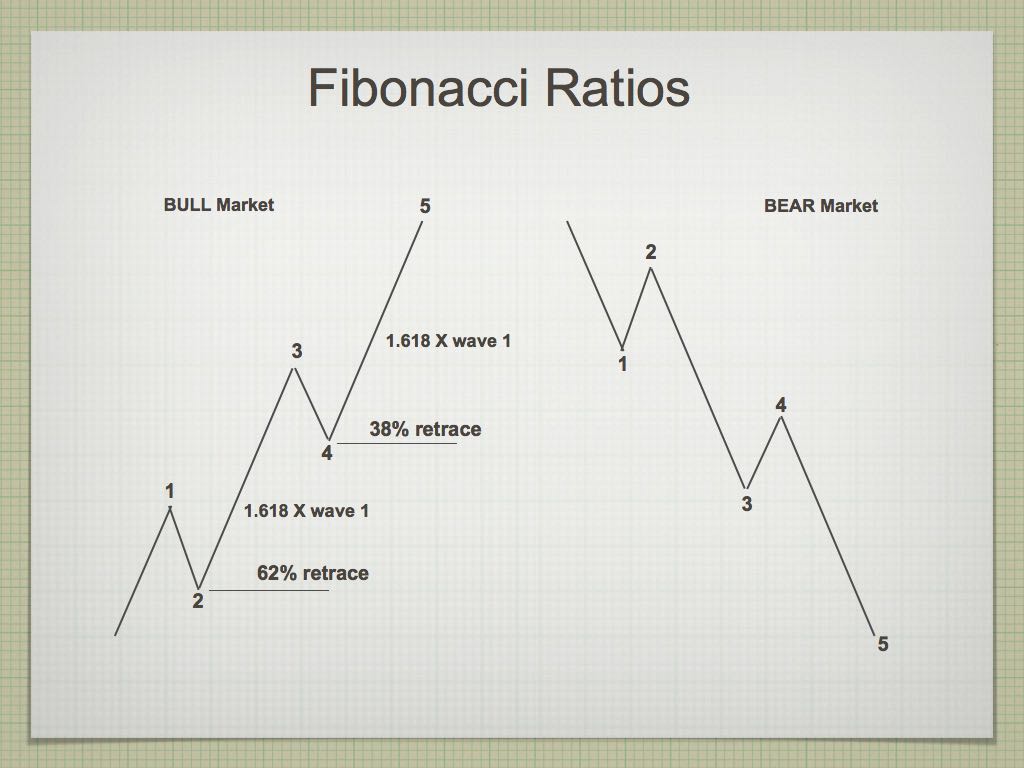
An impulse wave in EW moves in five waves in a very strict manner, with wave lengths that are highly predictable. We have an impulsive wave at an end in the US Dollar (the chart follows below).
On the left is the typical measurements associated with an impulsive wave, with the expected fibonacci lengths of the trending waves (1, 3, and 5) and typical retracement levels of the countertrend wave (2 and 4). Typically the third wave reaches a length of 1.618 X the length of the first wave of the sequence (the Golden Mean).
Quite often, you’ll find that the one of the waves (most typically the third wave) extends to double the normal length (2.618 X wave 1). The five wave can also extend to that same relative length. However, it’s extremely rare to see both waves extend to 2.618 times the length of the first wave of a sequence.
In the current market, we have that rare phenomenon at play in both the US Dollar and EURUSD. In the USD below, which is the main mover of the market (related currencies all follow it, and the US indices have been reacting to it for months now, to a greater degree as time marches on).
This weekend, the US Dollar is at extremes. Both the third and fifth waves have traced out those extreme fibonacci lengths. A reversal is imminent.
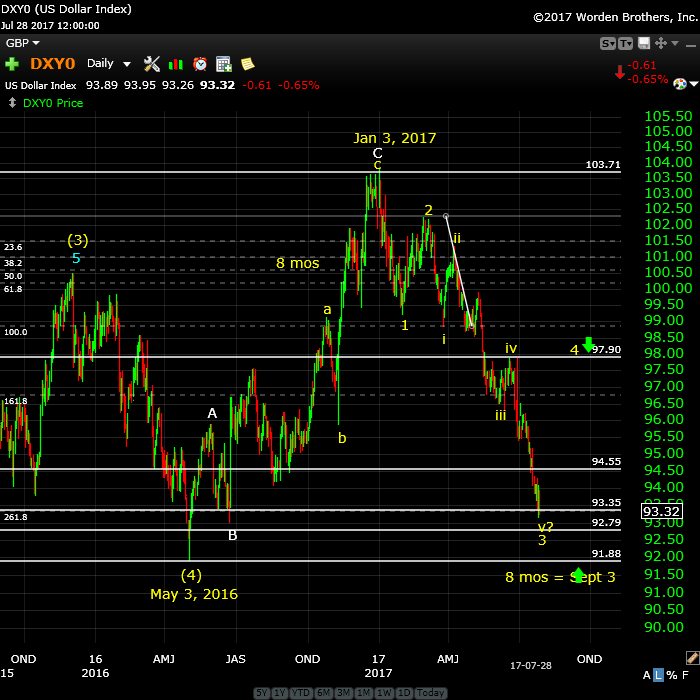
Above is the daily chart of the US Dollar. You can see quite clearly the impulsive wave down to our present level of 93.32. If you concentrate on the subwaves (and were to measure them), you’d find that wave iii is 2.618 times the length of wave i, while wave v currently has exactly the same relationship with wave i.
A turn to the upside is imminent.
Watch the dollar and you’ll know where the USD currency pairs and the US indices are going to go.
______________________________
Have not had a losing week RW 2
Have not had a losing week …I have been with Peter almost a year. The only thing that matters is have I made money with his service. I think I have finally turned the corner using Peter’s EW. I have not had a losing week in the last 5 months. Thanks Peter, for your amazing amount of hard work. —RW |
the real deal SM 2
The real deal …‘Educational, insightful and thorough market analysis for all levels of traders. It’s Elliott Wave at its best….Peter Temple is the real deal’ —SM |
Get an upper hand … JC 2
Get an upper hand in trading …Seeing all the different currency pairs and the wave structures and hearing you explain why this has to do that on a nightly bases gives one a upper hand when trading. Elliott Wave applies to all stock and indices and can be applied to any candlestick chart. If someone ask what you want for Christmas – Tell them a membership to Peter’s “Traders Gold!”—JC |
Couldn’t be happier … KK 2
Couldn’t be happier …The analysis and insight you provide is simply amazing! I’ve been trading the futures and equity markets for well over thirty years and usually average around 5% monthly. Since joining your Traders Gold Service two months ago, that number has better than doubled. I couldn’t be happier.—KK |
Rise above the rest … SM 2
Rise above the rest …I have only ever met a few people who, in their chosen fields (astrology, medicine, music, martial arts, technical analysis), rise above all the rest and you are one of them…you have ‘the gift’…and that’s why I’m a Trader’s Gold member. —SM |
The best of them JL 2
The best of them …Last couple of years, I subscribed to several ‘market traders’. You are by far the best of them and the personal contact is awesome. Daily and daily updates are very well written! Besides your expertise in EW, I also like your cycles analysis. Best investment I ever made! —JL |
A true expert in Elliott Wave FL 2
A true expert in Elliott Wave …You are a true expert in EW analysis. What you provide is not available anywhere and is priceless. Subscription on your services is the best thing I have ever done. Many thanks for your effort to make me a better investor. I now have more trust in my investment decisions. I hope you will continue the excellent work! —FL |
Tops in your field DZ 2
Tops in your field …You are tops in your field. Tried to follow Elliot Wave international for years. They were always behind the market. After discovering you, I perceive that you are an expert in reading the waves, which puts you way ahead of the rest of your peers. And you can read the Waves like you are reading tomorrow’s financial section. I pray you stay healthy. —DZ |
The Market This Week
Here's the latest daily chart of ES (emini futures)
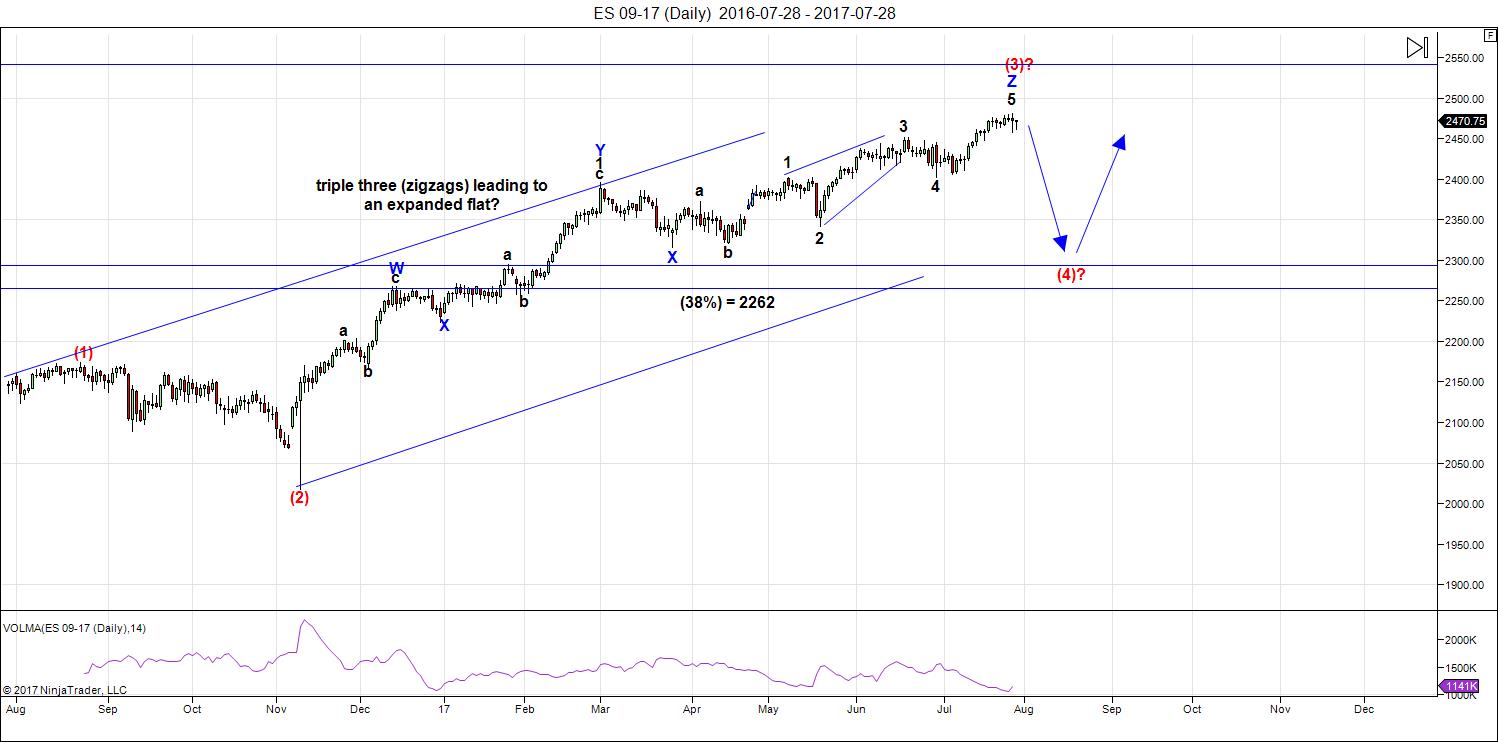
Above is the daily chart of ES (click to enlarge, as with any of my charts). Last weekend, one more wave up to a final top was due and led to a turn down into wave four. I provided targets in my Trader's Gold service for both NQ (5990) and ES (2488).
We exceeded the target for NQ slightly but didn't quite make the target for ES.
I now put us in wave 4, which will take weeks to unfold and drop towards a level of 2295 (which is the 38% retracement level SPX of the waves up from around 1992. That's a preliminary target and will be updated once we get an A wave of the 4th wave in place. On the chart above, I've left the level at 2262 until I have a more precise means of measurement (completion of the A wave).
There is still a possibility that we could see a test of the highs (a double top), but I consider that probability to be very low.
However, the count so far is only three waves down and so we still don't have confirmation of the trend change. We must register 5 waves down for solid confirmation. At the same time, there are several indicators that wave 3 is complete. They are:
- the waves up from the bottom of the recent downturn (Friday's market) are in 3's
- the larger wave three has a full count to the current top
- currency pairs are all at major inflection points and certain ones are extremely extended (USD, AUD, EUR, CAD)
- the DOW is at the very top of an ending diagonal with very little room to go higher. It's also at a measured fibonacci target
- NQ is leading the charge down, which is a very good sign of a top
- bullish sentiment is at an extreme, as I reported last week and ultimately followed by a post in zerohedge, with additional extreme numbers
- VIX has gone to a new low and was quickly rejected, which is a typical trend change warning
The large third wave up is an extraordinary wave. It's corrective, just like the entire sequence up from 2009. There are extensions of waves in currencies (USD and EUR, for example, but there are others), that are extremely rare (as described above). We've run out of wave 3 waves in terms of the Elliott wave count and the market should continue down from here.
Summary: Wave four is in progress. Expect a continued drop for several weeks to come.
After completing the larger fourth wave, we'll have one more wave to go, which could be an ending diagonal as a fifth wave. The long awaited bear market is getting closer.
______________________________________
Sign up for: The Chart Show
Wednesday, August 9 at 1:00 pm EST (US market time)

The Chart Show is a one hour webinar in which Peter Temple provides the Elliott Wave analysis in real time for the US market, gold, silver, oil, major USD currency pairs, and more. You won't find a more accurate or comprehensive market prediction anywhere for this price.
Get caught up on the market from an Elliott Wave perspective. You’ll also get Andy Pancholi cycle turn dates for the SP500 for the balance of the current month. There’ll be a Q&A session during and at the end of the webinar and the possibility (depending on time) of taking requests.
All registrants will receive the video playback of the webinar, so even if you miss it, you’ll be sent the full video replay within about an hour of its conclusion. For more information and to sign up, click here.


closer to the truth
http://articles.sun-sentinel.com/1987-10-21/business/8702010146_1_elliott-wave-theorist-stock-market-dow-jones
this is from oct 1987
On Oct. 5, Prechter`s newsletter, the Elliott Wave Theorist, produced more modest, immediate cautions. He advised subscribers to pull their money out because of a pending dip that might take the Dow average to 2,200. Instead, it dropped Monday to 1,738.74.
He spared the investors great losses, but he hadn`t foreseen the enormity of the fall.
“We were out of the way of it,“ he said. “To me, that`s the consolation prize. We didn`t win first prize at all. We were out of the way, (but) I didn`t predict it.
“Personally, I would have been much, much happier to have anticipated the magnitude of the decline.“
even more on point
not bashing prechter at all
just comparing the bullish bias from then to now is all .
Note: the most exciting period he said would be from mid august to October.
i find that an interesting parallel to today and the present wave count
as well
the difference of course was we might see a decline towards 2200 yet it is
unlikely we go below it . vs today we are bumping into 22000
https://www.questia.com/newspaper/1P2-5404799/stock-market-expected-to-move-upward-through-87
Interesting. One of the things Louis Rukeyser used to say that he hated about EW was that you could always go back and change the count after you were proven wrong.
He does have a point. I can always tell folk who think EW can predict what the market is going to do day to day. It always evidences itself in the frustration of their posts over the market’s doing something on some particular day that the wave count did not call for. it is kind of humorous. I never expect the count to tell me what the market is going to do day to day. Anybody who expects that will learn the hard way the expectation is unrealistic. Similarly, too many analysts can sometimes get dogmatic about what they think the count is and end up being completely closed off to other possibilities, until one of them comes up and bites them on the proverbial you-know-where and the count has to be revised. I remain extremely cautious about the present universal agreement that the next wave will be a fourth. I cannot recall a time in recent history where there was this kind of consensus. In the meantime, I am seeing extremes in this market that are absolutely historic. The monthly MACD for example is in territory exceeding even the extremes we saw in 2000 and 2007. Despite the attempts of some to dismiss it, the historic VIX lows and persistent trading below 10 is also speaking of levels of complacency never before seen since the VIX has been trading. I think this ongoing race upward without any meaningful correction is extremely ominous. I would not in the slightest be surprised, despite the expected wave counts, that we get more than a correction the next time this market heads South.
Speaking of dogmatic analysts, Brad Gudgeon again has egg on his face over his recent post about why the market must fall hard on Monday. http://www.safehaven.com/article/44629/why-the-stock-market-must-fall-hard-monday
I read that article and was shaking my head the entire time I was reading it, and thought to myself- “Some people never learn!”
These are the kinds of dogmatic assertions which I think lead people to erroneous expectations about EW, and gives the principle a bad name.
yeah, he keeps looking for sharp call…there calls are so confident that u will loose money. Any body who is doing this cycle things should be careful as not all predictions are correct, should have other stats supporting your trade.
I would agree with a lot you have to say, Verne, but I would caution you against drawing any conclusions from the level of the MACD indicator, regardless of the unit of time. MACD is a price-based indicator that disqualifies it for use in comparing previous historical price levels because higher price levels on the average or index will necessarily lead to higher readings on the MACD as opposed to the RSI which is ratio-based and therefore lends itself to historical comparisons. With that in mind, the current RSI level on the DJIA monthly chart is indeed higher than it was in 2007 but still nowhere near the levels reached in 1987 or the late 1990s.
Point well taken Peter. I cite it only as one of a number of additional metrics that seem to all point in the same direction. Appreciate that reminder on the need for caution though.
https://www.youtube.com/watch?v=Om9CDiSZlJs
Randy is one of the best out there in my opinion. The man knows what he is talking about. Thanks for the link!
Some interesting techs showing support for the Dollar Index (DXY) at current level;
a) Fibonacci support being 23.6% retrace of 1985 high to 2008 low,
b) planetary support with Uranus and Price opposition,
c) trend line support running from 1992 low,
Whilst touching 92.55 yesterday it returned to sit on Fib level. It may collapse and challenge 91.92 from May last year, but chart shows these lines have challenged price in the past. Expect will know in couple of days.
http://imgur.com/a/J4VRf
Dollar Index movements showing inverse correlation with US equities in 2017.
Other planetary influences showing up – Jupiter & Pluto squaring (Pluto was square Jupiter at the Dollar Index top in 1985 so possible rhyming)
For information only, no trade recommendation.
Verne
i have always had respect for Robert Prechter
so just want to make that clear.
My reasons for looking up his thoughts in 1987
was for my own perspective .
i wanted to understand his mindset back then .
back then Prechter moved the market and was
extremely bullish.
as for me ? i try to learn as much as i can and sometimes
i go research a few things .
for instance i read an article today explaining why Dow 22,000
was bad because only the rich own stocks .
I was expecting to read yippeee dow 22,000 but nope just the opposite.
I am not sure where the author of that article got his information that only the rich own stocks. It do not believe that is an accurate statement. Numerous sources (such as Bloomberg and AAII) show that the lion’s share of inflows after the Trump election has come from retail investors who are now back in the market with reckless abandon. Institutions and insiders, according to all the money flow data have been steadily exiting the market the last year or so. What we are seeing at these market levels is stealth distribution. As I said before, look at how people have foolishly ignored that massive candle the Nasdaq posted on June 9 and have now bid it back to a double top. This is dumb money. Pure and simple.
One more thing. The more I think about that statement that only the rich own stocks the stupider it seems. There are millions of working Americans whose retirement plans plow money into equities of all sorts every month. Most of these are middle class working folk who could not be considered rich in the sense that they could afford to loose that money and survive without difficulty. A dirty little secret is that even money market funds have had rule changes that allowed them to invest in more risky assets and in some cases are just as vulnerable as stocks. In fact, in some cases perhaps even more so. There is an age-old myth around the ultimate safety of for example, of muni bonds. For once something came out of Greenspan’s mouth that I agree with, and that is that bonds are in as much of a bubble, or even more so, than stocks.
as much as i m becoming bearish i must respect peters wave count .
a well positioned trade which takes 200 spx points is still a ton of money
in a relatively short amount of time .
simple example , 3 2450 strike put options or even the 2400 put options
or even straight futures can make a good chunk .
2450-2262 =188 pts * 3 = 564 pts *100 =56,400 dollars .
go with the 2400 options =41,400 .
2500-2262 as an example =238 pts * 50 =11,900 .
its going to come down to risk reward and guts to hold on
and in my case come mid august its get short and get on a tug boat
and i wont have real time access 24 hours a day like i do now .
options might be my best strategy for defined risk vs futures
with a gtc stop that may get run on the bounce .
sticking to my plan and will continue to move up mental stops
Hello , correct me if i am wrong , did the S & P top on July 27th and Nasdaq and Russell , also, its only been 7 days, but that is a non-conformation , look at transports , Peter Peter, please address this for me ….Nick
I’m actually putting together a video on the market today, which I’ll likely share. The US dollar is forcing me to change my prediction for a final top. I think it’s imminent. The dollar is almost at my long term target. EURUSD surpassed it this week.
I thought about this as a possible scenario based on where the currencies are. But then my big question is, where was Wave 4 in everything, especially SPX?
A corrective wave only needs to be in 3 waves (a zigzag) and that’s been in the back of my mind all along. The entire wave up is corrective and it’s really interesting that if you were to look at the entire wave up from 2009, the last portion of the wave is an exact fractal copy of the first part. It’s quite extraordinary.
But the bottom line is that because the market is corrective for SPX, the rules are pretty lax, as I’ve been saying all along. It’s an easy adjustment for me.
You can also look at the final zigzag on the daily chart of ES. It’s in three waves, as I’ve been saying. Hard for me to explain all this without a video, which I’m going to start on shortly. I did most of the heavy lifting last night. I’ve been thinking about this for several weeks.
Peter- I am not sure what you are saying. are you thinking that the final high might be in and not a wave 4 down and then a wave 5 up again. thanks
Here is one guy who shows a 5 wave count. Don’t know what to make of it.
https://www.seeitmarket.com/sp-500-nearing-major-elliott-wave-top-17131/
Honestly, where do these guys learn EW? What a screwy count. He has the third wave floating in the middle of nowhere and the fourth wave higher than the third. The third wave should be at the top of the 4th wave. His count makes no sense.
Good. You agree with me. It didn’t look right, but I didn’t know why.
He has the fourth wave as an expanded flat and I think EW rules do allow for the B wave to go past the start of the A wave. I know guidelines say it should be at least 90% of A and discarded if it goes beyond 2X
Peter!! You had me wondering there for awhile my friend! BINGO!!!!!!!!
🙂 🙂 🙂
Now folk.That is what I call a gentleman and a scholar. You’ve just gotta go where the evidence leads! You the man Peter!!
Well, I go with what EW tells me. I’ve been talking about SPX being in a corrective wave for a long time and it’s only in the past week that the alternative count and structure has risen to the top because of what the dollar is doing. The dollar is in charge. It’s not quite reached my long-term target, but it’s not more than .60 away, so it’s bringing the entire market into clearer perspective.
SPX has also pretty much reached my long term fib level as well: 2500. I think we need to stick a fork in this market. And the chart of FB … screaming “done.” … as Mr. Z thinks about running for Prez. I’m living in some sort of alternative universe, obviously! Time to bring back “The Twilight Zone.”
interesting coincidences…listened/viewed a webinar this morning by Greg Schnell of StockCharts (and Calgary)…he had an interesting perspective on the USD…in addition, less than 30 minutes ago Chris Kimble sent out a FREE email with the subject: “King Dollar testing triple support with few bulls!”
Greg Schnell Webinar
https://www.youtube.com/watch?v=WaSyNMP-qbY
Chris Kimble Tweet
https://twitter.com/KimbleCharting/status/893183089299660801
it is weird that all the wave and cycle forecasters are very bearish and the public is very bullish. forecasters keep calling for a top and the markets keep going either sideways or higher and its like the movie Groundhog Day. maybe we need the technical guys to go bullish for the market to really top. after eight straight years up it is sad to see so many people trying to call the top. Demark doesn’t go on tv anymore and nobody interviews the bears like nenner or rogers or faber or preacher or Jenkins or Dorsey or panchelli anymore.
sorry meant prechter and wanted to add jadeja-mcgough-
marc; stop looking at what other people are saying a LOOK AT THE MARKET!! 🙂
VERNE- I have tried that and that hasn’t worked. what is the market telling you right now? thanks
I am curious by what you mean that you’ve “tried that”.
Are you saying that you have not found a trading or investment approach that you rely on to make decisions about how, when, and what to invest?
If that is what you are saying you should not be in the market.
If you have not yet found an approach that is consistent enough to allow you to be in the market profitably you should definitely put your money somewhere else. You don’t have to be right all the time. In fact you don’t even have to be right a majority of the time. Great traders like Steve Nison actually generally had more losses than wins but he still grew his account with a disciplined approach to what he did. I have found two critical things that have worked for me as a basis to the approach I use.
1. Always have a number that says your wrong about a trade and get out.
2. Always have a profit target with every trade you make and get out. 🙂
As to what I think about the market- I think it is right now a very dangerous place.
Verne, thanks for your willingness to post your opinions and experience in the markets. Would you mind telling us what your percent return has been on your trading over the last few years. I have been trying different systems and while my directional calls have been right mostly, my use of short term options as trading vehicle has resulted in no net gain and slight loss.
It would be inspiring and encouraging if you were to have had 20% or more return on your investments in the last few years, and if not would be very interested in finding out why.
There is a nasty little game going on with certain stocks and sectors right now and I can’t believe people are not seeing it. The stocks are selling off, and it looks like algos are being turned on to bid them back up- rinse and repeat. What is going on here is a stealthy distribution to the stupid buy-the-dip crowd who are getting suckered big time. For example, the last week or so I have been buying put options on NFLX and DDS and selling them intra-day for double what I paid for them and I did it again this morning. I simply cannot believe I can keep getting away with this!!!
I went back and looked at some of the incredible rising wedges in a lot of Nasdaq stocks after watching Randy’s video yesterday and I agree with his measured targets. In the case of Amazon, it is going back to the 600 area. Who in their right mind is holding onto stocks like this and Tesla?? Blows one’s mind!!!
Peter- when you get really bearish how do you play the strategy? are you short the equity market right now? thanks
Next 7 days: shorting opportunity or cash setting up a long trade into mid late August. Earnings season is winding down, congress recess without repeal, summer vacations. Given that I believe we are in a few more years of “irrational exuberance” ala 1996 Greenspan quote (which preceded 4 more years of upward price movement) to unprecedented earnings multiples, will only be trading to long side next few years and in cash instead of shorting. Market/economy will most likely party like it is 1999 for several years. =)
Hi Valley:
You should never ask a trader to give you specific information about their trading accounts on a public forum. 🙂
If they do, you have no idea if they are giving it to you straight as anyone can make outrageous claims about their trading. Since I generally use my real name on public forums I try to be careful about that kind of information for reasons you can well imagine. I subscribe to a few analytical services and on one of them (Elliott Wave Stock Market by Lara Iriarte) I have been posting trades I make in real time for quite some time including entries, time held, and exits. If Peter has no problem with it I could occasionally post here what I buy, when I buy it, for what price, and when I sell it, and at what price – for educational purposes only, of course. I have hinted at that a few times in the past. That is the real deal and when folk don’t give me that specific information I pay little attention to their claims.
I learned a lot about trading with Bryan Bottarelli of Bottarelli Research in Chicago.
I learned from him that my trading style was definitely not buy and hold. He taught me some amazing techniques and how to deal with corrupt market makers who eat most retail traders for lunch. Trading with a posse gives you an advantage in that you have enough volume on recommended trades to move the market. Market makers used to try and screw us by offering ridiculous bid/ask spreads on our winning trades and what did Bryan have us do? We started trading deep in the money options and taking delivery of the shares through option exercise (or assignment) before or after expiration! It worked like a charm! The crooks then had to worry about what to do when a couple hundred thousand option trades crossed the desk from our group as they never knew what we were going to do- cash in the option or exercise the option and take delivery. The spreads dramatically improved! 🙂
Another trader I learned a lot from is Ken Trester. He taught me the best way to trade in the market is not to buy, but to sell, and that is of course trading using credit spreads. It is more conservative and a lot less risky than buying anything.
I don’t want to blather on but the bottom line is that you do need some kind of system to trade with any consistency and you either have to develop one yourself through trial and error, or learn from others who have done it successfully.
My last few trades have been 180.00 strike August 18 NFLX puts, and DDS August 11 85 strike puts.
I have trades those specific options several time the last few days with specific price and profit targets in mind.
I entered FXE August 18 115.00 strike puts yesterday for 0.78 per contract.
I’m fine with you listing trades.
Hi Valley. A quick suggestion about option trades if you are using them as your trading vehicle. The biggest mistake people make is paying the current ask on contracts. NEVER pay the current ask. Once you are confident about the trend and you want to buy a position, the best thing to do open a limit order and wait to get filled on a counter-trend move of the price. The wait to get filled is well worth it. It is not uncommon to end up with a loosing or even break-even trade even when the price moves in your favor because you paid too much for the contract.
Obviously there are some cases in which the movement is so clear and strong that you know you are going to do fine just paying the ask and so it becomes a moot point, but that is the exception.
Thanks, Verne! Very impressive lineage of teachers. =)
Good recommendation on using limit orders although I mostly trade the QQQ and SPY and I thought the spreads were micro thin? Or are you saying that the bid ask quotes are in themselves not representative of the best price available?
What gives an option trader the edge is unexpected vol, and this is particularly true when it comes to getting filled. You would be truly surprised at how price can jump around intraday and temporarily cause bid/ask to do the same. I love using what I call “stink bids” (10-20% below the current bid) and you would be surprised at how often those get filled. The same is true when it comes to exiting the trade. When I enter a trade, I will open an order to sell my position at the targeted price immediately. I am not sure whether these open orders serve as some kind of magnet for algos but again I see a lot of fills at my price that ends up often being the high bid of the day. Can’t explain it, I just know it works! 🙂
I will experiment with these types of bids. Nice to know there is chance of 10 to 20% discount. =)
Mad Money vs Jim Cramer 10 years ago:
https://www.youtube.com/watch?v=rOVXh4xM-Ww
I am starting to have a real problem with SPX sticking so tenaciously to this 2470 support area. We have to seriously consider the price action we have been seeing could be some sort of consolidation ahead of a final spike higher. I have even seen an ED count for SPX on the most recent move higher but this is NOT the way ending diagonals complete. I am staying away from the indices (except trannies and NDX) until we get some clarity about what comes next.
Buying USO August 18 10.50 puts for 0.53 per contract. Target 0.75.
I think the hardest thing about trading is staying objective and not bringing our market bias to trading decisions. What is going on now is a great example. We are all expecting a market decline because a fourth wave down SHOULD have been under way by now. However, when you actually look at what SPX is doing in hanging on so stubbornly to that critical 2470 pivot,it is hard to avoid the conclusion that we are looking at a period of consolidation. It does not make sense to me and I certainly don’t particularly like or expect that the market should continue so long in a clearly over-bought condition, but price is what it is. I do not think, based on what I see, that we yet have a trend change. I think this market is going to continue on higher to around the 2500.00 target in a final wave prior to the turn down. Although not fully convinced, I have seen enough to warrant a few SPY 246 strike call expiring next week. If I am right and the market moves higher, I will roll the position as we put in what I suspect will be a final top, and that is looking more and more likely the longer this sideways action goes on. Have a great evening all!
Peter
as i have mentioned several times i watch the currencies from a distance
so while i do look at the euro as well as the us dollar in a broad view
i don’t get into the details so i might be missing a view things.
In general though i think the us dollar is a double edge sword
the rally from 2008 to the high being almost the exact same duration of the rally
from 1992 to 2001 ( somewhere in there ) concerns me .
from a foreigner point of view ( i m in the USA ) there is currency risk investing in the united states . while i do agree with you the dollar should end up longer term
higher then it is today if i was an overseas investor i would be concerned right now about currency risk if i had my money in the usa . regardless of my thoughts on trump he is not getting anything accomplished .
Bottom line : a further decline in the dollar could drive foreign money out of the usa.
i know that taking a one way view is not always a good thing yet look at the us dollar index back in 1987 , the falling dollar back then did contribute to the decline in the 1987 stock market crash .
the decline in 2007 .
the decline from 2002 also included a decline in the us dollar
the 2007 decline was the latter stages of the us dollar decline .
this bull market in stocks included the rise of the us dollar .
Obviously a strong dollar is bad for exports and hits earnings
yet the dollars decline i view as a bearish sign .
currency risk .
the euro in my opinion on a monthly chart fell in 3 big waves
A triangle B then 5 waves down in C .
not saying the euro makes a new high yet the rally in the euro
i view as deflationary in Europe, if memory serves me correct
it is typical of Europe to lead declines which then spill over into the usa .
i am with you 100% that the decline appears to be imminent yet i still
allow the dow 2 more weeks which to me seems like forever given the divergences between the various index’s as well as individual stocks .
it appears to me that the only way the dow and spx can catch up to the various stocks im following is a quick sharp collapse . and my assumption will be
the us dollar breaking what people view as the key support will contribute to the stock market decline .
as i began, i don’t look at all the details with currencies and i know you do
just adding my broad view is all .
my focus being the dow , i feel a bit nervous watching this all trace out
yet the failing of the spx and nasdaq are putting up huge red flags .
the oex though ( sp 100 ) closed at a new all time high yesterday.
if we fail to see a break out to the upside next week how ever
ill consider this wave complete and will consider the week of aug 21 as well as the day of aug 21-22 a low of sort , at this point though my bias is we see
the weekly closing high in the Dow 2 weeks from today at price levels not
much higher then we are seeing right now .
i still need to see a weekly close this week above 21930.50 on the dow
for this continuation to keep on track
interesting charts
click on the percent of stocks above the respective moving averages
on the nasdaq 100 .
https://www.barchart.com/stocks/indices/nasdaq/nasdaq100
nasdaq 100 weightings
partial list im going to put together and start watching.
what ever that adds up to i don’t know just yet.
Netflix as you can see is not as big of a weighting as Microsoft or apple
or even Intel .
Apple Inc
11.585
Microsoft Corp
8.298
Amazon.com Inc
7.05
Facebook Inc
5.948
Alphabet Inc
4.783
Alphabet Inc
4.172
Comcast Corp
2.828
Intel Corp
2.535
Cisco Systems Inc
2.343
Amgen Inc
1.896
Kraft Heinz Co/The
1.563
Celgene Corp
1.563
Charter Communications Inc
1.535
Broadcom Ltd
1.476
Priceline Group Inc/The
1.474
Gilead Sciences Inc
1.465
NVIDIA Corp
1.449
Walgreens Boots Alliance Inc
1.299
Texas Instruments Inc
1.205
Starbucks Corp
1.174
QUALCOMM Inc
1.168
Netflix Inc
1.162
ill take the above 22 and add it to the dow 15 and see what it looks like
Canada’s housing market begins to implode. Long overdue.
http://www.zerohedge.com/news/2017-08-03/toronto-housing-market-implodes-prices-plunge-most-record
the combination is roughly 70 % and 70 % nasdaq 100 .
ill use it for a broad view of the dow and nasdaq 100 .
peter
many years ago a guy that used to invest a lot in real estate told me
the east coast tends to lead the west coast by a year .
i have no idea if that correlations works in Toronto vs BC
i can tell you that the houses around where i am are not selling
for asking price . a house near me was asking 159,000 and it sat for
almost 2 years and only just sold for 125,000 and it was a decent house .
another one near me sold for 125,000 as well last year .
i have another one i m watching that just came onto the market and they are asking 225,000 and i m shaking my head .My brother tells me the bidding wars
in Seattle are still going on yet i keep telling him were seeing the top .
home prices on the west coast of the united states have honestly never really
reflected what a person can afford . Even at the bottom in 2009 as well as 2011
i felt prices asked were about 26 % over fair value . the Seattle area based on what i have looked at id say homes are closer to 60 % overvalued if not higher .
where i presently live though id say home prices are selling at close to fair value .
maybe 20 % over priced . I have not done any research lately yet i heard that the northern California ticked up last year . the last 2 times i have seen that we got a wave of Californians move up the west coast which drove everything up .
I m beginning to doubt we see that wave this time yet it has been a leading indicator in the past so i m not ruling it out .
Honestly id prefer it didn’t happen .
Calgary tanked two years ago when oil imploded, so I think it’s the underlying economy that makes the difference.
HUGELY deflationary, of course.
the 18.5 year real estate cycle kicks in. 2000 was the bottom in Canada, so we’re right on schedule.
And then there’s Australia, our counter-country in a way, proposing the most ridiculous methods of limiting cash … just what you don’t need. Again … deflationary.
I’m going to hold my big picture market video until the weekend. I want to re-do it based on what happens tomorrow.
Looks to me like a lot of buy on close order today
we will see soon enough how this market trades tomorrow .
i get a better look at volume using the weighted stocks
Monday is the lunar eclipse
that’s it for me today and probably for the week
I expect the labor report to have an impact.
Peter- what would the labor report have to say for it be bearish? report strong is good for the economy and report weak is good for interest rates- thanks
Trading these are tricky. The first reaction the market makes is usually incorrect. However, when you look at a chart and keep the news out of it, it kind of makes sense — IE — EUR/USD (or any pair) in an uptrend. They spike it down, then reverse it. Perhaps on a technical level the pair needs a 62% retracement before the next wave up. This is the time these moves happen quick.
For the S&P, it’s anyone’s guess as to which direction it goes first, and to make things even stranger, unlike currencies which trade while the news is being released, equities market doesn’t open until an hour later. You’d think that would be enough time for traders to digest everything and get it right at the open. Manipulation games, but sometimes it shoots straight in one direction.
We are in a triangle which is a continuation pattern. The break will be upwards for a final wave. Reversal should also be sharp.
i m with you on the deflationary front peter.
I look forward to your video
I think SPX is in some kind of triangle, probably symmetrical. If so then it is also most likely a fourth wave.
We should get a ksharp move out of it to all time highs to complete the larger wave. There is no way a wave down at this degree would allow the 2470 pivot to stand. I expect to cash out those calls tomorrow on the thrust from the triangle.
This is classic price action, like diagonals, when an impending trend change is being fiercely resisted. A few savvy analysts expect a volatility spike tomorrow August 4 so we could get an outside reversal day. If the market gaps open to a new ATH it would be a powerful signal to go short- those gaps usually get filled.
Based upon PALS tomorrow and Monday has much above average chance of sell off and volatility. (far South declination, and approaching apogee, and of course post earnings and summer doldrums).
Ideally we get a sharp wave up out of the triangle and reversal into the close. HYG and JNK saying the party is just about done.
Another double Hindenburg Omen today!! Yes, I know this is the third within the past month or two and nothing has happened yet, but the chart of Double Hindenburgs over the past 30 years is impressively bearish with only one exception…1995. Peter Eliades of Stockmarket Cycles published a report today pointing to three cycles or turning points, all pointing to today, August 3…186 trading day Lindsay Low to Low to High?, 278 trading day, and 440 trading day… We do live in interesting times 🙂
Indeed! ?
Peter G,
Thanks for the “heads up” on the Double Hindenburg Omen. Also, very interesting commentary on that Stockmarket Cycles site. Thanks for that reference!
Joe needs to read that. I thought of his posts about “Bearish Decades and Bullish Decades” from a few weeks back.
I think the key thing about these omens is not so much whether or not a crash is on the horizon, but how we should trade fractured markets. They are managing to keep the indices pinned in a tight range and you can waste a lot of time focused on them, rather than finding the weak stocks the HO is clearly telling us are there. They will keep retail investors all in with concentrated buying of index leaders to make things look rosy until the very end. Nothing new under the Sun.
Peter Eliades is another wave guy who was very good years ago but has called for the top for many years and has been very wrong like everybody else. the bears have no credibility left because even if we fall 20 percent it would still put as higher than when everybody started calling for a top. also that Hindenburg omen hasn’t worked in this 8 -9 year bull market either. thanks
If Eliades lacks market insight, maybe the bot’s and structural change in ownership of market (CBs debt for equity swap-BOJ for example) have resulted in a market that is not able to be analyzed using historically effective techniques.
Valley I think what you are saying deserves serious consideration. I know a lot of analysts tend to be very dogmatic in asserting that CBs don’t have any impact on the market but that statement seems illogical to me on its face. I used to be even willing to concede that they may not be able to alter the larger trend, but not affect the market?! It seems to me any buyer can affect the market, and the bigger the buyer the bigger the impact. There are no bigger buyers in today’s markets than central banks, either directly or indirectly. Heck even insignificant retail traders can move a market if it is ill-liquid enough, like penny stocks.
There is no question in my mind that the markets have changed, and that some analytical metrics have lost their predictive value. I still contend that the only people who do not see this are people who do not trade very much or not at all.
Add to that the amazing levels of personal savings in Japan and China (30 T US$) which is money that could be enticed into buying stocks again if there is another few quarters of stock market gains.
Careful on your judgment of the Hindenburgs. These are double Hindenburgs we are talking about, given simultaneously by the Nasdaq and the NY. Since 2009, there have been only two episodes, one in late 2014-early 2015 within, at most, 2.5% of the May 20, 2015 top which lasted over a year, and the others just over the past few months, all within 2-3% of current highs. A look at a chart with double Hindenburgs shows a very impressive record. To say the double signals have not worked in this 8-9 year bull market is unfair to the indicator. There were no double signals in the first 5-6 years after March 2009. As to Eliades, he is a cycle, not a wave guy, and he studies patterns. If a pattern looks like it could be signalling a top, he says so. He has made some great calls in the past, and like everyone else, some not-so-great…Are you aware of any analyst that has not made some “not so great” calls?
Peter G- the point is, has anybody made a great call the last nine years that wasn’t go long the equity market? the only other call the would have been great is to short oil call a few years ago at $110- any great call on the market had to have been before the financial crisis-thanks
Yep. Just about every position trader I know has been saying the same thing. Things are not behaving the way they used to in the past during this post great recession market. These folks have an incredible amount of data and they make recommendations based on the data showing how the market has acted in the past with specific reference to cycles. Most of them have been very frustrated and I can’t say I blame them.
just short the VIX etf’s!!!! no stress!!! big profits!!! automatically!!! haha
Opening STC order on FXE 115.00 strike puts for limit of 1.10 GTC….
You’ve gotta be kidding me!
This is what happens when you don’t have a trading posse folk.
My STC order remain unfilled despite the fact that the ask is now 1.32 for those 115 strike FXE puts. What is the bid you ask? 0.95 !!!!!!!!
$%#$%^^&^##@ market makers.
Don’t mean to rant but this kind of crap REALLY pisses me off!!!
I will probably not get filled until FXE falls another 0.50…..
Funny…they must have heard me. I moved my limit to 1.20 and got filled immediately. I think my brokerage may be playing me here….
Peter- I know that you have a weekend update coming out soon. Do you still think we have started wave 4? thanks
Like I’ve said previously the Dollar up or the Dollar down the market doesn’t care. It goes its way
I should have held those FXE puts a little longer; bid/ask now 129/162. I think the down-trend will continue.
Selling to open the FEX 114/116.5 bear credit spread for credit of 0.45 per contract.
Nice play and Nice exit. Perfect call for NFP report, but in the overall picture:
1) Dec FXE 113 call open interest is (and has been) huge. ~42K contracts. Those remain open now.
2) EUR did not come down enough to reverse the trend (at least not that I see, maybe Peter can correct me).
Crowded trade in Euro. Exactly what I expect close to a trend change.
agreed with dimitri.
I don’t think DJIA/SPX has anything to do with Dollar.
DXY was around 72 in 2011 and reached at 103 in beginning of 2017.
DJIA was at 11k in 2011 and now it’s 22k.
It seems they were together for 5 years – 2011 to 2016 but now opposite since last 5 months.
thanks
Like I keep saying. Dollar up or down markets go up. Interest rates up or down markets go up. Greed and sentiment indexes up or down markets go up. Economic numbers up or down the market goes up. Earnings go up or or down the markets go up. Commodities go up or go down the markets go up. When the markets go up for 8-9 straight years I don’t think any metric has worked at calling anything. All you have to do is say you are bullish and you have been right. Reading and studying the markets has meant nothing unless you are long. Thx
So if anyone is curious to see live crashing, see AAOI. Dip buyers getting burned so far. From 101 to 66.67 :). An omen of things to come?
Wow! Was there any news? If not, you could be right about the nature of future sudden exits.
Verne, Very weak guidance and the music stopped playing. The exit door was very narrow. https://www.thestreet.com/story/14257058/1/the-stock-that-crashed-25-overnight-has-a-lesson-to-teach-us-market-recon.html?puc=yahoo&cm_ven=YAHOO&yptr=yahoo
Since we are on the topic, a lot of folk are probably convinced that there’s no way US markets could experience a gap down of that magnitude. Frankly, when I look at the enormity of what central banks have done to markets these past eight years, it is hard for me to imagine any less dramatic a resolution. I have contended for months now that if we did not get a reasonable correction ( 2% or more), what we would get ultimately is not a correction but a collapse. We have gone the entire year now for the very first time this far into the year, without a single correction – not one!
Does anybody think this is normal?!
Does anybody think this is going to end well?
Lord Almighty…is it really possible the herd is this stupid??!!
The kind of gap down we saw in that stock raises some interesting questions about the notion of a slow transition in sentiment driving prices. I know the explanation will be that this kind of catastrophic mood shift taking place in one session can happen for individual stocks but not for the overall market which will take time to reflect changing social mood. The question I have is, really? Considering what the market has been doing in terms of things unprecedented, why would anyone be prepared to argue that market will not do something just because it has never done it before?
DJI has made nine consecutive new all time highs. SPX has literally gone nowhere for the last several weeks. NDX had what looks like an impulsive decline from its highs.
Markets are fractured. Obviously there are several options, including SPX also moving to new all time highs from this weeks long consolidation, as well as a reversal of the decline in NDX which we have seen happen before recently. This all looks to me like desperate injections of liquidity to try and keep thing propped up and there is no telling how long it can go on. SPX has frustrated both bulls and bears of late who tried to make directional trades. Credit spreads on SPX are the only things that have worked. People who traded DJI long did OK, or those who were short NDX. It does not get any more confusing and chaotic than this. I continue to avoid the indices for the most part as they are right now mostly a looser’s game. At some point the uncertainty and chaos will end, the key is to keep some powder dry until it does. Have a great weekend everyone!
verne- short the NDX only worked if you top ticked it recently otherwise it has been only up for eight years and the bulls on SPX aren’t too frustrated because that is within points of an all time high after going up for eight straight years-thanks
marc I keep forgetting that not everyone trades the way I do so you are right if people were long futures or the cash index. Option traders like me have great difficulty executing good trades when there is no volatility. I cannot imaging even for futures traders sideways action is a good thing because of carrying charges.
For others long the index unless tights were very tight there has been no reason not to remain long so you do have a point. 🙂
I don’t understand Marc. Who shorts straight for 8 yrs? One trades value high/resistance/beyond bollinger bands by selling and value low/fib retracements/support price levels by buying. Follow the money flow and try to catch the wave up or down.
LIZH- how has that strategy worked for you versus if you just shorted the VIX or stayed long the last eight years? thanks
Marc,
Pls read my comment dated May 12, 10 pm. https://worldcyclesinstitute.com/elliott-waves-pure-gold/#comment-17986
As you can see I find it difficult to be bearish long-term. I have passive investments and equity holdings. The 2009 lows didn’t shake me at all. I actually allocated more money in certain equity funds. So yes I am sitting on a bundle of profits which allows me to have a trading bucket. I do it because I enjoy following individual stocks. In hindsight, one tries to pass off as a genius and say you should have just put all your money in svxy, dia, qqq, spy and forget about it. In real time, you don’t know.
Last May 2015, I actually gasped when I saw the return for a healthcare fund I owned. I sold about 25% that month. June 2015, I started reading a few bearish bets on the healthcare sector so I sold more just leaving 10%. Then I started hearing some noise about VRX and noticed it was in the top 10 holdings of the fund. I was completely out October 2015. I sometimes can’t believe I sold at the top. Still, I like to trade IBB,XBI and certain bio stocks when I see momentum on the upside.
Last Friday, I felt a little pit in my tummy. Same thing I felt June 2015 for the healthcare fund I owned. I sold this particular equity fund. Peter says we’re only at wave 3 top but still I sold it.
I love to go to Peter’s site because he has a special gift and his views temper my bullishness.
Yes Marc, you can add in the list:
-wars and rumors of wars, refugee crisis, brexit, carmageddon, unsustainable debt, student loan, obama or trump….. market goes higher.
-another EWI favorite did Not work since 9 years – bulls/bear AAI report and filling the closing gaps. only it fills gaps upside but did not fill any gaps on lows.
thx
Bp- like I said- all this trading and strategy everybody does when nothing has mattered except being long or short the VIX- this will all blow up when it is least expected- thanks
For next week i think i will keep the 21472 mental stop on the dow
yet i doubt it gets there .
technically the 22330 level is the next price objective assuming we close
above 22044 ( it does look like we are getting the weekly close above 21930.50
which implies an acceleration higher for next week )
wild card for next week is the lunar eclipse on monday .
back in feb 2017 the lunar eclipse had a bullish effect into late feb early march
and the solar eclipse in late feb gave us an early march high.
cant say its going to be a repeat for sure but im thinking it will be .
food for thought is all .
Regardless of price targets ill begin using next weeks price levels
as keys to the pivot for a final high. in other words i intend to use next
weeks print high as a pivot level to get short .
its theoretical mind you but we are still following the pattern.
2 weeks to go before the weekly closing high as i see it .
a weekly closing high is not the same as a print high .
we would be best served as i see it to begin looking for an exit strategy
near the end of next week . which in my mind would be around 2 weeks before the final high . ill go one further and say this, at the end of a bull market
you see more and more individual stocks begin to turn down even though the index’s themselves make new highs . we are seeing this taking place so i don’t see this as anything different . what concerns me going forward is late September. all patterns have there point where they are prove to failure .
what im following is textbook perfect on the surface yet cyclical wise
i can still make the case for an upwards move to new highs after oct 3rd-17th.
and the seasonal bias tends to be bullish nov 7th to jan 16th.
that point noted , this market is setting itself up for a crash as i see it .
if we are making new highs next week on the Dow and should the Dow
poke above 22330 and stall i will adopt the potential crash scenario front and center. Aug 21-22 will be the key dates surrounding this crash scenario and technically must be the highs for this scenario to have the perfect set up.
next week we have the lunar eclipse aug 7th ( Monday ) mercury goes retrograde
aug 12th . for these reasons im going to key off of next weeks print high as the pivot . lastly i intend to cut back on my individual long stocks by friday august 11th ( nvda earnings august 10th ) if you look at AMD and there earnings
july 25 they beat expectations because of the eth miners buying out all of there graphics cards . the market took AMD back to a slight new high then sold it off.
im expecting the same scenario with NVDA and i intend to exit my position
on the news . Not saying i am bearish NVDA yet it is probably going to become a good short candidate and may very well play into this crash cycle.
See you all next week .
Joe
verne
good point on the 9 new highs in a row .
that is a typical sign of a short term high
and is a warning sign .
that said i m sticking to what i wrote above.
My target for the DOW is 25,000.00, to be reached sometime in the next 14 trading days. I expect SPX to hit 2490.00. For both I believe we will see a final top, and then it begins in earnest. In addition to the spectacular series of new all time highs in the DOW, the series of gaps open is also a signature feature of markets. Gap series begin at the start, and at the end of bull markets. Anybody cares to guess which is more likely? 😀
Oops! I meant my target for the DOW is 22,500.00
Pardon for being info policeman, Joe. I enjoy your work and research but 9 up in a row is not consistently negative, even for the short term. Most recent examples working backward are Feb 22, 24, and 27 this year (top 1 week after Feb 22 and yes you got a 3% decline but that is by no means typical)… July 20, 2016-exact top down 3%+,…March 13 and 14, 2013, continued straight up. That’s it for 2000s, going back one more iteration was Nov 14, 1996-a month lower there were 3 or 4 slightly lower closes than Nov 14, but that close has never again been reached to the downside, not even at the 2009 low…Bottom line from my data going back to around 1948 is you will sometimes get a top of some kind within 1-4 weeks of 9 consecutive advances on the DJIA, but it’s nothing we can count on historically…
I think Peter, that series gaps open in DJI contextually makes the new highs more noteworthy so far as the bearish theme is concerned. 🙂
22370.94 is the level where this move up from the august 2015 low
will equal the entire rally from the 2002 lows to the 2007 highs .
the difference being the dow rose for 60 months last time and this move
would be 24 months ( same point move in 40 % of the time )
also a 60 week price move from the june 27 2016 low will be the week of aug 21
i dont know if the dow will hit 22370.94 its just a number at this point
yet a poke above 22330 does set up the crash scenario so im watching it
Week of August 21 is absolutely huge, with a host of important events and important turn dates.
PALS is quite bullish next two weeks. May look to buy weakness early next week.
What changed? That’s not what you said a day or two ago!! 🙂
PALS bottoms Monday/Tuesday. It is a short term swing trading system that moves from bearish to bullish every 14 days or so. =) Elements of PALS is moon phase, distance, declination and also seasonals. Phase, distance, and declination are bullish from Tuesday for 14 days +/-.
New weekly closing high in spx helps support the view
of higher prices next week yet we need to see a print high
ndx though did not
JOE- I will take the opposite side fro next week- next move is down next week-thanks
I agree. We clearly are consolidating. The triangle also argues for an upside break-out. This week a really good lesson on trading what you see, as opposed to what you expect! Have a good one Joe! 🙂
PRECHTERS NEWEST FORECAST- the final high before the crash of a lifetime now has a timetable- JULY to NOV 2017–after being wrong for so long I bet he is right this time!!!!!!! thanks
I am not sure what market Prechter is looking at. There is no way this rising wedge is going to last until November and he is a complete WUS for even implying that it could. I can understand why he may want to hedge is bets being so wrong for so long but what is unfolding now is as plain as the nose on his face. We are already traversing the top of the wedge and if this thing goes past August I will eat my shoe! 🙂
I think two things- he has been wrong so many times that he is gun shy and two he thinks this is the end of a 200 year wave so giving a window of three months is not a big deal- I am obviously just guessing and I hope you don’t have to eat your shoe because I am long SDS big time-thanks
Weekly but not daily as that was 2477.57 on Wednesday. Doji today also a cuationary note.
Here are some more trades executed today.
USO August week 2 8.5/10.0 bearish call credit spread for 0.45 per contract
GLD August week 4 115/120 bearish call credit spread for 3.80
SPY August week 2 246/247 bullish put credit spread.
I am very interested in hearing about what trades others are making.
If you don’t trade your game, you don’t learn or profit. I will post when I exit or am stopped out.
I have to say I am always surprised at how many people offer opinions but no trades!! 🙂
verne- I bought sds today
And what was the reason for your choice?
Thanks!
I think the market (S&P) turns down sharply next week and surprises everyone
ALSO- don’t laugh at Seth Klarman of Beupost or Singer from Elliott capital or Howard marks from Oak tree- three of the most wealthy and successful managers of all time and all very scared and bearish-
Three incredibly successful asset managers, Marc, but that does not make them market timers (if ever there was such an animal). Marks from Oak Tree admits to waving cautionary flags in 2011, a full six years ago. I guess we are all measured by our bottom line and by those standards, the three you mentioned are now near the top. For me, the real measurement will be where they are at the end of this upcoming bear. That’s where true management abilities will be judged!!
Peter G- who would you say are the top three “market timers”? thanks
I have been around the markets for just about 50 years, Marc, and I have seen them all and am friends with most of them…but you pose a fascinating question. I will probably disappoint you because my top three are all now deceased, but I will amplify further. First, let me say that if anyone makes one great call in real time, I will continue to listen to and respect him (or her) in the future regardless of how many subsequent bad calls he makes. There is a certain magic to market timing that very few mortals possess and I have never seen anyone continue a magical string of calls over long periods of time. Number 1 market timer historically was Edson Gould. Research some of his previous market calls and you will be astounded. Read his “Sign of the Bull.” It was all amazing work. Probably number two, although he was less consistent in his accuracy than Gould was George Lindsay. He called virtually the exact bottom back in1982 on the old Louis Rukeyser Wall St Week program and there were several other great calls he made. The third guy whom I would nominate, and he actually was one of the best ever was Paul Macrae Montgomery…not a household name by any means, but he was a student of cycles and perhaps called more exact or almost exact market turns in real time than any timer in history in my experience. Unfortunately, those three are all dead now. We still have some very talented analysts today but I will not tread into that territory for proprietary reasons. I do think the next five years will be very telling in terms of analytical talent because I believe the stakes are now greater than they have ever been. I believe those analysts that have preached the “buy and hold” mantra are about to be dealt a great death blow, not like the ones dealt in 2000 and 2007, but far more severe and long-lasting, and those who have been ridiculed for a long time will perhaps have the final laugh…or cry as the case may be.
Peter G-You forgot Robert Farrell from Merrill Lynch who was one of the great ones- what did you do on Wall Street? thanks
Verne
we will see soon enough where the market goes that is for sure.
My focus though wont change . i m going to base my projections
going forward on next weeks highs . and i cant even conclude
that we will make new highs next week at this point .
the 9 new highs in a row are still a warning sign and as i began this year
calling for an October high i also included reasons for a high into year end and
i included a swing high lower or higher to as late as June 2018 .
all those parameters still exist .
at the moment im following this present cycle and it does point to the mid august time period yet until we actually get there im not going to claim anything.
as an example only , what if august 21-22 is a low ?????????
if that becomes reality everything i m looking at flips and we run into the October high scenario .
people don’t like the if this then that type thought process but a failure to look
at the market from both sides in my opinion is a mistake .
case in point and why i posted to valley that we may have seen an inversion and that something changed.
May 26th roughly was a new moon and a high june 9th a full moon and kind of a high yet better
counted as a low , july 11th a full moon yet a low of sorts july 25 a new moon and a low of sorts .
typically these inversions based on the moon take a few cycles before proving themselves.
august 10th is the next cycle high based on this scenerio yet aug 7th is the lunar eclipse .
aug 12th mercury begins its retrograde cycle which typically flips the market all over the place.
and 10 days following the mercury retrograde beginning you get aug 22, so aug 21 22 is important.
if the market is going to prove an inversion actually took place then aug 21-22 would become a low
and that inversion if it took place would to me be a signal of generally higher prices all the way into year end.
we are still in a Venus bull market until DEC or January i forget .
a shorter term chart on the Dow , daily or 60 minute you can see waves 1 2 and 3 heading into today’s close.
if you look at a typical mercury retrograde cycle as well as a lunar eclipse , they are generally bearish .
so i am going to exit a few stocks and i am going to adopt a bearish bias but until i actually see that august 21-22
high im not going to assume it is a top .
the reason i do stick to it being a high of importance is because as i look around the web nobody
i can find is seeing what i m looking at.
the short version: just because it looks perfect doesn’t mean it is .
previous chart posted
http://imgur.com/JYF8lqX
same chart yet updated today ( i think it is scaled down by 1 level )
http://imgur.com/Y3diyfs
Believe it or not Joe, I actually do think there is a good chance we will see an interim low this month. I think it will be the first impulse down and followed by the most manic second wave seen in our lifetimes. I expect the impulse down to be brutally sharp, fast, and last less than two weeks. This will allow enough time for a Fall third wave. I am long, and under water, volatility.
anyways
if we see a low aug 21-22 ill flip that red overlay upside down
and look for a high in October .
i have used these overlays for several years because they line up
based on the moon . technically though we do not have a puetz cycle this year.
so it may look perfect yet in truth it is not if i really want to get into the details
based on all of the theories combined .
Chris carolans work though has been fitting into this based on the spiral calendar. but the puetz cycle is not in effect this year .
including the year ending in 7 adds to this for next week yet not every year in
7 was a down year . 1927 had a dip then higher , 1957 was down yet then we had higher prices . its going to come down to the actual elliot wave count going forward as well as how this mercury retrograde cycle moves the market initially in my opinion .
that’s all i can say
its now up to the market to prove it all right or wrong
enjoy your weekend
Peter G
thanks for the info .
Ill just say this i have seen 5 up bars as well as 9 up bars
having some influence in the past , i didn’t mean to imply
that it was a constant only a warning .
Thanks for the correction
Verne
i have not traded in a few weeks and have been just letting everything run its course.
being long several stocks for the past several years all i have done is lighten up near potential highs . i have though posted the set up im watching for and my
intent to short the dow based on the set up . i have also posted where id question it all and accept when id be wrong .
other then that i m more of a swing trader vs a day trader so until everything
sets up i m waiting this out
Believe it or not Joe, I actually do think there is a good chance we will see an interim low this month. I think it will be the first impulse down and followed by the most manic second wave seen in our lifetimes. I expect the impulse down to be brutally sharp, fast, and last less than two weeks. This will allow enough time for a Fall third wave. I am long, and under water, volatility.
Verne,
You said, “…has egg on his face over his recent post about why the market must fall hard on Monday.” Perhaps he has the wrong Monday.
Now don’t laugh Verne but ever since March 1 high for SPY:
3/27 swing low
5/17-18 swing low
7/27 swing high & low. All these 7s for a year ending in 2017. This coming Monday is 8/7.
And the next Mondays, multiples of 7: 14, 21, 28.
Whoa! That is truly noteworthy!
Thanks the the note Liz.
I would be only to happy to see a dive on Monday, my hedging SPY bullish put spread notwithstanding! 🙂
This website is for educational purposes relating to Elliott Wave, natural cycles, and the Quantum Revolution (Great Awakening). I welcome questions or comments about any of these subjects. Due to a heavy schedule, I may not have the time to answer questions that relate to my area of expertise.
I reserve the right to remove any comment that is deemed negative, is unhelpful, or off-topic. Such comments may be removed.
Want to comment? You need to be logged in to comment. You can register here.