
Another “ridiculous count” (as someone dubbed an entry from last week). Well, in the last 4 days or so, these ridiculous counts have put me up over 35% (in the e-minis, which are the major indices futures). This is pure Elliott Wave with an underlying reliance of Edward R. Dewey’s original cycles data and planetary analysis from the Foundation for the Study of Cycles. Cycles provide the turns in the market, which Elliott provides the price levels. It’s a ridiculously powerful combination.
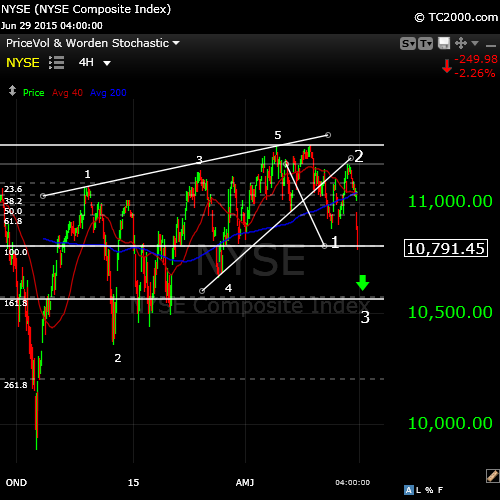
Let’s look at the NYSE (above). This is the clearest example of the ending diagonal in most of the US indices. I’ve labeled the final 5 waves up. The trend has turned down and we’ve had wave one, two, and are in the middle of the third wave. Wave three should be at least 1.618 times the length of wave one. This targets approx. $10,565. in the NYSE. Once an ending diagonal finishes, it reverts to the beginning of the diagonal sequence fairly quickly (the previous 4th wave), which is at $9,886.03. This should coincide with the end of the 5th wave down (we’re targeting the date in the first half of August).
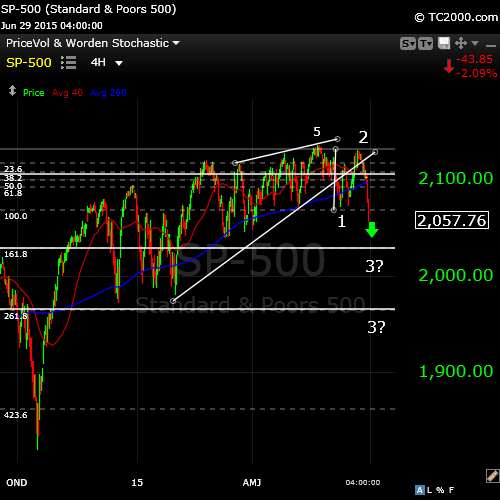
Above is the SP500 with a similar configuration. We’re in the first third wave down, with a target of either $2028 (1.618) or $1966 (2.1618). The fifth wave should eventually reach $1810 before a significant bounce into wave 2. The SP appears weaker than some of the other indices.
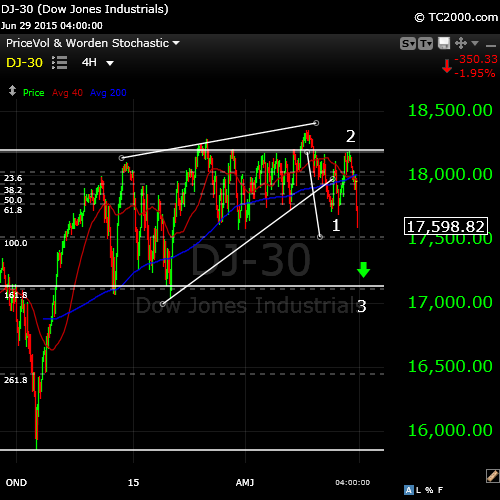
The final chart of the US indices is the DOW. Again, same general configuration. The third wave should get down to at least $17,113.00 and the fifth wave should revert to the previous fourth wave at $15,885.00. For anyone interested in the planetary projection, it’s below.
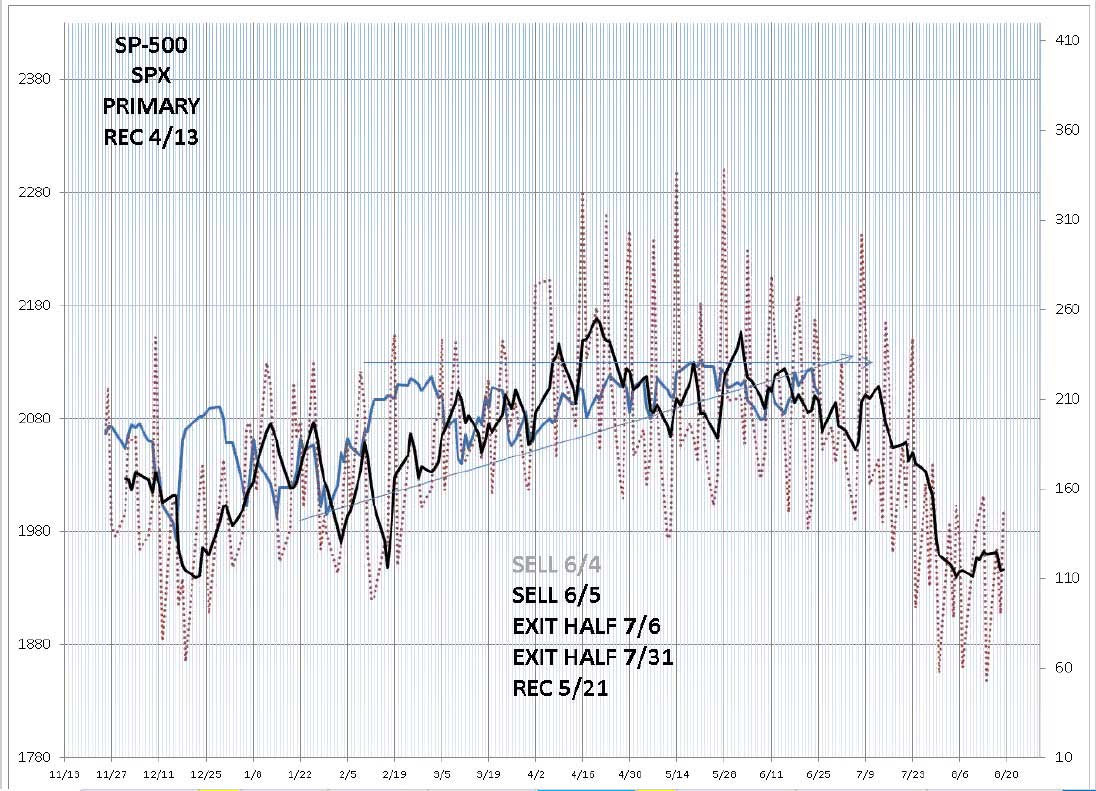
The way to read this is as follows:
The planetary signal is the red dotted line. We’ve placed a 5 day moving average on top (the black line). The blue line is the rate of change (ROC) of the actual SP price data (which follows the SP price relatively closely). We use the ROC to determine trade entries and exits. In any event, the projection is for a strong drop in the SP500 into the end of the first week of August.


Peter, I too have the same “ridiculous count” and want to thank you profusely for sharing your well thought out technical analysis. Your website is a gem in the rough and you’re most generous taking the time to educate others. Well done!
Joel,
Good to know you’re “on the same page.” Thanks!
Yeah, much more work to do on the site. Videos to shoot, it goes on and on …
Thanks for your update Peter,
I think we should have an interim bottom arround full moon July 1-2
This coincides with this interesting site..
http://time-price-research-astrofin.blogspot.nl/2015/06/spx-vs-george-bayer-rule-32-mercury.html
Thank you Peter ….Nick
I see august 10th as a major turn date; coincides nicely with your ‘end of first week in August”.
I agree with what’s above; best and most accurate forecast I can find on the entire web. Won’t miss a weekly analysis from now on.
Thanks.
André
Thanks, Andre,
I’ve actually been posting more often than each week. If leave your email, you’ll get automatic updates the morning after. Once we’ve had a full set of five waves down, I’ll relax a bit more … 🙂
Peter,
So maybe we will see some recovery now until mid July
If I take a good look I can also see an upturn in your model?
Best regards
John.
John,
I put us in the 4th wave of the third. We’re at the 38% retracement level. I expect us to drop in a fifth wave of the third to finish off this wave down (SP target, as I’ve mentioned at 2028 or so). Then we should bounce back up to just about the same level (~2070) we’re at before a larger fifth wave down, which will be a large wave.
Peter
thanks again
So retracment spx Max 2085
Tomorrow mercurius top ( the link I posted )
We will see I will short the DAX again tomorrow when it will top in the afternoon.
John
John,
Let me throw in a word of caution. Looking at the subwaves, it’s certainly possible that we’ve now done a first of the third wave. That would mean we could retrace here 62% rather than the 38% we have today. If so, we’d put in a second wave, with the middle of the third wave still to come. If we go any higher than 2085, that’s what’s happening. Noting that we’re also in a very positive bias period (with the US holiday), I’d say it’s 50/50 at this point. I will know more when I see what the futures do tonight, or even in the next few hours.
Good call, John! You’re a master of the universe.
In fact, we’re heading up. Since the Nasdaq needs to put in a second wave, I project we’re all going up to the 62% marker. We’ll likely head back down on Monday.
I might be to early but Im short… we are down in europe and W.S. is struggeling
No, I don’t think you’re early. There were a few options in terms on the short-term wave structure. I thought we might head up into a second wave, but I’m now back to my original forecast, because the futures simply went to test the top of the fourth wave. I got short again at the open. Target for the SP500 is still 2028. We continue down.
New post out, John. I’m back to the second wave scenario.