
 Way Too Much Bull!
To be successful in trading, one of your hats has to be a “Contrarian Hat.” When everyone else (the herd) is in a trade and positive it’s going to continue, it’s time for you to look for a trend change. When the movement of an asset (eg – the US Dollar) starts to produce major mainstream news stories, you know a trend change is imminent.
The US Dollar has been all over the media this past week; the trend is all but over.
The herd registers extreme sentiment in one direction near the end of a trend. In other words, extreme mass sentiment of this nature is usually due to “everyone” being fully invested in the current trend. Volume starts to dry up, because there are few others left out there who aren’t already committed (both financially and psychologically). We’re seeing historical off-the-charts extremes.
Daily Sentiment Index (percentage bulls)
Here’s a reading of this week’s sentiment (trade-futures.com), along with the level of bullish sentiment:
Gold: 91%
Euro: 90%
Crude Oil: 96%
Nasdaq: 97%
SP500: 96%
US Dollar: 8% (in other words, heavily bearish)
The last few days of this week, we’ve seen a negative NYSE advance/decline ratio even as US equities rose to extreme new highs. The FANGs (Facebook, Amazon, Netflix, and Google/Alphabet) are the major stocks behind what’s left of this rally—market breadth is very low. Along with the sentiment reading his suggests a turn is imminent.
Also note that the VIX levels have been abnormally high in the final stages of this rally. This non-confirmation is typical of the final stages of a trend. The VIXX has also turned up very recently, also telegraphing a change in trend is likely nearby.
Prepare for a Turn
Let’s look at an update of the US Dollar.
I’ve been maintaining for the last couple of years that once the US Dollar found its low (it’s in a large fourth wave—a corrective wave), that it would mark the top of the US market.
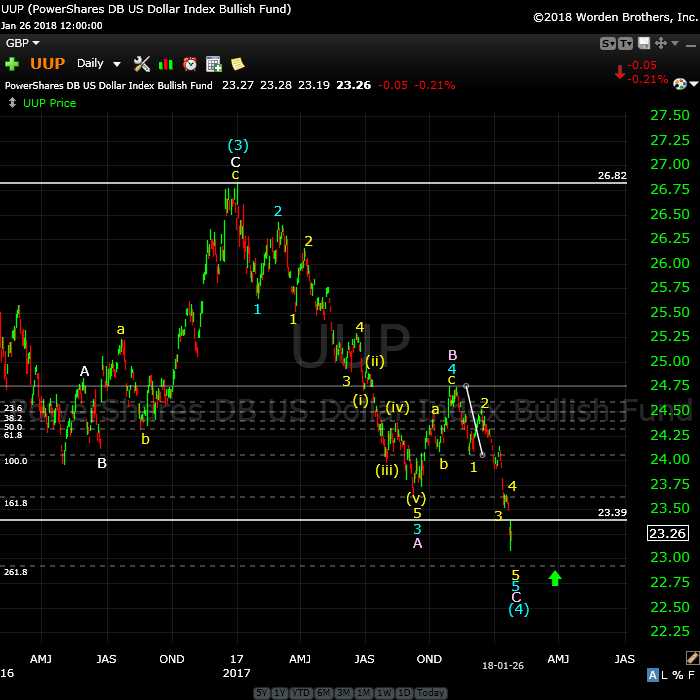
Above is the daily chart of UUP (US Dollar ETF). UUP is representative of the structure of DXY (the US index) and will provide an excellent predictor of the impending top in currency pairs and the US indices.
Last weekend, I wrote here that I was expecting a small yellow wave 4 and then a new low in a wave 5. We now have that pattern in place, but it doesn’t look quite complete yet, although very close. I’m expecting one more smaller degree fourth wave now (up) and a final fifth wave to conclude this trend, culminating in a turn up and leading eventually to a new high above 26.82 for UPP and a similar new high for the US Dollar.
The dotted fibonacci line at about 23.00 could be the final target for a turn.
The movement of the dollar strongly influences the movement of just about everything else, so it’s important to pay attention to what it’s doing on a large scale.
___________________________
DAX has potentially topped and tracing out an impulsive sequence to the downside. Some USD currency pairs appear to have changed trend, while others are working on a turn. Oil is looking “toppy.” Gold and silver are heading down with USDJPY. The VIX has also foreshadowing trouble on the horizon. Even the VIXX is showing signs of a trend change. We’re almost all set—we just need the trigger for the US indices. The trigger is the turn of the US Dollar.
In summary, everything is at an inflection point, or very close to a turn, but a little more patience is warranted. This is a trend change internationally; the US market is only one of a huge array of big players. The world turns …
Calling a Top
There was a period in August 2016 where the US market looked like it was heading for a top. I never did call a top, however. You can’t call a top until you have a first impulsive wave down to a previous 4th wave, a second wave up to at least 62% of the drop and then a new low after that. We haven’t had that sequence, so I haven’t called a top. You’ll know when I call a top … lol.
Once the SP500 went to a new high in 2016 (just that one index), it was clear we weren’t going to top at that point, and I proclaimed that we were going to continue heading up. It was an immediate call because EW is very clear at certain points. Once one index provides a technical breach of a key level, its buddies will follow.
This wave up from 2009 is a B wave, a corrective wave. It’s not supposed to be possible, based on Prechter’s book, which flies in the face of what Elliott believed. I wrote about this in my blog a few weeks ago. I’m one of the only ones that believes we’re in a corrective B wave, which is notoriously hard to predict, because there are few to no rules. They end after 5 waves, but will appear to be in 3 waves. The subwaves are often all over the place and fibonacci ratios are often not hit (contrary to what happens in impulsive waves).
EW is price cycles; it has an extremely weak timing element.
So, due to the weak timing cycle, you have to follow EW until you see the final fifth of fifth of fifth (these levels due to the fractal nature of the market). So, while Bob Prechter (EW’s iconic promoter) has called a top several times, I won’t until I see the pattern I’ve outlined above. It might be late for some, but it will be a “firm” call.
This weekend, we have the US indices finishing the fifth etc wave. Several major stocks have already topped and are in the midst of tracing out the pattern I described above. DAX has topped unofficially, along with TSLA, and AAPL and others.
However, I won’t “call” a top in the US market until I’ve seen the above pattern, because it’s unsafe to short until that pattern has unfolded.
People say I’ve called a top. I have not. I’ve been saying we’re topping, but I also say topping is a process. The US indices are part of a much larger picture. They are one asset class of a worldwide topping process. I expect the US indices to top this week. The signs are all over the place, but the key is the US Dollar.
______________________________
The Tesla Train is Leaving the Station
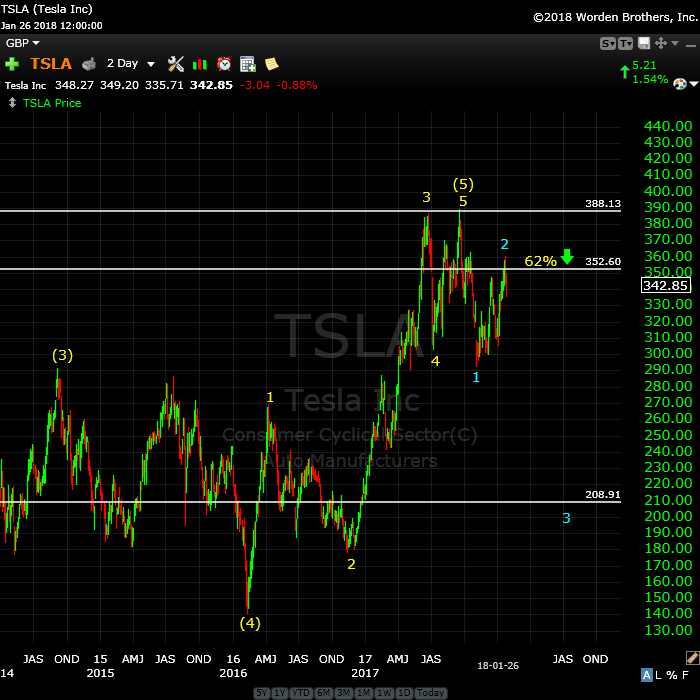
Above is the 2 day chart of Tesla, showing my prediction playing out. The top is not officially in here; we need a new low below ~290.00.
Last week, I suggested we’d head up in a “double-pronged” second wave, which is exactly what we’ve done. We’ve now potentially turned down into a third wave with a target in the 209 area. After hitting that target, we’ll require fourth wave bounce and then a final fifth wave drop to a new low near the 130 area.
There are potential variations to this pattern, but the ultiamate goal for a first wave down should be below 140.00.
Less Expensive iPhones on the Way?
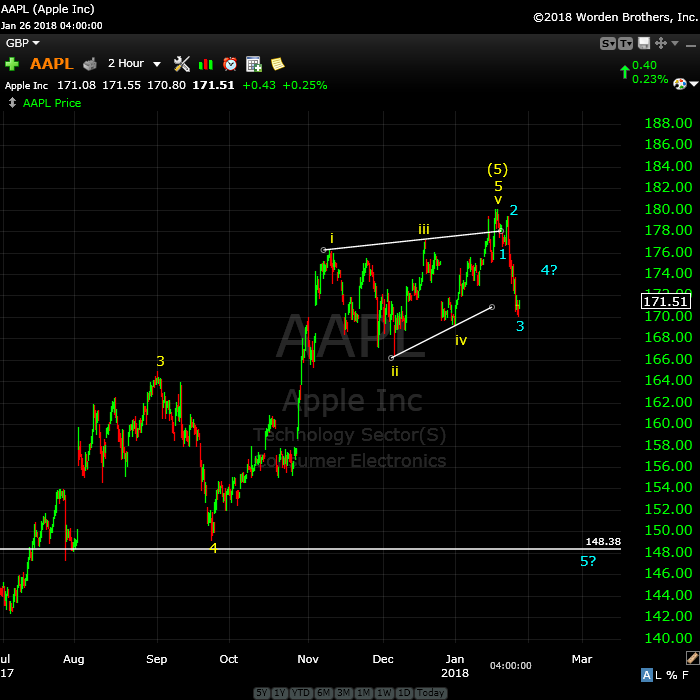
Above is the 2 hour chart of AAPL. Two weeks ago, I predicted a small rise to a final high, which is what happened. It was followed by a turn down.
Now we have what appears to be three waves down in place. Note that the third wave as shown is a fibonacci length of 1.618 X the first wave. I’m expecting a fourth wave bounce and then a large 5th wave down to the 148.00 area.
Ending diagonals always revert back to the start of the ending diagonal, which is the previous 4th wave area (~148.00).
On Deck: Facebook
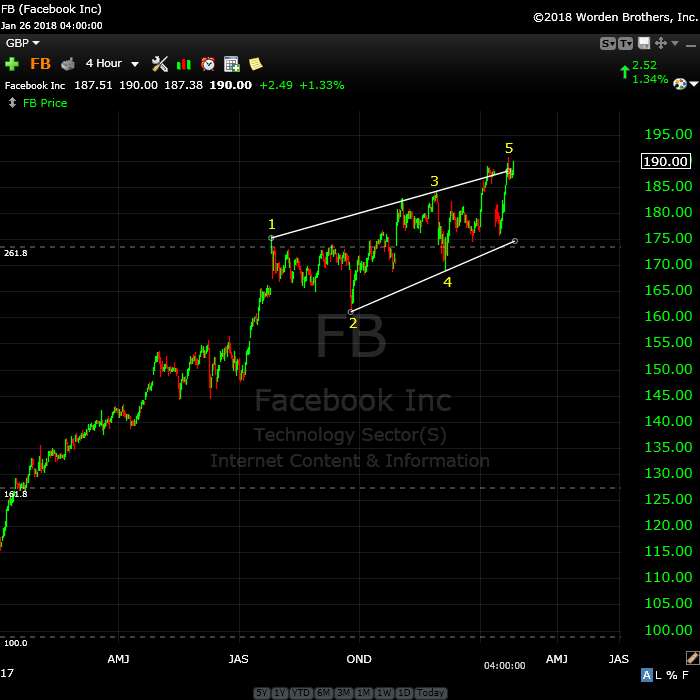
Above is the 4 hour chart of Facebook (one of the FANG stocks). This shows the final pattern I described last weekend, which is an ending diagonal. Ending diagonals gained that name because they form at the end of a trend. You can short a pattern like this when it drops below the lower trendline.
There will be a lot fewer people posting “look at me!” stories in the coming years … somewhat of an understatement, I think. But again, the key to shorting these “whales” is to wait for a complete first and second wave scenario to play out.
__________________________
Changes to the Free Blog
On Friday of this past week, I removed the ability of “transients” to leave a comment without registering. It also means that the information of commenters won’t show up in the fields at the bottom of the blog … because the fields are no longer there!
After several weeks of exhaustive sleuthing and some fair expense, Bluehost (the hosting service I use for this site) finally admitted that there’s a bug on their server. I’ve had two well-know WordPress development companies go right through my site and both came back with a caching problem diagnosis, and that it was not an issue with the site itself.
However, I have to wait (usually up to 72 hours) for them to hunt it down and fix it. Hopefully, that will end the frustrating issue with posting comments. I don’t actually know that to be the case, but we’ve about run out of options. And these developers I’m working with know WordPress inside out.
Registration for Commenting
Want to comment? You need to be logged in to comment. You can register here.
If you register, it protects your information. It also allows you to comment without filling in your information each time. Once you’re registered, simply go to the home page and click on the login link top right in order to log yourself in. Usually, you’ll be logged in for several days before needing to be logged in again.
______________________________
Problem receiving blog comment emails? Try whitelisting the address. More info.
______________________________
Rise above the rest … SM 2
Rise above the rest …I have only ever met a few people who, in their chosen fields (astrology, medicine, music, martial arts, technical analysis), rise above all the rest and you are one of them…you have ‘the gift’…and that’s why I’m a Trader’s Gold member. —SM |
the real deal SM 2
The real deal …‘Educational, insightful and thorough market analysis for all levels of traders. It’s Elliott Wave at its best….Peter Temple is the real deal’ —SM |
A true expert in Elliott Wave FL 2
A true expert in Elliott Wave …You are a true expert in EW analysis. What you provide is not available anywhere and is priceless. Subscription on your services is the best thing I have ever done. Many thanks for your effort to make me a better investor. I now have more trust in my investment decisions. I hope you will continue the excellent work! —FL |
Get an upper hand … JC 2
Get an upper hand in trading …Seeing all the different currency pairs and the wave structures and hearing you explain why this has to do that on a nightly bases gives one a upper hand when trading. Elliott Wave applies to all stock and indices and can be applied to any candlestick chart. If someone ask what you want for Christmas – Tell them a membership to Peter’s “Traders Gold!”—JC |
Tops in your field DZ 2
Tops in your field …You are tops in your field. Tried to follow Elliot Wave international for years. They were always behind the market. After discovering you, I perceive that you are an expert in reading the waves, which puts you way ahead of the rest of your peers. And you can read the Waves like you are reading tomorrow’s financial section. I pray you stay healthy. —DZ |
Couldn’t be happier … KK 2
Couldn’t be happier …The analysis and insight you provide is simply amazing! I’ve been trading the futures and equity markets for well over thirty years and usually average around 5% monthly. Since joining your Traders Gold Service two months ago, that number has better than doubled. I couldn’t be happier.—KK |
The best of them JL 2
The best of them …Last couple of years, I subscribed to several ‘market traders’. You are by far the best of them and the personal contact is awesome. Daily and daily updates are very well written! Besides your expertise in EW, I also like your cycles analysis. Best investment I ever made! —JL |
Have not had a losing week RW 2
Have not had a losing week …I have been with Peter almost a year. The only thing that matters is have I made money with his service. I think I have finally turned the corner using Peter’s EW. I have not had a losing week in the last 5 months. Thanks Peter, for your amazing amount of hard work. —RW |
The Market This Week
Here's the latest daily chart of ES (emini futures)
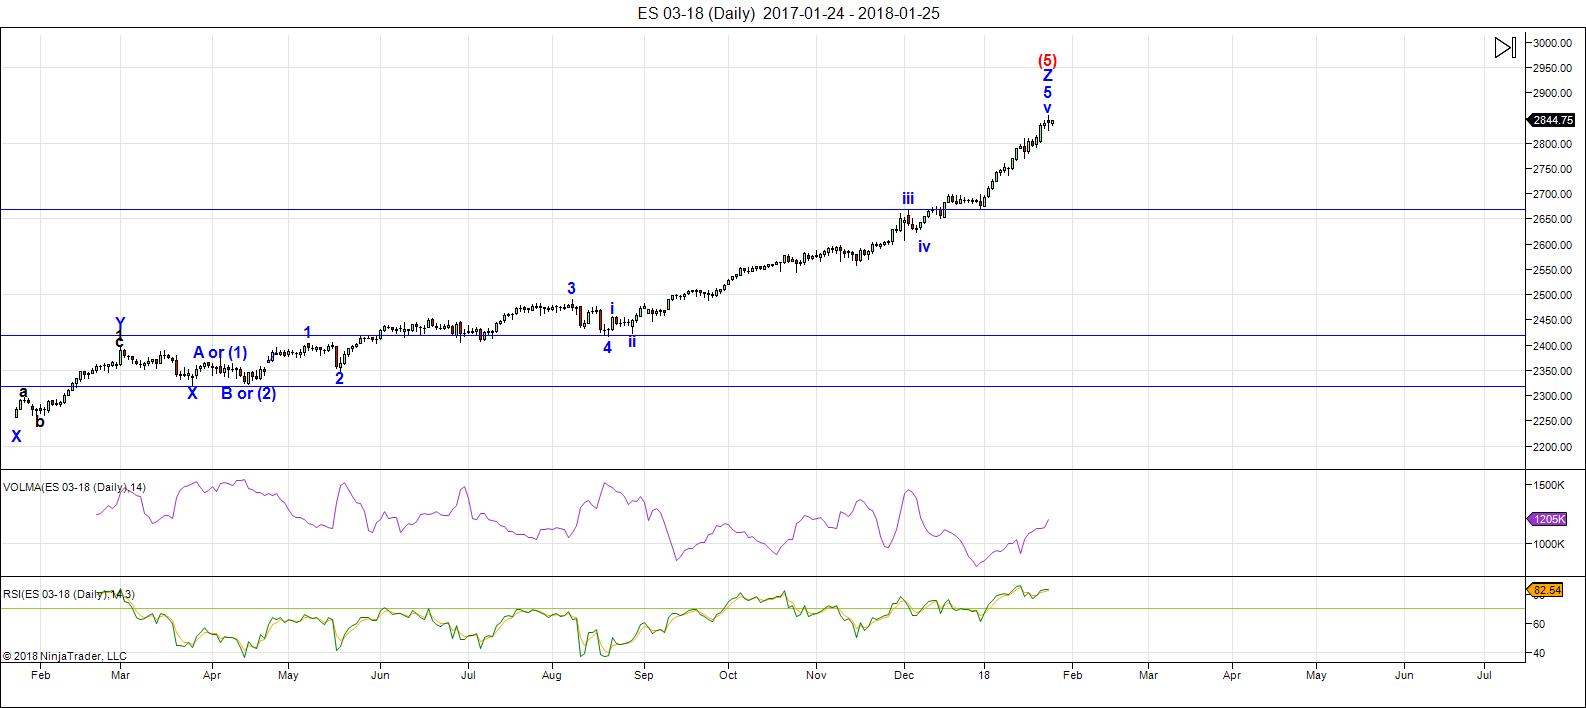 Above is the daily chart of ES (click to enlarge, as with any of my charts).
There have been no material changes to my prognosis. We are at the high. I expect this final wave to turn down imminently.
Another frustrating week as the US Dollar tries to find its bottom. As a result, the US indices have inched a little bit higher in yet another extended subwave of the 5th wave. The underlying technical indicators however, don't support an extended rise.
Volume: It's risen slightly. Bullish sentiment is EXTREME.
Summary: The count is full for the US market in general, except for small subwaves that form the balance of a motive set of waves in SPX and some other major US indices. We're watching for a turn, which will change the trend and end the 500 year bull market.
___________________________
Trader's Gold Subscribers get a comprehensive view of the market, including hourly (and even smaller timeframes, when appropriate) on a daily basis. They also receive updates through the comments area. I provide only the daily timeframe for the free blog, as a "snapshot" of where the market currently trades and the next move on a weekly basis.
______________________________________
Sign up for: The Chart Show
Next Date: Thursday, February 8 at 1:00 pm EST (US market time)

The Chart Show is a one hour webinar in which Peter Temple provides the Elliott Wave analysis in real time for the US market, gold, silver, oil, major USD currency pairs, and more. You won't find a more accurate or comprehensive market prediction anywhere for this price.
Get caught up on the market from an Elliott Wave perspective. You’ll also get Andy Pancholi cycle turn dates for the SP500 for the balance of the current month. There’ll be a Q&A session during and at the end of the webinar and the possibility (depending on time) of taking requests.
All registrants will receive the video playback of the webinar, so even if you miss it, you’ll be sent the full video replay within about an hour of its conclusion. For more information and to sign up, click here.


Hi Peter …. is there an invalidation level on UUP, based on a possible 1 4 overlap ? My sense is that 1 up was back in mid 2012, but I’d be interested in your take on that. For the record, I’m not real optimistic toward a final bottom here. The five waves down MAY be just completing a larger 1 down. TWT. And thanks, as always.
The wave down is corrective, so it can’t be an impulsive first wave. It’s a fourth wave.
Pieter,
Re: the US dollar. Now that I have my charts open … it also could be a second wave, or a fourth wave of the third. I note tonight that it’s overlapped the first wave. But a first it cannot be. If a second wave, it would retrace 62% from the bottom of the first wave. UPP is already at that point. There are several options, but a first wave isn’t one of them.
Thanks Peter,
Excellent piece of work.
Peter T
Is there a chance that the global elite have taken such control of the markets and the dollar that normal behavior of the entities is being controlled? In you opinion could EW or any other analytic method be thwarted because of such manipulation?
If the dollar got pegged to something like gold, and gold was set at consistent price, as in the 30s, then yes. Otherwise, highly unlikely.
Hi Peter, Thanks for all the good information. I am not a specialist on Elliott Wave. But I give you my predictions based on 6 indicators Astrology (special from Holland), pattern of DOW a month before etc. working on it since 2003. Only as confirmation. “This week is Important. The highest High S&P500 for the next months is on monday and than the decline is until around 24 feb, we go up to 11 march and than we have a decline til 29 may. (LOW date has changed)
Manfred Zimmel’s Bradley Siderograph for 2018
https://pbs.twimg.com/media/DSxUIY6XcAA7Xqs.jpg
may not be as simple and straight forward as that…
A nice chart and I have found the website. All I know is that at the end of may we make a LOW with the EU indices. (Famous Dutch predictor I may not sent his name at this moment). My indicators are all different but 4/1 LOW, 29/1 HIGH, 23-25/2 LOW, are confirmed. Now 9-11/3. 9/3 is an important ASTRO turn date. “The people see that financialsystem is not working”. About two weeks from now I have 2 indicators that can confirm if 9/3 is a HIGH. It must be higher than 23-25/2 Than the pattern is O.K. 🙂
Forgotten: 29/1 is the nr 4 of the bearmarket Ending diagonal.
S&P500 week (If this is wrong I will stop it)
29/1 High, 30/1 LOW, 31/1 little recover, 1/2 decline 2/2 LOW in the morning with a recover to the end of the trading hours, then a decline again. If
I eagerly look forward to reading Peter’s post each Sunday and am never disappointed. Always something to learn…
Interesting:
We have a bradley turn on Jan 28 ( geo) and Feb 1 ( helio),
Also moonwobble period with a peak energie on Feb 4…..
So the turn will come for sure…is it before or after the fed… we will see this week.
I bought March puts on the AEX on Friday
“US Reveals an Important Historical USD Hand” – Ed Matts | January 28, 2018
“Currencies and particularly currency devaluations can play a pivotal role in the medium term trends of other asset classes. The issue, most particularly for us at this juncture in the stock market uptrend, is whether any development in US foreign exchange policy has any bearing on the course of the 1929/1987 style stock blowout. The answer is a stunning YES!
It so happens that the 1987 and 2018 USD downtrends are very comparable. Although the scale of the decline, and the significance of official announcements is much smaller in 2017 than 1986, the structure and timing are remarkably similar.
…the highly unusual combination of a falling Dollar, rampant stock market, rising commodity prices and bond yields has only been 3 times in American history 1928-1929, 1986-1987 and 2017-2018…if the USD and stock markets continue with this template — President Trump may not be smiling next year at Davos following a far from immaculate year.”
Rotrot,
I appreciate your update!
if you think Matts’ 1987 “template” has merit, then after a period of consolidation the stock market should blast off to new all time highs before the collapse…just a thought not an endorsement!
Joe,
Reviewed your post of January 5, 2018. You shared a chart which was a composite of 8 or more stock indices…at that point in time we were 5.11% below your upper channel line.
I do not have such a composite index…but shouldn’t we be very to that “upper channel” trend line?
…”close”
I have to say that the 1987 analogy fitted in my eyes, I cant say that we get a 40% decline but for me given the current trending the market is doing that would be the ultimate head fake.
Like rotrot said if this occurs after basing for multi month then up we go fast and for a prolonged period could be past the year 2030.
I don’t think that we will have problems spotting this move terminating also as we have historical data showing just how fast it happens.
I know many including Peter may not like this idea but whilst I would prefer peters view to take place I don’t think we all should not consider the 1987 style move also….I think its prudent.
“Like rotrot said if this occurs after basing for multi month then up we go fast and for a prolonged period”
I DID NOT write that nor did I imply that would happen!
Apologies Rotrot I did not mean that you said it I meant “Ed matt’s” opinion.
the following is a characterization offered by Martin Armstrong: “2018 is a Panic Cycle Year”…hopefully the knucklehead factor has been eliminated from this public blog…if not, they will be dealt with appropriately!
Rotrot can you expand what you mean by this post. I am not aware of Martin Armstrong’s “panic cycle” so far there is no panic just a steady grind up.
I look forward to hopefully you explaining what you mean. Apologies if what you wrote is obvious.
https://tinyurl.com/ybljl492
https://tinyurl.com/yb4r2fp3
https://tinyurl.com/ycp5g78e
https://tinyurl.com/y9ng6rt9
“Cracking the Bull Market? Or Setting the Stage?” – Martin Armstrong | February 2, 2018
https://tinyurl.com/yaxdkt96
Market will start dropping only when most of the people is shouting bullish. Vice versa, market will ONLY grow higher when everybody is preparing for TOP.
ES in da mornin’……………………………….and remember………..”ENJOY!”
https://invst.ly/6gwzs
will we see overlap?…………take your bets now……https://invst.ly/6gyvd
Energy chart for this week attached
https://ibb.co/mOBL8b
Thanks Peter 🙂
Ed
We were with in a very close proximatey to that upper channel on Friday .
I’m in a class today yet from my memory we were less than 1/2% and did not
Hit the target . I’d rather not see the target hit and prefer to consider the top in place.
I agree with Peter .
We need 5 waves down followed by a 3 wave structure up before concluding a top is in.
I took a speculative trade Friday near the close as a hedge yet I have not
Put on any outright short positions .
ok, we have overlap……………….btw…………..does anyone knows what is “supposed” to happen with an “overlap”??
anyone?https://invst.ly/6gzcf
https://invst.ly/6gzdd
Cannot be labelled an impulse. Could be ED. 🙂
well……..well……………………….. “WELL”………
look what the cat [and a chipmunk in a wheelchair] dragged in……………..
so verne………………… no impulse huh!!! are you “sure” about that……….
…………huh………………. what if it is an “impulse”……….. ???? :-))
https://invst.ly/6gzvt
you mean like this verne??
https://invst.ly/6gz-f
Possible…owing to 4 overlap… 🙂
ES end of day – https://invst.ly/6h2fw
close up – https://invst.ly/6h2g6
As expected, the battle for control is unfoldimg in the futures market. A VIX gap past 15 tomorrow and all the years of brazen bankster BS comes to a screeching halt. I hope for the sake of all the smug longs that they can at least get temporary control of this beast. Stops will not protect you when price gaps past it and if you did not specify a limit price for your exit, you will be filled at the best available price below your stop so be aware…
I see 14.65 today, Verne. Still holding out for 15?
Where are the knuckle heads tonight?? lol
…………so ………………”yes”……………………technically ……….it WAS me that was playing that online “trivia” game…………………………..and ………….’YES’………….IT WAS ME…….
that answered …………”blue”…………………when asked “what was the primary color of little red riding hood’s outfit”????………………………………………………………..
smarty pants – i was right!………………………everyone needs a change of clothes YOU KNOW!!
https://invst.ly/6hba2 [and for the public record – i did rejigger the count]
aaand…..after the open……….. ES https://invst.ly/6hd4e
wow, that was quick….. https://invst.ly/6hdh3
next 2759 level………. https://invst.ly/6hdix
hmmm…..verne, joe, jody………what say youeth?? speaketh the truth!!
now 16:35 Berlin time – if I follow my indicators we make a slowly recovery til the end of closing S&P 500 to day. Than a little decline to start 31 jan. The whole day seems to be very slowly UP. After closing on 31 jan S&P 500 we go down until friday morning. Then we start up till the end of the trading of S&P 500. And go down again. Be carefull
willem,
this makes sense, as the FOMC rate decision is tomorrow, and the fed displays absolute control around FOMC day!!
The trump bull is becoming the trump bear. He shalt not be able to prevent it….after a final surge to 2900 ES to form the ultimate bull trap.
Yep. I think one final ramp to the short trade of many lifetimes…
so………………….it is impossible to “grasp” the charting of the vix at the daily time frame or below………….
i have ventured a try………..at the monthly time frame……….. so be kind…….
and………………”BE WARNED”……………………….. oh yes………..and …..”ENJOY”!
https://invst.ly/6he23
Yep! ?
…..”would you like some ………..shredded………ice berg lettuce to go with that side order of ……..trumptonian “ego”?? …………i mean, you must admit – both have these “orange” undertones………. the perfection and sophistication of ………….”a la page”!
https://invst.ly/6hf7u
throwin some spaghetti!!
https://invst.ly/6hgap
Could it be that DJI 26,616.71 will be THE number?!
Seems to remind me of another famous group of six lows, lol!
…..hmm…….”famous group of six lows”????………………………. ahhhh…… I would like to buy a “vowel” please verne ………………… and, I would like to solve the puzzle for all the money please verne…………………… “famous group of six lows??” – – – verne…….is it, peanut butter and jelly ???
https://invst.ly/6hhmt
March 2, 2009, SPX 666.79…
verne,
i thought it was 3/6/09 – that is 3, 6, 9 [tesla’s numbers]!!
Yep, March 6, not 2….(chart was on weekly! 🙂 )
I need to see a weekly reversal , that is to say a poke below last week’s low.
On the road traveling so no data to get detailed with .
What would be nice to see is a new weekly low this week below last week’s low
And then using weekly bars , watching the market come back to the mid point of that range
Before heading lower .
That is not Elliott wave theory at all but it would help to define the present cycle for me .
The Jan 26- Feb 2 time frame for a high I’ll consider as accurate but there are other minor
Cycles I have a couple issues with .
I still can’t rule out this as part of a sideways move in a broad sense which lasts into mid Feb
Or early March .
That said it appears the top is in place .
🙂
My definition of a sideways move :
A series of waves 1 an 2 or a and b
Or a narrowing range consolidation .
https://www.youtube.com/watch?v=TFVFG4WGRXM
Peter G,
How your close only line chart of the S&P 500 that you posted back on January 19th looking to you? You had simultaneously posted a chart of the A/D line…that showed negative divergence.
That upper trend line on the S&P repelled price lower after a brief excursion above it. A poster with a very long name which I will refer to as “Q..26” says maybe 2900;in the ESH18. That would give you the divergence you would like to see, right?
Joe, however, does not want to see new highs (I think)…Peter T with whom I agree thinks a Top occurs this week! Any thoughts?
Keeping in mind how fraught with peril market prognostications have been of late, I venture a guess that we do not yet have a final top. Here are three reasons.
STILL waaaay too much bull! Traders everywhere are still crowing about the great buying opportunity, piling into XIV, V bottoms, yada, yada, yada!
Second, VIX B bands did not expand to contain price the way it will when it heads for the moon after the top is in.
Its movement above the upper B band has for quite some time heralded an at least interim bottom.
The third reason is related to the first. Granted a number of important trend lines were violated in several indices on the recent impulsive decline, the move is nothing like what we are going to see after the final top is in. I think the first impulsive wave down after the top is going to be heart-stopping, and will make the election night decline look like a blip on the screen. I will gurantee you this one thing: the first impulsive wave down after the top is not going to issue in giddy bulls falling all over themselves to BTFD as we are now seeing. In fact, the ferocity of the decline will bring the fear of God back to the markets, and ensure ultimate failure of the bankster second wave dump.
I suspect we may have the A wave of a fourth complete, with one more high to come….stand by… 🙂
verne,
did you happen by the blogspot of the ponziworld yesterday? he posted a simply shocking chart…………… after seeing – please revisit your w4 thesis…………..
https://1.bp.blogspot.com/-3JQuzb8nDCk/WnCpCSUEbnI/AAAAAAABcoQ/-kwuDdBskFwxmlK-vvNCwKfvVcqldZvXwCLcBGAs/s1600/permanent_plateau.png
Yikes! Just a bit extreme doncha think?? 🙂
I would be convinced with a third wave down next…
SPX has entered the zone (2839) where if this is W(4) of the 1st leg down we should see a reversal. If markets close red today, top is in. IMHO
jody,
ES shall be …………..”red”………… by divine instruction – https://invst.ly/6htaa
[me count is a little different than yours.]
Good, Mr. C.
Thx.
or Ms. C. … I can’t remember which …
Men spell Jody with a Y women with an i or ie..
Well, I was pretty sure. Didn’t want to be a part of the me too movement …
So we have what’s trying to be a top … unofficially, of course.
ES update – with a nice big dollap of clotted cream!
https://invst.ly/6htur
You would be correct here if you got rid of the amber labels.
bite your tongue peter!!
“amber”………..is sooooo 2018!!! :-))
OK … orange, after 3-4 cycles of “heavy wash” and double spin cycles …
Uh Huh! 🙂
the dreaded “zone of 4”!
https://invst.ly/6hu5n
is the ES in a head and shoulder pattern?
https://invst.ly/6huep
Looks like you need a bit of a sloped line to better connect the shoulders but I doubt it would make a big difference to the measured downside distance…. 🙂
Ed, per your request:
https://imgur.com/a/Z4UWU
And here is an alternate interpretation of the channel, Ed, using the April ’16 high rather than the July ’16 one. The red lines are a closing price channel while the blue ones are intraday. The red ones were virtually exact at the high while there was a slight overthrow on the intraday channel. This is the same link but it should now show the second chart below the first to appreciate the subtle differences…
https://imgur.com/a/Z4UWU
Peter G,
Thank you for the charts! I hope others get as much out of your posts…as I do!
Your posts are thought provoking and appreciated!
no marshmallows…….. peep……….
sorry, the new low today was NO w5………
https://invst.ly/6hymm now see the 1 min time frame for analysis https://invst.ly/6hyq7
summary – this is an incomplete wave. If we go up tomorrow, it will represent a B wave……and an A wave completed today because the w5 was corrective.
or
summary – this is an incomplete wave……if we gap down tomorrow, it will represent a completion of the series of 1 and 2’s that was created at end of day.
methinks we have
ONE ……………more……………high to be made…”th”…….
https://invst.ly/6hzjb
……………………..”as if”……………………………………!
https://invst.ly/6h-fq
Fascinating!
No doubt many traders jumped on the end of session “reversal”. I didn’t “buy” it…. way too cute!! 😉
verne,
morning ES update……..
looks to me………………like clear skies, with a side order of sweet onion rings………….
https://invst.ly/6i320
With a nice sprinkling of Tumeric, thank you!
command………..we have “ignition”……………… 5…..4…3…2….
https://invst.ly/6i6b3
so , a back of the napkin type calculation has us break 2800 to keep this whole 5 wave – W1….in the running.
why do i say this?……………. the channel would look “odd” if we had “only” one touch of the down channel [the channel emanating from the top]….. only “one” touch…..on the w1,w3,w5 side of this same channel………on the other side we have w2 and w4 touching………………
soooooooooooooooooooooo…………. thoughts, arguments, discussion??
then what are you hangin’ around here for??…. huh! :-))
https://invst.ly/6i6ia
potentials – ONLY…………..”CAPISCE”!!!!!!
https://invst.ly/6i6nd
yeeessssss maaaa……. w5 can count impulse……………………….
yesssssssssss maa…………………………… extrapolated using my fib ruler…….
yesssssssssssssss mom……………………….. i brushed my teeth
yesssssssssssssssssss – mother……………………. i cleaned behind my “f’ng” ears
https://invst.ly/6i7cs
verne?………jody?………liz?…………..
what th??????? crickets…………….hmmm………….
was it an ELE??? [extinction level event]……………….you mean i am the …..ONLY….
luri left to roam this fine planet…………BY MYSELF!!!!! waaaaahoooooooo!!!!! oh yeah……………………………
Well…Mr. Market has spent the last few days severely spanking the BTFDers. Let”s see if we now get a bona fide plunge that really makes em squirm! Hyuk!
Luri, the fractal is still on. https://worldcyclesinstitute.com/the-daily-vigil-focus-on-the-us-dollar/comment-page-2/#comment-27119
A swing low possible tomorrow end of day but if it becomes another chop day then my bias is 6th, 7th or 12th. From a swing trading point of view, there is nothing attractive to buy akin to the Dec. 1 low last year. While my hypothesis are the dates above as possible short-term double bottom lows, I think I’ll wait mid-March.
verne…..
so, we continue to see price consolidation at the bottom of range of the recent price drop.
this is a “continuation” behavior, meaning that prices are looking for a way to move lower……….. we have seen this price consolidation behavior “ad naseum”…….at the top of the range, on the uptrend.
https://invst.ly/6idks
Yep. I love these triangle formations as they are great bread and butter trades…very predictable! 🙂
I’m off of west coast heading to Honolulu .
12 days of for the most part no data.
Left my hedges in place and have not gotten short .
I favor that a top is in place and for now I have a few mixed thoughts.
A high to low would have been ideal from mid jan new moon
Into this up coming Feb 15 solar eclipse. That mid jan new moon though
Was not a high. Now we are coming out of another cycle high
Which was jan 26- Feb 2. I am not confidant on this last cycle period
And I have been out of touch to make any solid bearish case .
The next time period becomes early March to April 4 th .
Early March to April 4 should be a 1 way directional move
That is fairly to very strong .
I do not have a 10 day range to go off of , I don’t see a weekly
Reversal as of yet . I don’t know or have a solid wave count to
Go off of .
I’ll enjoy some sunshine in about 3 days as we head further offshore .
Looks like Valentine’s day in Honolulu .
Bitcoin , utilities , interest rates, us dollar index have much more
In common with the cycles I’m following yet the Dow as much as
I have a bearish bias I cannot at this point commit to an aggressive
Bearish stance .
Feb 15 is the most likely turn followed by March 1 and followed by
April 4.
Good luck everyone 🙂
testing………………”testing”………………1….2…3
ahhh, liz – it looks like your fractals are solid as per the chart…..
we may be in the small w5 completing today…..
https://invst.ly/6iio8
in a world of caramel corn, and cotton candy ………..i ask the question, that must never be “asked”…………………… why oh why??? is this impossible?? https://invst.ly/6iksd
is this a cycle sized C wave or is it a mouse?
ask yourself this question………………….
this FBI memo release scheduled for today – in a world where truth bombs are being detonated………………
what better way to distract from the full impact of this memo “release” – than a good ole fashioned mini crash of the markets???
so is the above chart really so “unthinkable?”
OK……………..WAKE UP Y’ALL………………………
THIS IS ALL ………….TOO – TOO………….TO ORDERLY, TO MANAGED………….WHERE THE IS THE FEAR!!!!!!!!!! ………………………………….. I WANT TO…………….”SMELL”……….THE FEAR!……………
I UNDERSTAND ……….IT SMELLS LIKE VINEGAR AND SULFUR!
Don’t worry…true fear is a’comin’…in the form of Diamond futures down 2000 points. Let’s see ’em BTFD THAT!! 🙂
This website is for educational purposes relating to Elliott Wave, natural cycles, and the Quantum Revolution (Great Awakening). I welcome questions or comments about any of these subjects. Due to a heavy schedule, I may not have the time to answer questions that relate to my area of expertise.
I reserve the right to remove any comment that is deemed negative, is unhelpful, or off-topic. Such comments may be removed.
Want to comment? You need to be logged in to comment. You can register here.