
As the World Turns
We’re at a full Elliott Wave count in the US indices, as we are in exchanges around the world. The next major move is to the downside. They may not all turn on the same day, but they should turn more or less together. Below is a selection of exchanges from countries around the world showing similar counts that suggest we’re extremely close to a major change in trend.
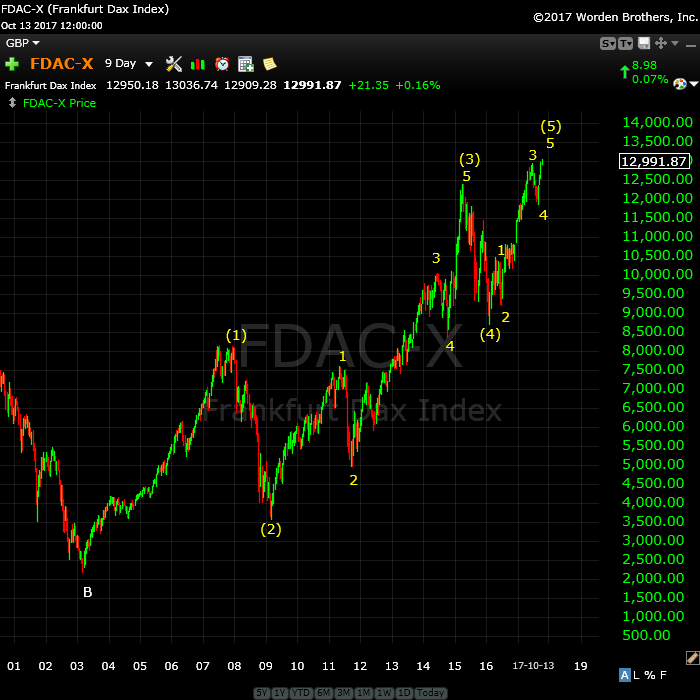
Above is the 9 day chart of the DAX (the Frankfurt exchange) showing the 5 wave pattern that’s near an end. Five waves up ends a trend. Look for a change of trend in the very near future. The first wave down will very likely bounce at the previous 4th wave (around 11,868) allowing for a short entry after a 62% retrace.
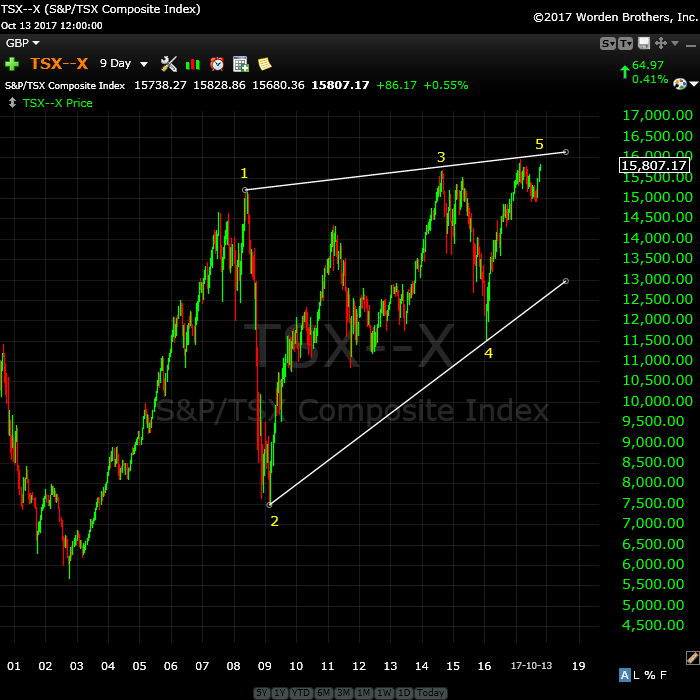
Above is the 9 day chart of the TSX (Toronto) showing an extraordinarily bearish ending diagonal. This exchanged is poised to implode shortly.
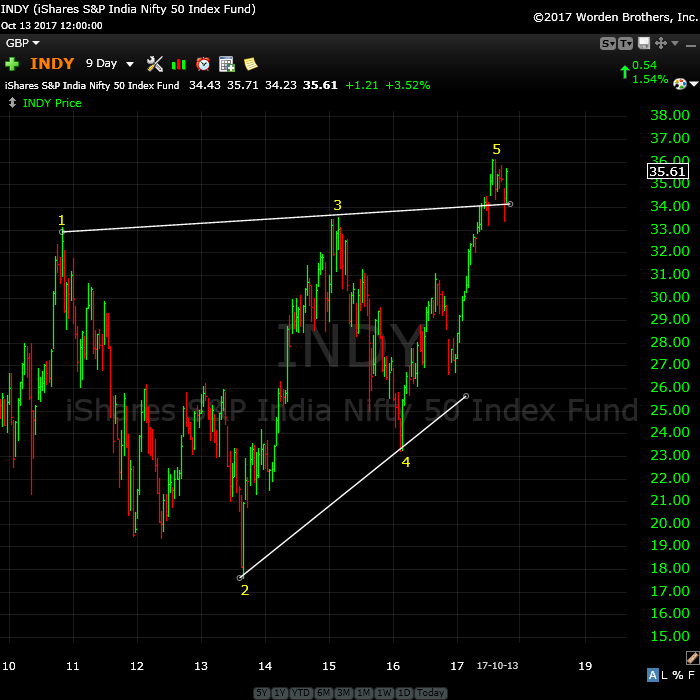
Above is the 9 day chart of the Nifty 50 (India) showing a similar pattern to the Toronto exchange. Ending diagonals are ending waves. This one is virtually complete with a “throw-over,” a very typical extension above the upper trendline. Ending diagonals also have dramatic turns in the opposite direction once complete.
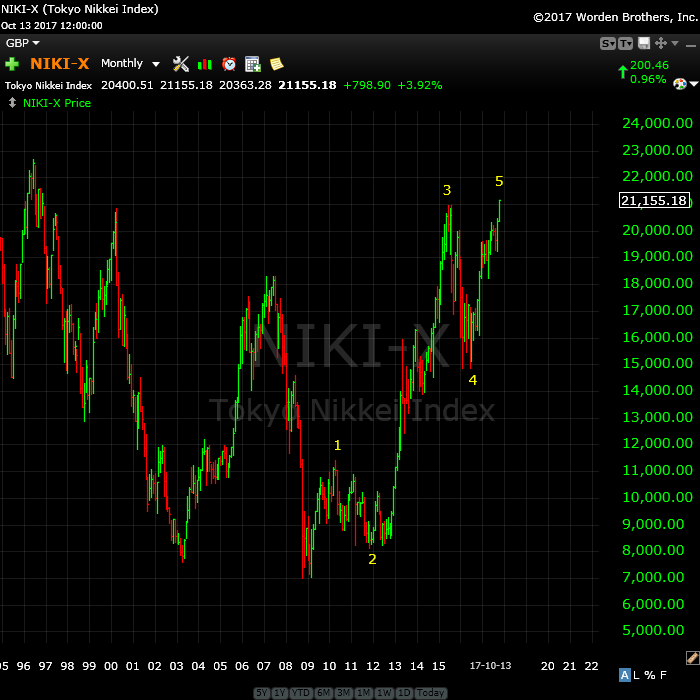
Above is the monthly chart of the Nikkei (Tokyo) showing a five wave pattern to the upside. Note that the fifth wave also has 5 subwaves within it. This exchange is also getting very close to a change in trend.
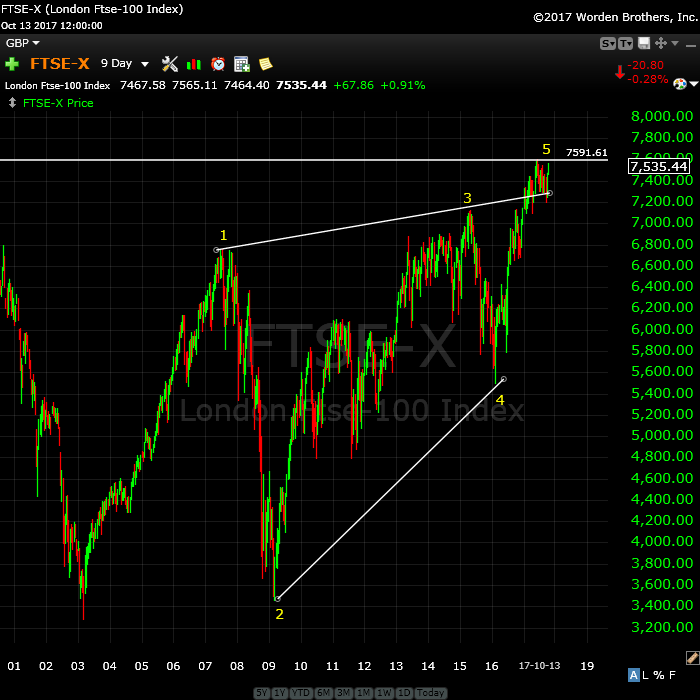
Above is the 9 day chart of the FTSE 100 (London exchange) with a similar ending diagonal pattern
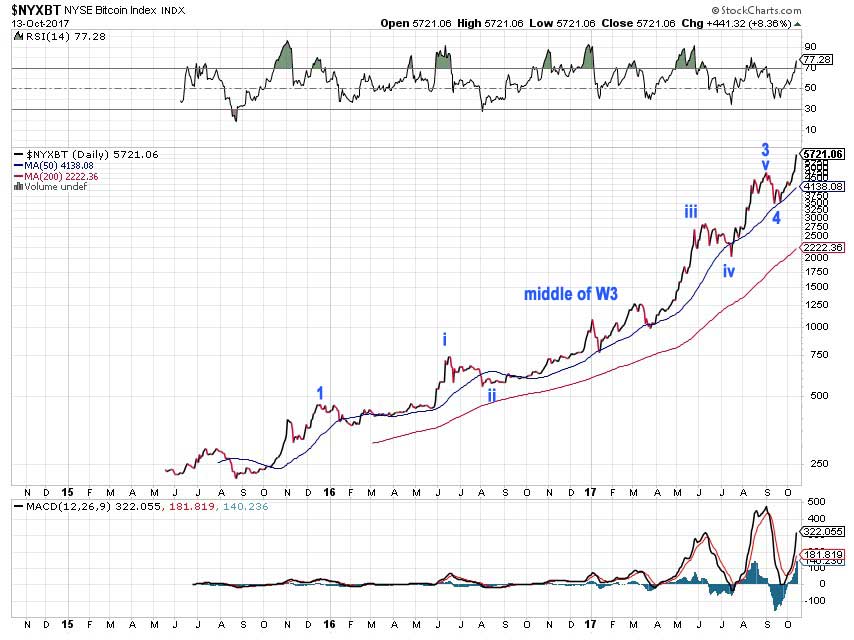
Above is the daily chart of Bitcoin showing the progress we’ve made in reaching for the sky in the past two and a half years. These are the kinds of speculative bubbles you get at the very top of a major international bubble. The euphoria at the tops of these 500 year cycles sends people into a greed frenzy, as they search for returns that have become elusive as the international indices near a top.
In analyzing this “rogue” asset, my “marker” (the pattern that gives me orientation within the larger pattern) is the two wave pattern in the middle of wave three. From there, it’s a relatively simply process to “fill in” the adjacent labelling.
Let’s look for a crash of the entire bitcoin world as the markets around the world begin to implode together. This asset is not quite done, but it’s in the fifth wave. We may see even more of a “blow-off” wave here as this final fifth wave reaches its apex.
Looking ahead, with all these indices coming down together, the momentum to the downside is going to be strong.
_______________________
Rise above the rest … SM 2
Rise above the rest …I have only ever met a few people who, in their chosen fields (astrology, medicine, music, martial arts, technical analysis), rise above all the rest and you are one of them…you have ‘the gift’…and that’s why I’m a Trader’s Gold member. —SM |
The best of them JL 2
The best of them …Last couple of years, I subscribed to several ‘market traders’. You are by far the best of them and the personal contact is awesome. Daily and daily updates are very well written! Besides your expertise in EW, I also like your cycles analysis. Best investment I ever made! —JL |
A true expert in Elliott Wave FL 2
A true expert in Elliott Wave …You are a true expert in EW analysis. What you provide is not available anywhere and is priceless. Subscription on your services is the best thing I have ever done. Many thanks for your effort to make me a better investor. I now have more trust in my investment decisions. I hope you will continue the excellent work! —FL |
Have not had a losing week RW 2
Have not had a losing week …I have been with Peter almost a year. The only thing that matters is have I made money with his service. I think I have finally turned the corner using Peter’s EW. I have not had a losing week in the last 5 months. Thanks Peter, for your amazing amount of hard work. —RW |
the real deal SM 2
The real deal …‘Educational, insightful and thorough market analysis for all levels of traders. It’s Elliott Wave at its best….Peter Temple is the real deal’ —SM |
Tops in your field DZ 2
Tops in your field …You are tops in your field. Tried to follow Elliot Wave international for years. They were always behind the market. After discovering you, I perceive that you are an expert in reading the waves, which puts you way ahead of the rest of your peers. And you can read the Waves like you are reading tomorrow’s financial section. I pray you stay healthy. —DZ |
Get an upper hand … JC 2
Get an upper hand in trading …Seeing all the different currency pairs and the wave structures and hearing you explain why this has to do that on a nightly bases gives one a upper hand when trading. Elliott Wave applies to all stock and indices and can be applied to any candlestick chart. If someone ask what you want for Christmas – Tell them a membership to Peter’s “Traders Gold!”—JC |
Couldn’t be happier … KK 2
Couldn’t be happier …The analysis and insight you provide is simply amazing! I’ve been trading the futures and equity markets for well over thirty years and usually average around 5% monthly. Since joining your Traders Gold Service two months ago, that number has better than doubled. I couldn’t be happier.—KK |
The Market This Week
Here's the latest daily chart of ES (emini futures)
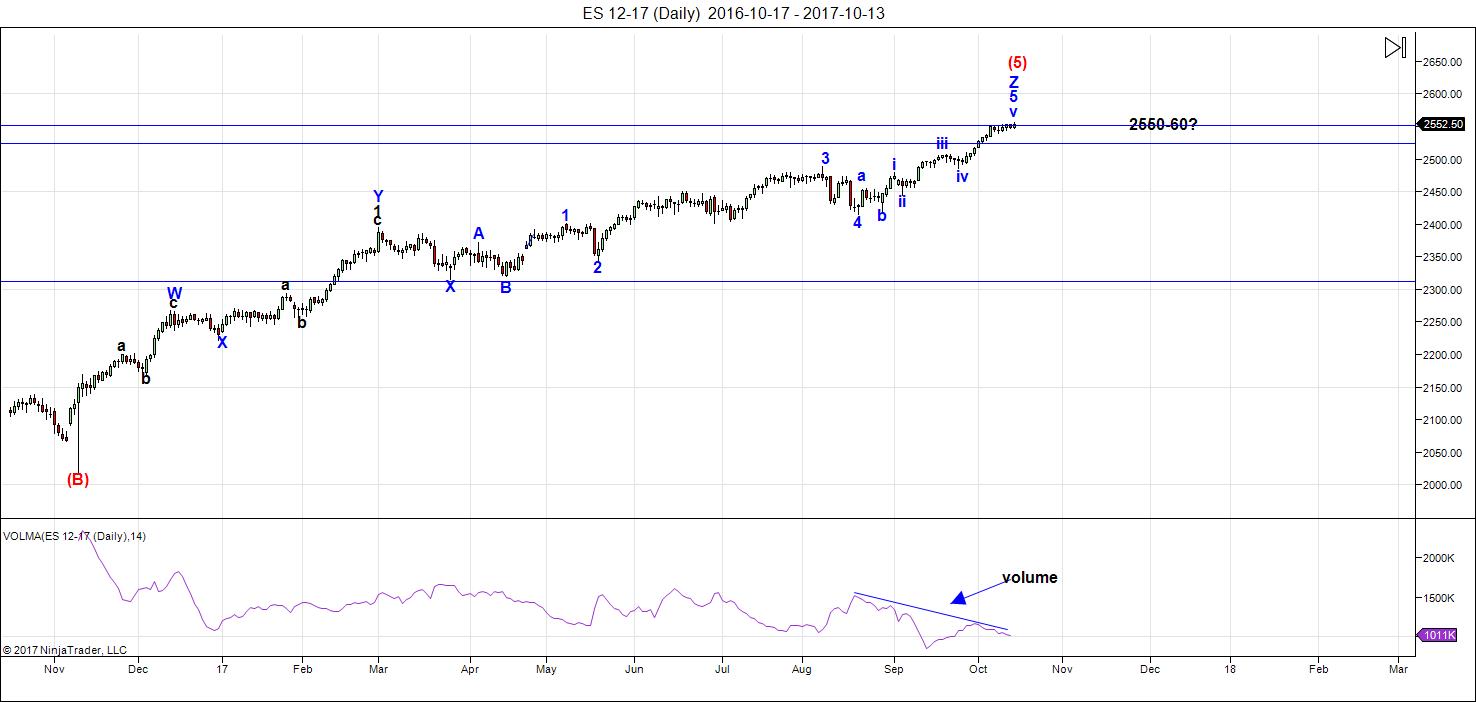
Above is the daily chart of ES (click to enlarge, as with any of my charts).
I have a full count on ES/SPX/NQ/NDX, etc. There are major turn dates this week and next. My preference is for a turn down early this coming week.
That doesn't necessarily mean we're going to drop on Monday, but the likelihood of an imminent drop is high. Turn dates don't provide direction, but they're strong indicators of a change in trend. I view them as secondary indicators to Elliott Wave analysis, which consists of an analysis of wave structure, wave count, and price level resistance (based upon fibonacci ratios). In this case, there is no more "up" available.
The wave structure on the 15 minute chart shows a setup for one more high, but it's the last wave in an ending diagonal and the maximum high (based upon the length of the third wave of the ending diagonal) is 2557. NQ is also at the top of a fifth wave of a larger ending diagonal with about 20 points of "play" to the upside.
With Elliott Wave, the confirmation of a change in trend is one wave down (in 5 motive waves, in this case) to a previous fourth wave level, followed by a 62% second wave retrace in three waves). A turn down there to a new low will confirm the change in trend.
Volume: Note that for some time now, volume has been expanding with selling, and drops considerably when the market heads back up. This is yet another signal of the larger, impending top. I've been predicting for quite some time here that it will drop off suddenly towards the top of the final fifth wave top. This it has indeed done.
Summary: The count is full. We're waiting for a turn down and a subsequent confirmation of a change in trend.
___________________________
Trader's Gold Subscribers get a comprehensive view of the market, including hourly (and even smaller timeframes, when appropriate) on a daily basis. They also receive updates through the comments area. I provide only the daily timeframe for the free blog, as a "snapshot" of where the market currently trades and the next move on a weekly basis.
______________________________________
Sign up for: The Chart Show
Wednesday, October 25 at 1:00 pm EST (US market time)

The Chart Show is a one hour webinar in which Peter Temple provides the Elliott Wave analysis in real time for the US market, gold, silver, oil, major USD currency pairs, and more. You won't find a more accurate or comprehensive market prediction anywhere for this price.
Get caught up on the market from an Elliott Wave perspective. You’ll also get Andy Pancholi cycle turn dates for the SP500 for the balance of the current month. There’ll be a Q&A session during and at the end of the webinar and the possibility (depending on time) of taking requests.
All registrants will receive the video playback of the webinar, so even if you miss it, you’ll be sent the full video replay within about an hour of its conclusion. For more information and to sign up, click here.


short based on cash dow at 23228 and ill use a tight stop .
will probably take a few tries given the futures have been down all night
The fifth is not totally done yet.
peter,
as you see it – are we close to the final squiggles being in place?? or can it further sub-divide and extend??
2575 coming up quicker than I thought
Out
for better or worse im not liking this .
back in a few hours to check the market and
also wait to see a minor 5 wave move .
i cant rule out a new all time high in the dow
based on a retrace in the futures .
23310 is the next spot for me then the higher levels
i posted a few weeks ago.
time wise we should be done
If we can get 2575 on SPX, a bigger wave iv would be very near, IMHO.
I today have taken the plunge. Rather than shorting the indices, I think the best risk reward rato in the market right now is in being long volatility. Buying VIX Feb, 2018 9.00 strike calls for 5.00 per contract. This is the biggest trade I have made in quite some time. I opened one half my full position and will add the second half with any VIX close above 13.50. The end is near! 🙂
Best of fortunes everyone!
I like your idea Verne, but I will wait it out for another two days to look closely at those vix calls.
Some one just bought one million vixx calls this morning. I will rethink in buying them early next week.
for the day
aeis, diod, nvda, txn, msft made new all time highs .
Cash dow higher levels now land into the 23367-23471 range
and is the most important resistance from my point of view.
The weat , ung purchase made new lows yesterday
and today a slight upside bias yet closed down on the day ( the combo of both )
Last thought in relation to this market and Venus and mercury and the sun .
mars Uranus cycle now points down yet it obviously did not turn the market down or we would have had a down day today . The mars Uranus opposition
is dec 1st which is the major cycle high, yesterday was a sub-cycle high.
with the market accelerating up or at least appearing to be i must assume it
is mercury Venus and the sun coming closer together which is driving a panic
move upwards .
NYA has higher targets just as the dow . which index calls the high i do not know
yet we should see next week since the dow is only 30 points from its lower
target range .
enjoy the weekend 🙂
While I want to be disciplined about trade entry, I suspect I am being quite conservative. As a long time watcher and trader of volatility, I am intrigued by its refusal to make a new 52 week low in the face of the relentless barrage of new all time highs in so many indices. I see a clear break and back test of a long holding resistance downtrend line and a rounding bottom over the last several weeks. While I risk being a bit early, I know from past experience trading bear markets that the truly serious returns are made by being positioned well before the herd realizes the bear has awakened. For option traders like me, exploding premiums in some ways makes trading bear markets more challenging than one would suspect. The final piece of the puzzle for me was what is not wholly unbridled and unrestrained bullishness by the masses, and lunatic prating about DJI 40,000.00 and SPX 3750.00 before the bull run ends. Someone posted that they were going to be 100% long come Monday. I closed my last long trade in the form of 30 222 strike DIA calls expiring tomorrow and will be in cash which will now be steadily deployed into long vol positions which I plan on rolling forward on vol pullbacks going forward. It is entirely possible that I may be a bit early, but I for one have seen enough to comfortably take the plunge. I would reconsider with a close above SPX 2580 on high volume.
See ya on the other side (hopefully!)
I wish you the best of luck Verne. It would not surprise me to see the spx 2585 on very low volume thou. Hopefully I am wrong.
You are probably right. Not only is sentiment quite bullish, some indicators are as well to be quite honest. It is also true that indicators are broken. The series gaps we have seen as I indicated before, come at the start, and at the end of extended bull run. In that sense the DJI 40,000.00 could cite that as a basis for their wild optimism. I happen to believe these gaps signal not the start of an extended bull run, but rather its end. I could be wrong. A new all time high in DJT would negate the bearish key reversal day, provide a DOW theory bull market confirmation and once again demonstrate this market’s amazing ability to negate bearish signs. Strange times….
I analyzed many indices to see which one works best. But I can’t seem to find the right one. So I created my own index using market leaders. Companies like GS, Amzn, AApl,Goog,Cat, MCD and FB seem to lead the market. When they go, everything goes.
The average of 7 leaders gave a significant torque high 10/19 and this cycle is down into 4/29/18.
Apple gave a low term high 10/16. And is down into july 2018. But GS gives the high 10/25 and FB 11/1. So my thinking now is that the last leader to turn gives the final high.
Basically, The peak torque on this average came 9/6. So 10/19 is a lower high. This is a very severe divergence. Mastertiming on 9/6 gives 10/25 on zero degrees.
10/23 will be 473 root 5 months from 1929. This is a major cycle. 474 is 90 degrees and targets late december. The leader average also give a significant high around the end of the year.
But this will all be within a long term down trend. Monday wil be a high but 10/25 is really the strongest date.
We are already in a bearmarket. 10/19 should have been a high but the market chose to invert this and create a low. This is a typical 4 day inversion window into 10/23, This will also be 7 days (Garret!) from the apple high 10/16,
FB gives a high 11/1. This date will be tested, November looks very bearish. Once we turn, w3 low 4/29 – 5-2 and w5 low second week of july 2018, 86 years after 1932.
10/25 is Bayer rule 15. Strongest day of the week and the most significant high. Just a matter of days now.
As the leader index is new I have some analysis to do. Took a look at price angles and saw 7/31 we had a change in trend; price- and time angles were equal.
Master timing on this date gives 10/19 (!) at 270 degrees and 10/29 at 0 degrees. As 7/31 should have been a high, 0 degrees gives highs and 180 degrees lows. And mastertiming gives 4/28/18 and 7/7/2018 at 180 degrees. These days give lows. The high in between should occur around june 1st.
During the last bear market the so called fang stocks were the last to break. Trying to time the market using cycle turn dates seems to me to have been entirely inconsistent at best lately. I attribute the current price action to primarily the remarkable role central banks are now playing. WSJ reports that the market has seen retail investor net outflows this year and the ongoing low volume, granted true for many years now, suggests to me a dramatic end, namely collapse as opposed to correction. Just one fallible man”s opinion.
Peter,
Do you or anyone else have an opinion on the Chinese market? Is anyone of the opinion that as the US market cycles down, so the world markets cycle down as well?
Again, thanks to all who share their thoughts. They are invaluable to me!
so, i have been busting my “hump” ………. trying to figure out the dow????? there is always a pattern to explain the behavior – ……yes/no?
i suppose Terrence McKenna was correct – that we are “collectively” being….”pulled into” the future, rather than being “pushed”.
with that said – this is what i see…… and this is in “non” log form……… it is also in 2 snapshots because i was unable to put it all on “one”…..as we are looking back at the ’87 high, and ’87 low as our starting points…………..
doth i BE insane?? snapshot 1 – https://invst.ly/5j29l snapshot 2 – https://invst.ly/5j29w
are we seeing a 30 year – ending expanding diagonal for a wave 5?? – which means wave 3 ended before 1987……
be kind now peoples — BE KIND!!! https://invst.ly/5j2eh
Luri, have you seen the charts of the European markets vs the US way back in 1927. You will notice the European markets topped out in 1927. The money flows started to flow back into the US to a eventual top in 1929. This how I am seeing the markets at this time. Low volume but yet consistent moves upwards in the US markets. After a relative small correction from the middle of next week into nov 7th, I would think the bears are going to be SMOKED going into year end. I have privileged info from what’s going on in Europe, many relatives family members. I can a sure you, that you are not getting the full story with the refugees crisis with the news media. The Syrians refugees deserve are compassion . But yet , they are not the problem. It is the financial refugees, who are crossing into Europe for free housing, medical and food ect. This is causing an unbearable financial situation on the social programs in Europe. If I was from Europe, I certainly would want to get my money out of the Europe due to high taxes and the refugee crisis. Bottom line, the cash flows from Europe will continue to accelerate into the US markets for some time. 2850 ES is on the horizon and I plan on getting back to a full long position after this relative small correction in early nov.. Yes, I know traders here will be thinking I have gone off the deep end. All the best every one.
dave,
why an “analog” behavior of 1927 -1929 …..”repeats”…… or needs to “repeat” today ……..completely escapes me. Today, we are indeed electronic and global – although so not the case in 1927 – most of the world was …”inaccessible”…… at that time to financial flows. This left primarily the USA as the “go to” place……………… this is no longer accurate in this “digital” age of 2017. The entire world [japan/china/singapore/ australia/crypto currencies/india] for example, is part of the decision matrix for choosing “where” to flow your funds.
The world is a very different place today……. Europe is now the EU, with “ONE” currency for all euro member states – whereas in 1927, different nations, different currencies…………….the EU for all intents and purposes is a “technocracy” with the ECB heading up the financial end, with the flow of funds for the EU circulated freely within the EU, with “capital controls” implemented at the first signs of stress [see cyprus]
If your thesis is correct – we should see the accumulated effect manifest itself in the behavior of the euro/dollar…….. or euro/dollar swaps…….. tell me what i am missing.
I am sure dave, you are convinced of your thesis – I am unconvinced by it – which is good, as this divergence is what makes a market…………..
https://invst.ly/5j2u8
We will agree to this agree. All the best.
no worries dave, we must all have our very own point of view…….
although, if you would be so kind as to help me understand the “flow” aspect of your logic……
here are the forward rates for the euro-dollar……. please show me “da flow” ……….
https://www.investing.com/currencies/eur-usd-forward-rates
Luri, I was never very good in school with my history class. But I always remembered ,that history always repeats it’s self. This is why I see 1927-1929 repeating its self in today’s financial markets. Europe is in one heck of financial mess. Money always flees to safer havens. That being the US. Yes, the US has it’s financial problems. But not as severe as the European empire. The total $ in the stock markets is approx 80 trillion dollars. That represents a very low percent in comparison to the over all bond market. It takes very little money coming out of the bond market into the US stock market to see new highs for the foreseeable future.
Luri, I realize this May not satisfy your question. But it is the best I can do. The real acid test, will be reflected in the US stock markets and the Euro currency in the near future. All the Best.
Luri, yes I have gone down the rabbit hole. No, I did not take the blue or red pill. Lolol
You are certainly a very we’ll read individual Luri for Delving into McKenna esoteric knowledge. I never thought some one on this blog would have gone down that rabbit hole. Did you take the blue pill or the red one? Lololol
i take the “pill” that is never swallowed …………….. “BE WARNED”! ……..
https://invst.ly/5j2-5
Jaws of death…
A new blog post is live at: https://worldcyclesinstitute.com/unravelling-a-complex-topping-process/
This website is for educational purposes relating to Elliott Wave and natural cycles. I welcome questions or input about Elliott Wave, cycles analysis, or astrological input relating to any market. Due to a heavy schedule, I may not have the time to answer questions that relate to my area of expertise.
I reserve the right to remove any comment that is deemed negative, disparages the Elliott Wave Principle, is otherwise not helpful to blog members, or is off-topic. Posting trade specifics does NOT serve an educational purpose, is stongly discouraged, and such comments may be removed.
Want to comment? You need to be logged in to comment. You can register here.