
Update: Friday, May 25, ~9:50 am EST
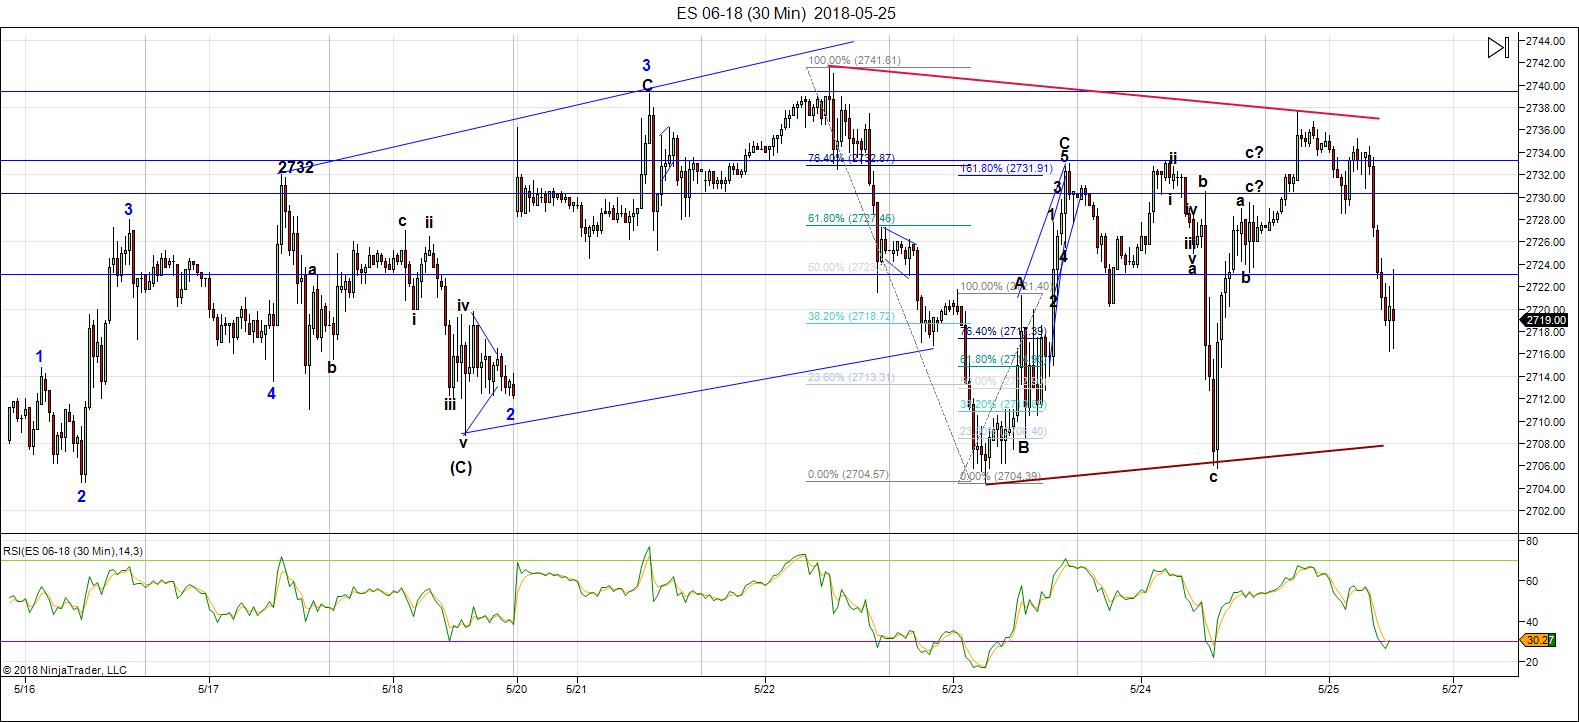
Above is a 30 minute chart of ES this morning. Ignore all the markings. What I want to point out is the potential bullish triangle shaping up (red trendlines). If ES drops to 2708, it will potentially complete the E leg and require one more leg up to a slight new high.
If we break the lower trendline of the triangle, we’ll continue down.
If we decide to complete this triangle, it may take all weekend to do so. With a holiday on Monday, we could have an elevated market through the weekend. This triangle will take some time to play out, if in fact, it happens.
____________________________
Market Report for Friday, May 25, 2018
Relatively short tonight – ES and USDJPY are the only opportunities.
Market Update for May 24, 2018  |
 |
Make sure you zoom the video to full size with frame expander (arrows) in the bottom right hand corner and also set the quality to as high as your web connection allows. This is an HD quality video so the best viewing is at that level. |
_______________________________
Market Report for Thursday, May 24, 2018
This is the Chart Show from this afternoon.
Chart Show for May 23, 2018  |
|
Make sure you zoom the video to full size with frame expander (arrows) in the bottom right hand corner and also set the quality to as high as your web connection allows. This is an HD quality video so the best viewing is at that level. |
_______________________________
Market Report for Wednesday, May 23, 2018
CHART SHOW signup
Short report tonight. We wait.
Market Update for May 23, 2018  |
|
Make sure you zoom the video to full size with frame expander (arrows) in the bottom right hand corner and also set the quality to as high as your web connection allows. This is an HD quality video so the best viewing is at that level. |
_______________________________
Market Report for Tuesday, May 22, 2018
CHART SHOW signup
Market Update for May 22, 2018  |
|
Make sure you zoom the video to full size with frame expander (arrows) in the bottom right hand corner and also set the quality to as high as your web connection allows. This is an HD quality video so the best viewing is at that level. |
_______________________________
It’s a Babysitter’s Nightmare (Like Herding Cats)

You know there’s “stuff” going on when it gets quiet. And you can’t always tell on the face if what they’re thinking is what you’re thinking.
Most of the time, it takes some nosing around to really come up with the truth; to know what going on under the surface.
Well, that’s the current market.
On the one hand, we have exceptionally low volume, leading to “fits and starts” and periods where everything just stops moving.
Then there are the extraordinary turns (we’re at one now), where the entire market is turning (not necessarily all on the same day), but it’s wreaking havoc on everything: The moves are not what you expect, nor when you expect them.
Finally, we have a triangle in the US indices and corrective waves in both directions at the moment. That tells me the market can move in any direction. It’s providing no clues (or very few, and they’re subtle at best).
There’s been no swing trading — the market needs to be watched and analyzed every single day, as the direction may change. It’s been a daytrader’s market, for sure.
As I’ve been saying, this is the most dangerous market you’re every likely to encounter. If you’re new to trading, it’s best to stay clear of turns, and enter once the new direction has been confirmed (as with the E leg of the triangle).
Also … high probability trades have a higher possibility of failing (but I try to keep my guidance on stops to low risk).
That’s the market we have and it may be with us until we reach the top. Thankfully, I see that top as only weeks away from here.
This weekend, currency pairs are turning (at different times), but AUDUSD and USDCAD have high probability trades setting up right now. USDJPY looks to have topped, so the setup is a day or so away. Gold now has 5 waves down, so the set up is perhaps a week to ten days away. EURUSD and GBPUSD should complete their turns early this coming week (we’ll have setups following those turns).
Elliott Wave Basics
Elliott Wave Theory has two primary components:
- fibonacci wave relationships that give clues as to wave lengths (and probable measured targets)
- wave counts in impulsive waves and corrective patterns (each corrective pattern has its own rules and guidelines)
Trend waves, or impulsive waves (which we haven’t really had since 2007), consist of a five wave pattern that measures accurately to prescribed wavelengths. We’ll get a set of impulsive waves in the A wave down after the top of the market.
Corrective waves are typically in patterns. You’ll see a list of corrective patterns in the sidebar in the Trader’s Gold area. They’re there so you can become familiar with the rules and guidelines for the pattern we’re in.
___________________________
Facebook: Update on May 21
 Above is the hourly chart of FB (Facebook).
I’ve now changed the labelling on this chart, as I’m sure we’re going to complete a double top. It looks like we’re tracing out a fourth wave, with a fifth wave to follow to a new high. We may end up with a double top.
The first wave down scenario I flagged originally didn’t work out; however, we are definitely looking at a top and the stalking is going to pay off.
To enter a trade like this, we always wait for a small degree wave down in 5 waves (on perhaps a 5 minute chart) and a second wave up in 3 waves to 62% with a subsequent turn down. This chart illustrates how being patient and waiting for this pattern keeps us safe.
It seems that FB is going to follow the broader market. It’s amazing to me that we’re not seeing the type of action you normally see at a top: Most tops see turns in some major stocks earlier than others, but all boats seem to keep floating in this market until somebody pulls the plug. If they all turn down at once, it’s going to make for an extremely bearish outcome … EXTREMELY bearish, if not downright scary.
I’ll continue to watch this stock as a bellwether for the larger market.
__________________________
Week at a Glance:
- ES/SPX – My preference is for another leg up to finish the D leg of the triangle. However, it’s a highly conflicted market, this weekend, so use caution. Target 2750-60.
- A high probability trade for AUDUSD at ~0.7486 long.
- A high probability trade for USDCAD at ~1.29262 short
- It looks like USDJPY has also turned (looking for a complete first wave down). We’re watching for turns in EURUSD and GBPUSD the early part of this coming week, perhaps (see the video).
______________________________
Here’s the latest daily chart of ES (emini futures)
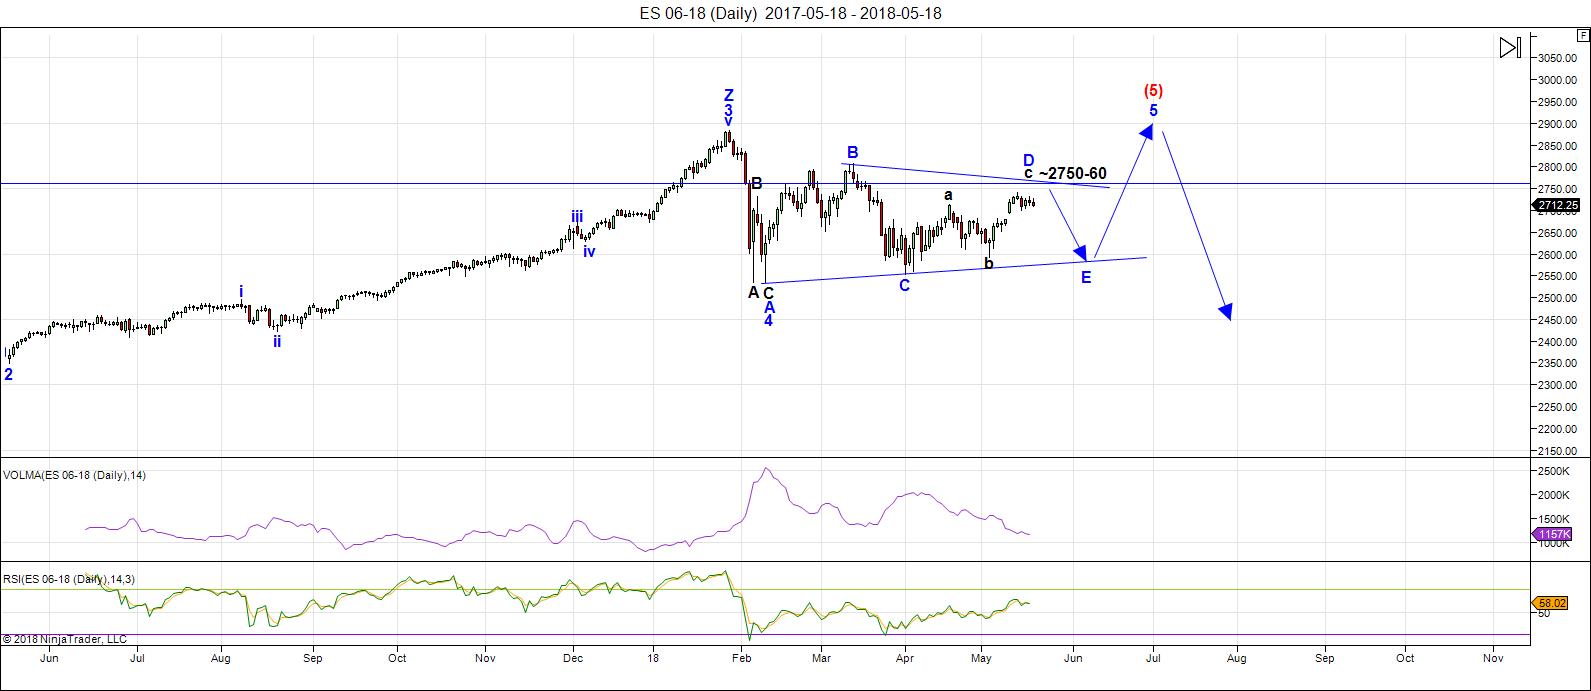
Above is the daily chart of ES (click to enlarge, as with any of my charts).
This past week was a quagmire. We have corrective waves in both directions this weekend and not much to go on for direction. However, my preference is for another final wave up to finish the D leg of the contracting triangle properly.
Volume is exceptionally low, which contributes to the volatility and lack of momentum at times.
The D leg wave structure is very complex and the original target was in the 2750 – 60 range. We still may be targeting this level, but the waves are anything but clear. So, early next week, we’ll be looking for a top to the D leg, followed by a turn down into the E leg.
The bottom line is that I don’t think (based on Friday’s action) that we’ve completed the D leg.
After the E wave down is complete, we’ll take off again to the upside in a fifth wave, which will simply finish off the pattern. We’ll get to a new high and probably more, but don’t expect (as I’ve been saying for a very long time) a large fifth wave that travels any great distance. (I think 3000 is possible but at the high end of the probability spectrum)
Summary: I think (although I can’t be absolutely sure) that we are not quite finished the D leg of the contracting triangle. Targets for the D leg top are within the 2750-60 area. This will result in a high probability trade to the downside (the E leg of the triangle) Once E leg (down) is complete, expect a final fifth wave to a new high. That fifth wave up to a new high will be the end of the 500 year bull market.
_______________________
Here’s the latest 60 MIN chart of ES (emini futures):
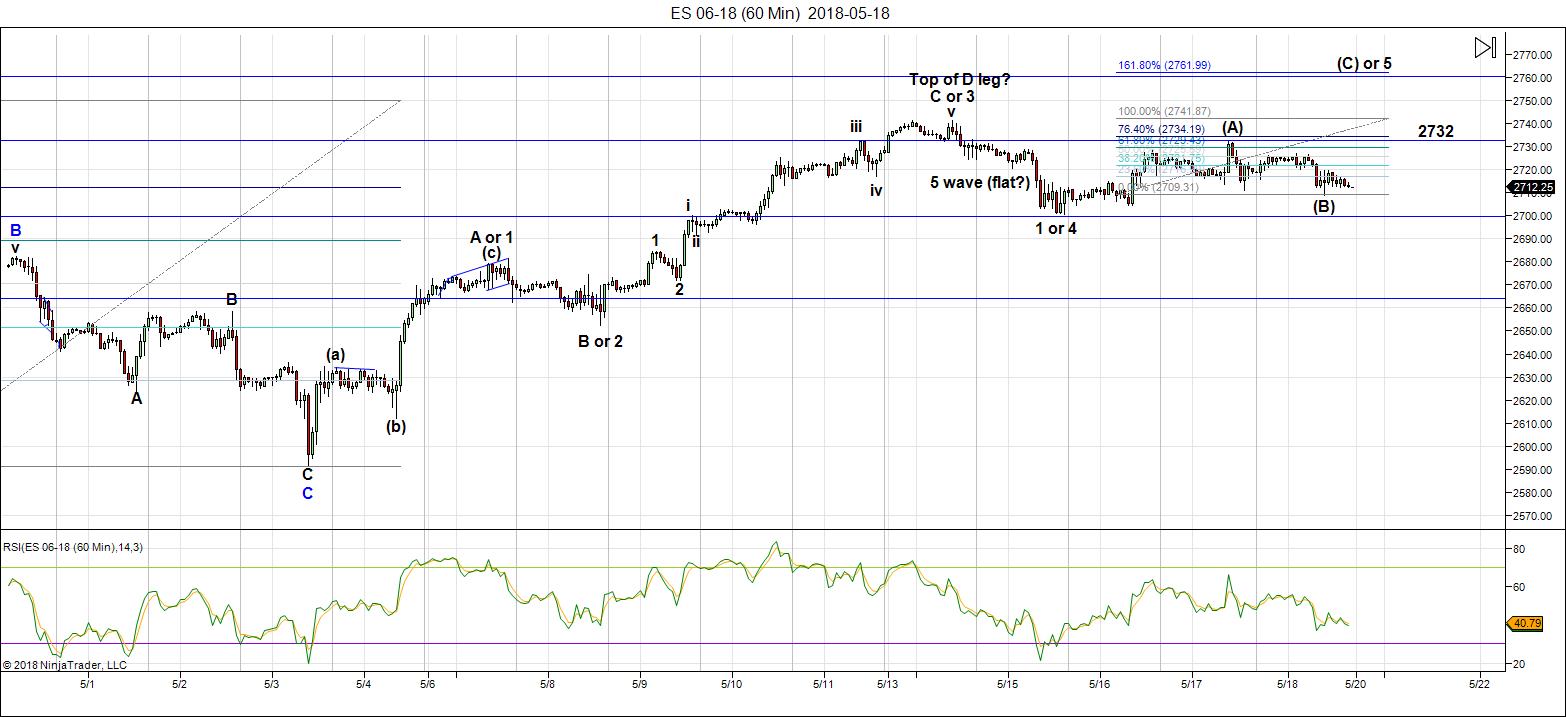
Above is the 60 minute chart of ES (click to enlarge, as with all my charts). It’s important to watch the video this weekend for the short-term prognosis.
I’m undecided on the pattern unfolding at the top of the C wave of the D leg of the triangle. I’ve labelled it as a yellow ABC pattern until we know more. The market is doing its best to remain opaque.
The dilemma is that the wave down from the top of 5 was in 5 waves and could either be the C wave of a flat or a first wave down. A flat is a 3-3-5 pattern. Because wave 5 itself has a big gap in the middle if it, it’s impossible to determine if it’s a 3-waver or 5 waver. So, I’ve labelled this wave down an A wave, but it could be a larger 4th wave.
Here’s where it gets muddier: The labelled B wave up is in 5 waves, but overlapping, so corrective. The wave down from B is in three waves. So, perhaps we’ve got a triangle or ending diagonal starting to form. In any event, I put the direction at up. We’ll have to wait to see the waves unfold to know what the pattern is.
I’d originally expected a 4th wave, and the overall D leg is, in my opinion, short to where the triangle looks “correct.” But the market is giving no clues, so this week so give us the answer.
The top of the D leg will be a high probability short to the downside in leg E of the triangle. We should reach the high (finally!) this week, I believe.
The 2750-60 area should be the top of the D leg of the triangle, leading to a high probability trade to the downside — to complete the E leg of the triangle.
Summary: I expect to continue the march up to the 2750-60 area of the D wave of a contracting triangle. There are alternatives, but based on what I’m seeing, this appears the most probable outcome of the current pattern. The high probability trade will be at the top (after a final fifth wave up), to take advantage of the E wave down.
_____________________________
Some housekeeping:
Site navigation: You can find all the specifics on site navigation and elements you might not be aware of by clicking here.
Next Federal Reserve Annct: Wednesday, June 13
Andy Pancholi Turn Dates (May, 2018)
- SP500: W9/Th10*, W16, Tu22/W23, M28*
- EURUSD: Su6, F11, F18, Tu29
* denotes major (bolded, as well) – (for more information on Andy’s turn dates, go here.)
New Free Blog Post: You Keep Me Hanging On
The CHART SHOW signup is live for Wednesday. You can sign up now in the usual spot: webinars.
Problem receiving blog comment emails? Try whitelisting the address. More info.
________________________
Market Report for Monday, May 21, 2018
CHART SHOW signup
Market Report for May 21, 2018  |
|
Make sure you zoom the video to full size with frame expander (arrows) in the bottom right hand corner and also set the quality to as high as your web connection allows. This is an HD quality video so the best viewing is at that level. |
_______________________________
Longer Term Charts Going into Monday
 Above is the 30 minute chart of the SP500.
I’m undecided on the pattern unfolding at the top of the C wave of the D leg of the triangle. I’ve labelled it as a yellow ABC pattern until we know more. The market is doing its best to remain opaque.
The dilemma is that the wave down from the top of 5 was in 5 waves and could either be the C wave of a flat or a first wave down. A flat is a 3-3-5 pattern. Because wave 5 itself has a big gap in the middle if it, it’s impossible to determine if it’s a 3-waver or 5 waver. So, I’ve labelled this wave down an A wave, but it could be a larger 4th wave.
Here’s where it gets muddier: The labelled B wave up is in 5 waves, but overlapping, so corrective. The wave down from B is in three waves. So, perhaps we’ve got a triangle or ending diagonal starting to form. In any event, I put the direction at up. We’ll have to wait to see the waves unfold to know what the pattern is.
I’d originally expected a 4th wave, and the overall D leg is, in my opinion, short to where the triangle looks “correct.” But the market is giving no clues, so this week so give us the answer.
The top of the D leg will be a high probability short to the downside in leg E of the triangle. We should reach the high (finally!) this week, I believe.
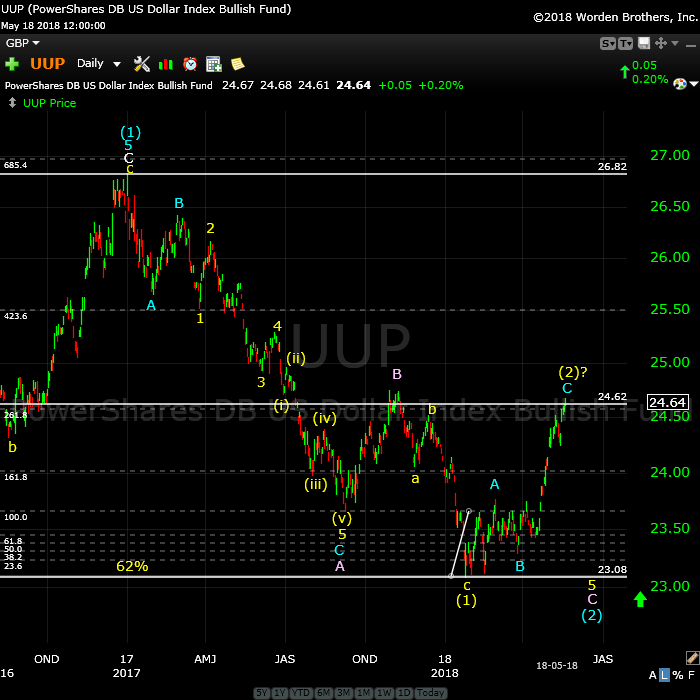
Above is the daily chart of UUP (US Dollar ETF). UUP is representative of the structure of DXY (the US index) and will provide an excellent predictor of the impending top in currency pairs and the US indices.
The pattern here is an ABC corrective wave to the upside, which appears to be more of less complete. I’ve labelled the wave up as the 2nd wave of an ending diagonal, but it’s very early to do this, so treat this call with a good dose of caution.
The wave up looks corrective. As a result, I’m expecting a new low for the dollar.
After a new low, the dollar will turn up to a new high above 104.00 (UUP likewise above 27.00). The dollar will turn with the euro.
Rather than playing a currency pair, you can consider playing a short here knowing that the objective is a new low below 23.00. But I would wait for a small wave down in 5 waves and a lower high to follow that retraces 62% in three waves.
The movement of the dollar strongly influences the movement of just about everything else, so it’s important to pay attention to what it’s doing.
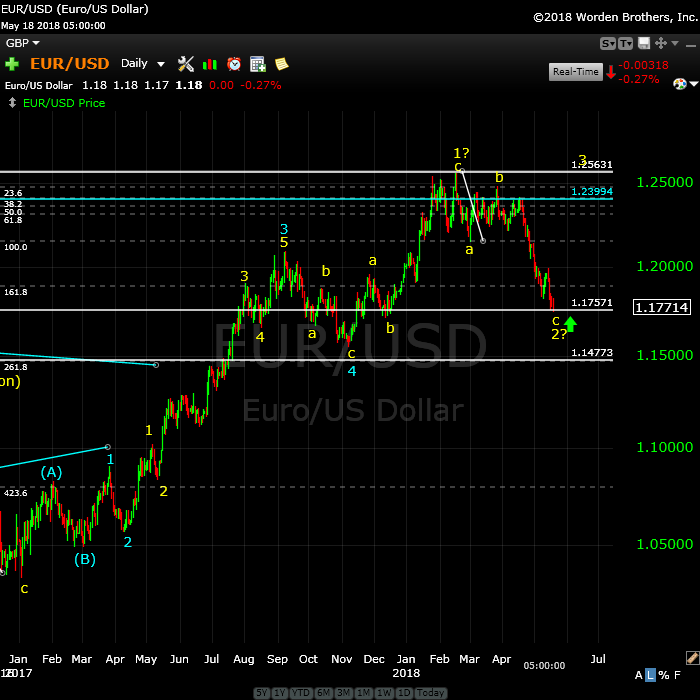
Above is the daily chart of EURUSD.
We appear to have more of less completed a large C wave to the downside, part of an abc corrective pattern. The c wave now measures beyond the fibonacci ratio that is 1.618 X the length of the a wave down. I don’t have another possible inflection point until 1.15, so this adds on an extra measure of caution here.
Even though it’s an early call, I think it’s most likely we’re setting up a rather large ending diagonal. It’s an early call, but it’s an extraordinary drop and I have difficulty at the moment coming up with another viable alternative scenario.
In terms of a trade, the less risky course of action would be to wait for a wave up in five waves and then a three wave, 62% retrace in a second wave.
Once this final pattern eventually tops (with a new high above 1.256), expect a drop in a higher degree fifth wave to a new low below 1.034.
More on the shorter term in the video, of course.
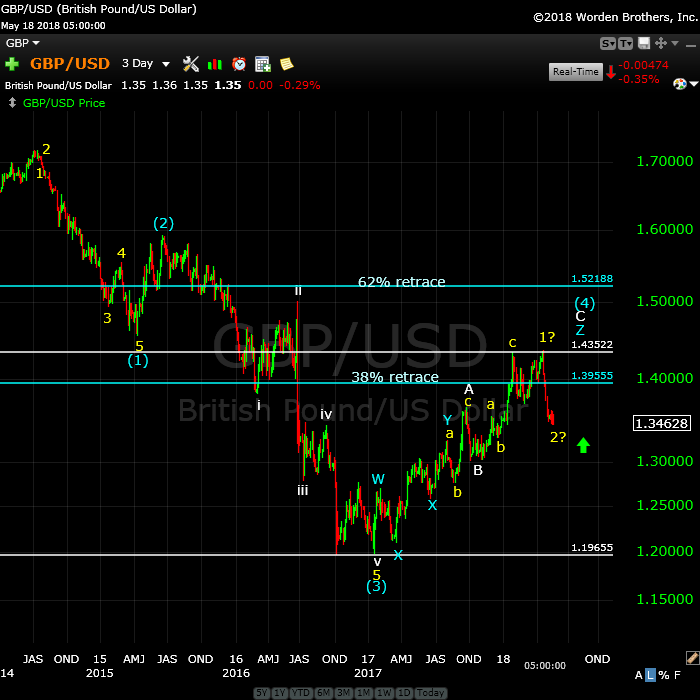
Above is the 3 day chart of GBPUSD. The longer term direction is up.
GBP has a similar pattern to EURUSD. We’re very close to a bottom on this large leg down. The pattern is corrective and requires a rise to a new high.
If contemplating a trade, ss with the EURUSD, I’d be waiting here for a first wave up and then a second wave in three waves down to the 62% level before a long entry with a target of a new high.
This currency pair warrants caution. There are less risky trades setting up in the other currency pairs. However, all the pairs are turning, so as the EURUSD confirms a bottom, GBPUSD should not be far behind.
More information on the short term prognosis in the video.
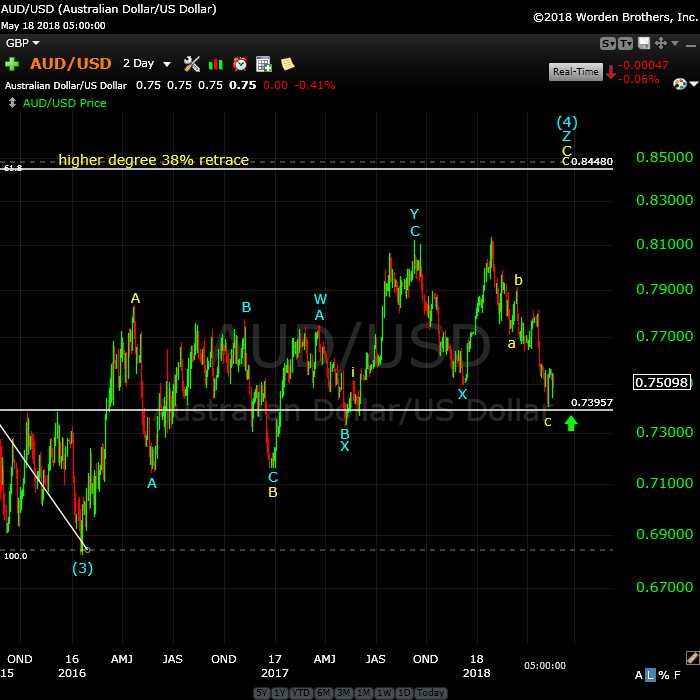
Above is the 2 day chart of the AUDUSD.
We look to have the turn in place with a full five waves up to the previous fourth wave complete. We also potentially have a second wave in place with a double bottom. So the overall direction should be up.
Watch my prognosis in the video, as I see another potential first and second wave shaping up, so a high probability entry is at hand at ~0.7486.
The long term target is .84450. This is a high probability trade. More in the video.
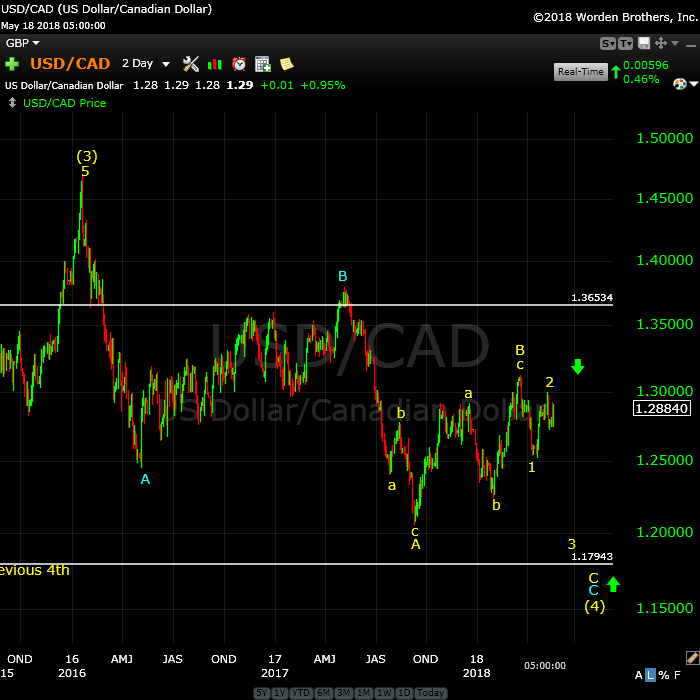
Above is the 2 day chart of USDCAD. It moves opposite in direction to AUDUSD (due to the orientation of the charts).
We have a high probability trade to the downside setting up. We’ve now completed a first wave down in five waves and have a second wave in place, which is working on a double top (wave yellow 2) at ~1.29243. This mirrors AUDUSD, which has also completed a second wave.
The high probability trade is a short in the area of 1.29243 (slightly more that the 62% retrace of the first wave down). The first objective is a new low below 1.18.
Once this pair hits the final downside target, it should turn up and will eventually rally to a new all time high for USDCAD well above above 1.46254.

Above is the 7 day chart of USDJPY. For this pair, the longer-term prognosis is for a big drop to the 94.6 area.
Friday morning, we completed what looked like a top for this pair. The current wave down is not complete but is beginning to look like an impulsive first wave down. I would like to see this wave target 110.04 before turning back up in a second wave. The top of the second wave will set up a high probability trade to the downside.
After we hit the long-term downside target (~94.6), I expect a turn up in an impulsive third wave far, far above 130.00.
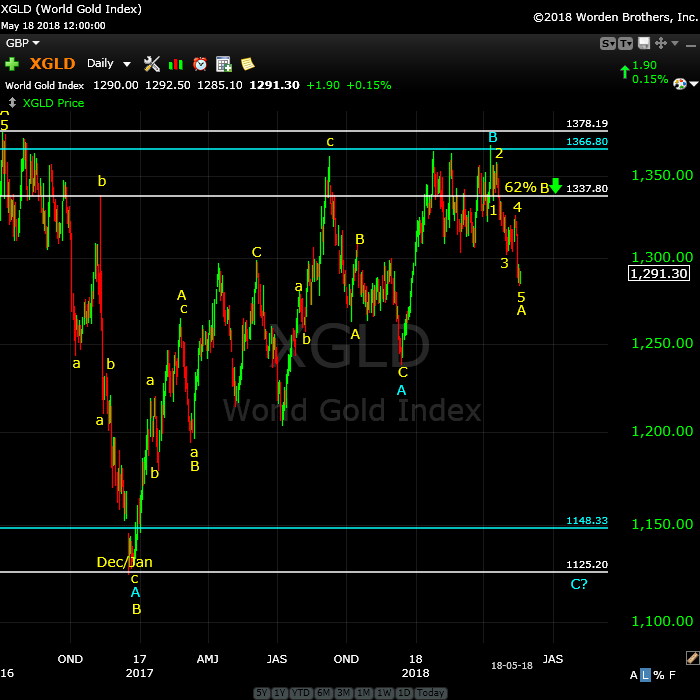
Above is the daily chart of gold. We are starting to set up for an entry in the not too distant future.
This week, gold turned down and traced out 5 waves (although the final fifth may not be quite complete at this writing. We’re looking for a retrace in a second wave to the 1337.80 area for a short trade to the downside, with a target of 1122.
I will be watching daily and you’ll find updates in the nightly video.
After a bottom at around 1122, look for a wave up in gold to the 1600 area.
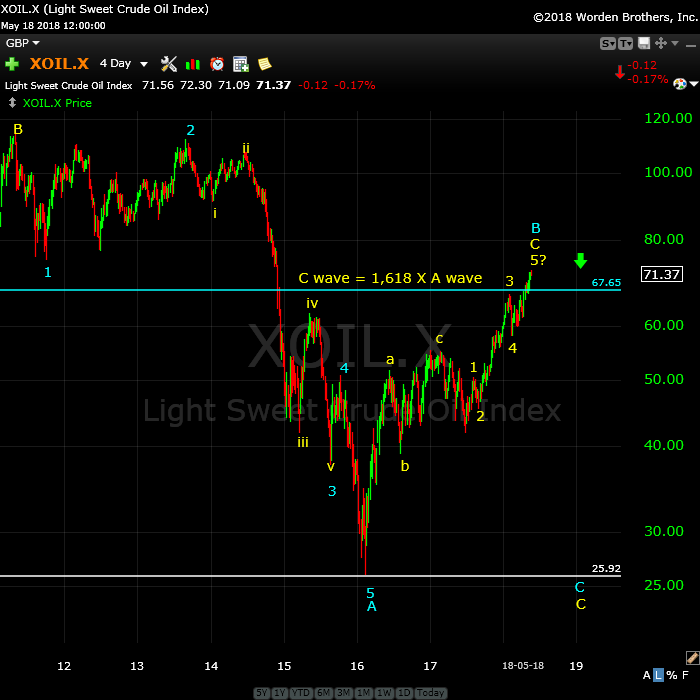
Above is the 4 day chart of WTI oil. No change here.
We rallied to a slight new high this week, and then experienced some weakness in what appears to be a small fourth wave.
We still have more upside to go, but I’m not recommending action here until we get to the top of this final fifth wave. It looks like we could reach the $77-78 area before putting in a final top. The short entry would be after a first wave down and then a second wave up to the 62% retrace level).
Longer, term, I’m expecting a long wave down in 5 waves to a double bottom at about 26.00. The entire structure going back to 2007 is a corrective wave, with the A wave equal to the C wave in length. This suggests a double bottom at the 26 level rather than a drop below it (but we’ll determine a final target once we see the wave structure of the wave down).
Good trading!


I feel it’s unsafe to trade until various setups are confirmed too. I’m just sitting watching especially as Euro and GBP look like they are heading down big time and I’m not so sure if they are heading back to new highs any more but we shall see.
The best bet is to wait for a first a second wave confirmed. GBP is at the bottom of an ending diagonal. EURUSD at the bottom of a fifth wave after a triangle. The others are extremely close, but I don’t see that the turn is in anywhere quite yet. I think it will happens when ES tops … maybe end of today.
An active market overnight but no real surprises. Currency pairs are at the inflection point and we may see turns today. ES turned up and should continue after the bell, but as I said, i don’t know how far we’re going or whether we’ll make 2760 (My fibonacci measurement favours 2760). It will be a case of counting waves to the upside.
We may get a slight drop in ES after the open.
Cash has a wave up now but no correction, so I’m expecting a 4th wave in both cash and futures. A quick fib measurement tells me that low could be 2724/5 – the previous 4th low in ES. That would get cash and futures back in sync, ready for a final 5th wave up to our target (2760?)
We obviously aren’t going to get the correction in ES I thought we’d get. It’s difficult to figure out where we are in the wave count (there are too many gaps). I think we’re expecting another fourth wave.
After 2745 in ES, I’d be starting to look for a top.
I got long ES on the dip today and have a close stop. Apart from being out the safest thing is to be long with a close stop. I’ve banned myself from shorting for now as it just keeps hitting stops.
2750 would do for me and I’ll close out and wait for the turn to happen.
In ES (we’re at 2733), we should be in the first wave of the fifth long. I would expect a little more upside to around 2739 before a second wave (perhaps overnight). Then a 3, 4, 5 up to the target would be next. We’ll leave that for tomorrow and maybe Wednesday.
There are turn dates on 22/23 and that’s when I think we’ll see the turn into the E leg down of the triangle.
The Market Update for Tuesday is live at the top of the post.
Nothing to report this morning. Continued patience.,
As far as ES goes, I think we’re in the fourth wave of the third, which means more third wave to about 2748 and then the larger fourth, followed by a fifth wave. Perhaps end of day?
This wave down in ES just might be the larger fourth wave, leaving one more wave up, which would mean the waves are compressing, but it’s hard to tell.
I dumped my long (it’s getting too scary) and I can’t watch every tick. I will wait for the top now. Currencies still need to bottom., as far as I can tell.
ES – looks to me as though we have an ending diagonal shaping up. All the waves are in 3’s and overlapping. In that case, the fifth wave (which we’d be in now) cannot go above 2750. The turn would be sharp.
I just mounted a chart of ES at the top of the post showing the potential ending diagonal, with some notes.
Arrrrgh. All we ask for is a few more pips but the ES just doesn’t want to give it to us
Well, I think the ending diagonal in ES is still valid … just. Any lower than 2728 and it will break. But it changes the top target, which now changes to about 2745.
I don’t want to be long this thing … too many surprises to the downside.
Ending diagonal in ES is toast. We’re morphing into something new. Maybe a double fourth wave and we start the fifth all over again. I imagine ES will settle in at about 2724 and then turn around and head back up.
I have to head out for an hour. The wave down is in 3 waves, so the direction is still up. A babysitter’s market.
So the upside target is up in the air. I was thinking that 2745 was too low, anyway.
The Market Update for Wednesday is live at the top of the post.
Tonight NQ looks like it’s just finished a contracting triangle (bullish) on a 60 minute chart.
ES looks to have created a larger ending diagonal now stretching back about three days on a 60 min chart. And if you measure the third wave of that ED and line it up at the bottom of the fourth wave again, guess what, it points right to 2750 again – apparently a very important number!
Peter,
Your updates are very much appreciated .
It is a REALLY challenging market. I watched it tonight for a couple of hours trying to figure out what on Earth it was doing and then suddenly, it came into focus. Big moves.
It looks broken now. I’d have to connect the May 4 & May 8 lows on a 1hr chart to get another trendline, which brings the bottom to around 2690-2700.
Using currencies as a gauge, the only pair which looks reasonable to guess at is AUD/USD, which still has room to go to get to at least 62%.
You still think UJ is going all the way back up? I was short with a tiny profit before last night’s update & rather than close it, I set stop loss to even. Just woke up and here it is at 109.61. What’s odd is I have also been short USD/CHF for days & it has not seen any bounces up with EUR coming down, CAD going up, etc… & USD/CAD is usually the leader of the pack.
Forgot to ask the obvious question — Could the SPX triple top at 2743 been it?
Yes, we have 5 waves down this morning.
I also have possible turn points for EUR at 1.1619 and 1.1559
It’s a really difficult market, of course. Again a failure to even get close to the upper target in ES. But for all intents and purposes, we have the awaited turn in place, however, all the players are in different positions.
Hi. Yes seem yesterday scénario was cancelled about ES this morning . May be the E wave have begun ? Any point of view ? Thanks
I watched a descent in stages last night and this morning, ES has 5 waves down. So the methodology for entry is to wait for a second wave. Now we may not get one that retraces exactly 62% because this is a weak market.
The wave up, however, will rise in 3 waves and I should be able to get a target once the A wave is in place.
USDCAD is at the 2nd wave target, AUDUSD has retraced and I would guess we’re going to 62%. EURUSD at a new low, as is GBPUSD, as expected. These require first waves and second waves for low risk entry.
USDJPY has a first wave down that is not quite complete but likely will be after the open.
I will try to get you some entry numbers for all of these once we get a turn this morning.
ES: I would expect another small wave down here to 2700 (the previous fourth) and then a second wave up in 3 waves, in that case to about 2728 (I’ll update this number when we have the A wave in place). But again, it may not hit this number. We were short of the targets for the B wave down (and the top of this D leg) so we need to keep that in mind.
EURUSD and GBPUSD are are new lows, as expected. GBPUSD is near the bottom of an ending diagonal, so you do not want to try to pick a bottom on this one. Wait for a first wave up and second wave down. To a slightly lesser extent, this applies to EURUSD.
USDCAD is at the target (double second wave). However, the wave up looks to be just an A wave, so I’d expect a small B/C wave back up to the target at 2920. This is a high probability trade short.
AUDUSD looks like it’s only going to retrace about 62%. That number is at .7508.
USDJPY looks like it needs another leg down to the 108.8 area before a larger bounce. It currently looks to be in a small 4th wave up, which I would expect to head back down once it hits the 38% retrace level at about 110.043.
Peter on the USD/CAD target for entry short. Is it 1.292 a little short of the double top or is the exact entry the double top as mentioned in the video last night? I think you mean the previous high of 1.29250 or so.
Sorry, Darin, you’re right. In my haste, I gave the number for the second spike. We have 3, of course (weird). The first spike 2nd wave is the actual target: 1.292
If we are looking to short the USD (any pair) are we playing a first wave up to a new high, or second wave retrace to 62% (where it should turn down for further USD strength)? I know all of the recent updates call for a double bottom in UUP / DXY, but has that changed in light of the new EUR (and other pairs) lows?
Not sure I got all of this, but nothing’s changed in the big picture. I expected new lows. The waves in EUR & GBP are still in 3 waves. So I’m expecting a new low for the dollar, although I can’t access that chart right at the moment.
The lows today in EUR and GBP are minimal and expected. In fact, I’d expect a little bit lower. My target is EUR right now is 1.32583.
Yea, just figured this out after I posted. Dumb question. Forgot SPX was in a triangle & bigger picture is a new high, so currencies go with it.
There area no dumb questions … lol.
For ES, I posted an slightly incorrect number, which is likely to change, anyway. The 62% now from our current position is 2728. In the case that ES drops to 2700 first, the 62% retrace level will be 2725.
I would not be surprised to see ES hit 2714 before turning down to finish the final leg of the first wave.
I don’t know if I actually said it, but US indices should now be in wave E, so the bigger direction is down.
I don’t know what this corrective wave up in ES is … either a 4th or 2nd. It’s in between the two. I expected a fourth, but maybe this is a second and all we’re going to get. I have a fibonacci ratio inflection point at 2722.
Extra caution. This market is all over the place, unpredictable, and dangerous.
The 2722 area may be the top here for ES. NQ has retraced 62% now, so that suggests we may be reaching a peak.
Looks like we’re getting that second wave in ES, with a target of a little above 2726. That means this should be a great short entry for the balance of the E wave to the downside.
I got in short ES at 2728. Any idea where to place a stop on this trade. It’s not large so happy to keep a wide stop but would rather close if the market moves up and looks like it’s doing something else (something it loves to do!)
above 2731 now. tonight’s market report just got posted.
The Market Report for Thursday (today’s Chart Show) is live at the top of the post.
ES is starting to move down tonight. I’d like to see it under 2721 at least to confirm the top of this wave is in. 2700 of course, is the key confirmation number.
ES is setting up this morning for a high probability trade to the downside (the E leg of the triangle). The smallish wave down this morning is in three waves, so I expect a retrace to about 2733, which would be the entry.
With ES, we still could get a small spike about the entry point, so I would watch for the turn. However, if there is a small spike, I would think it would be quite limited at this point.
The drop in ES was definitely a surprise, but we’re most likely topped and are in the E leg, as far as I can make out. Any three wave retrace would be shortable. Below 2700 is the confirmation.
I don’t know what ES is doing at the moment. It’s an odd wave structure at this juncture, so some caution is prudent. The 62% retrace of the waves down in ES is at 2725 – that might just be the target here.
Down we go in ES. The target for this wave down should be at least 2675. The ultimate target is the area of 2580 (but that may shift a bit as we get closer). The signs are that this is going to be a very difficult wave to predict the structure of the subwaves.
Note that USDJPY is not exhibiting the structure of a five wave first wave and if it breaks 108.50 cleanly, may just keep on going. It looks to be in a much larger wave down.
We’re in corrective environments across asset classes and coupled with a countertrend move (the trend is still up) is possibly going to lead to a few surprises along the way.
Getting Deja Vu of last weeks sideways action. Another 62% retrace to ~2724. If I weren’t already short, I’d say great place to get in, but being short and watching profits diminish changes my tune.
We need something to spook the markets, right about now…
Looking at the structure now, it might be that we’re going to get a double second wave at 2730. The waves down in ES look like a 3, while the waves down in SP500 look more like a 5. It is an ugly, ugly market.
Maybe we’re done with this second wave. I have nothing to go on here. The waves up don’t have clear-cut A waves.
NQ, second attempt to tag 78.6%. Maybe SPX will try at same time, then all of it comes down. I have my stops right above.
NQ doing a double top here, I’m looking at it, too.
I also have a fib level on ES at 2726 and change – the 1.618 extension off what I think is the A wave up.
Looks like my first guess was right on ES … 2730 here we come.
Shorted NQ @6953 with a very tight SL, but also bought some QQQ 166 lotto tickets expiring next week at .32. If I’m stopped out of the straight trade on a spike before it drops in the next week, hopefully the lottos pay out. I don’t see us going sideways much longer.
I just dropped a comment. I think NQ and ES are going to completely retrace this morning’s action. While the SP500 actually looks ok, futures do not and so the market needs to “zero it all out” and start over again. We should start with a wave down in 5, not 3.
The alternative is that it could “give up” mid stream and leave us with a 1-2, 1-2 pattern. I think that less likely but at this point, I don’t have information to lean in either direction from a technical perspective.
I’ll stay in SPX as long as we remain below the trendline (which is godaweful close right now). Not giving NQ any breathing room though
Because of the “surprise” wave down this morning, which left a wave in 3, and created an overall pattern that is a 3, it’s most likely that we’re actually going back to 2733 in ES, now that I look at the wave patterns.
The waves up are corrective, so the overall direction is down, but this ugly market has decided to try to shake us all out.
I would think end of day should bring an end to all of this.
The Market Update for Friday is live at the top of the post.
Let me point out that AAPL, AMZN, and NFLX are all in ending diagonals … at the top of the third, which means one more down and one more up … just like the US indices.
Possibly why it’s taking this thing so long to turn over./
Three waves down in ES this morning so far, so I would be expecting a new high.
I just placed a chart of ES at the top of the post showing a large potential triangle (bullish).
I am suddenly unable to post a comment (happened within the last 15 minutes – I get told it’s spam). I have a sneaking suspicion this has to do with GDPR lockdown that’s happening in Europe. I have my site on a European server, scheduled to be moved this weekend, so I may have to speed up that process. I have a message left with my server company, who will hopefully call me back soon.
I’ve never had to leave my number for a call back before, so this tells me I’m not the only one that’s having issues. The complexity at the top of a major cycle continues to play out …
I’m now in the midst of moving my site to another service, so there may be some downtime over the weekend but I should be up and running by Monday with everything working.
The site has been moved and seems to be OK. The problem with leaving comments ended up being a spam plugin that was made GDPR compliant yesterday.
In any event, comments are now working again.
A new weekend post and Market Report are live at: https://worldcyclesinstitute.com/the-bulls-are-getting-tired/