
 All Aboard!
Take the last train to Clarksville
And I’ll meet you at the station
You can be here by four thirty
Cause I made your reservation
Don’t be slow
Oh, no, no, no …
The Monkees were a phenomenon in the late 1960s with their sanitized pop music. “Last Train to Clarksville” was one of their biggest hits.
That period (the 1960s) was the top of an Elliott Wave third wave, just before the recession of the 1970s. If you want to know how the economy’s doing, just pay attention to the music. The tops of third waves come with elevated spirits — feel good music. They’re “golden ages.” Everybody’s upbeat and it’s reflected in the music.
in the late 60s, as the third wave topped and we headed into the recession, the Beatles broke up, we saw Woodstock take place (’69), and the music turned towards hard rock, heavy metal, punk rock, and slower ballads. At the bottom of the fourth wave, in 1974, we saw the rise of disco.
The last thirty years (since around 1980) have featured rap music (during the fifth and final wave, beginning in the late 70s), which is generally an angry reaction to what’s going on in society. When we reach the top and head down into a major depression, music will become simpler, there’ll be more ballads and an overall melancholy undertone to much of it.
Robert Prechter, in his books on Socionomics, does an excellent job or following the changes is popular music with the ups and downs of the stock market. I’ll be posting a larger blog post on this subject over the next couple of weeks.
But the real reason I latched onto the Monkees was because we have a train pulling into the station. After a little bit more upside, we’re going to see a large drop to finish of the balance of the fourth wave. Sentiment will turn decidedly bearish and negative and, at the bottom, fear will enter the equation.
That will lead to a final wave up to a new high.
Where’s the Fear?
Keep in mind, that we haven’t seen any real fear, and I believe that will be the real mark of a complete fourth wave. So all of this supports a lot more downside after the current three wave rally, which I predicted a couple of weeks ago.
This is a combination pattern unfolding, as is typical of a very large, high degree fourth wave. We’ve completed a running flat. The next pattern can either be a zigzag, a triangle, or an ending diagonal. I would expect it will be a zigzag. There could be another pattern (a third pattern) after the zigzag (you cannot have more than three patterns in a combination pattern).
We need this fourth wave to stir up the underlying fear that’s out there and have it manifested in articles and headlines in the mainstream press. Only then will we see a fifth wave to a new high. So this factor also tells me we have more work to do on the downside before we can contemplate a final rise to end this 500 year rally.
_______________________________
Elliott Wave Basics
There are two types of Elliott wave patterns:
- Motive (or impulsive waves) which are “trend” waves.
- Corrective waves, which are “counter trend” waves.
Motive waves contain five distinct waves that move the market forward in a trend. Counter trend waves are in 3 waves and simply correct the trend.
All these patterns move at what we call multiple degrees of trend (in other words, the market is fractal, meaning there are smaller series of waves that move in the same patterns within the larger patterns). The keys to analyzing Elliott waves is being able to recognize the patterns and the “degree” of trend (or countertrend) that you’re working within.
Impulsive (motive) waves move in very distinct and reliable patterns of five waves. Subwaves of motive waves measure out to specific lengths (fibonacci ratios) very accurately. Motive waves are the easiest waves to trade. You find them in a trending market.
Waves 1, 3, and 5 of a motive wave pattern each contain 5 impulsive subwaves. Waves 2 and 4 are countertrend waves and move in 3 waves.
Countertrend waves move in 3 waves and always retrace to their start eventually. Counrtertrend (corrective waves) are typically in patterns — for example, a triangle, flat, or zigzag. Waves within those patterns can be difficult to predict, but the patterns themselves are very predictable.
Fibonacci ratios run all through the market. They determine the lengths of waves and provide entry and exit points. These measurements are really accurate in trending markets, but more difficult to identify in corrective markets (we’ve been in a corrective market in all the asset classes I cover since 2009).
To use Elliott wave analysis accurately, you must be able to recognize the difference between a trend wave (motive) and a countertrend wave (corrective). There’s very much more to proper Elliott wave analysis, but this gives you the basics.
____________________________
Registration for Commenting
Want to comment? You need to be logged in to comment. You can register here.
If you register, it protects your information. It also allows you to comment without filling in your information each time. Once you’re registered, simply go to the home page and click on the login link top right in order to log yourself in. Usually, you’ll be logged in for several days before needing to be logged in again.
______________________________
Problem receiving blog comment emails? Try whitelisting the address. More info.
______________________________
Tops in your field DZ 2
Tops in your field …You are tops in your field. Tried to follow Elliot Wave international for years. They were always behind the market. After discovering you, I perceive that you are an expert in reading the waves, which puts you way ahead of the rest of your peers. And you can read the Waves like you are reading tomorrow’s financial section. I pray you stay healthy. —DZ |
Couldn’t be happier … KK 2
Couldn’t be happier …The analysis and insight you provide is simply amazing! I’ve been trading the futures and equity markets for well over thirty years and usually average around 5% monthly. Since joining your Traders Gold Service two months ago, that number has better than doubled. I couldn’t be happier.—KK |
the real deal SM 2
The real deal …‘Educational, insightful and thorough market analysis for all levels of traders. It’s Elliott Wave at its best….Peter Temple is the real deal’ —SM |
Get an upper hand … JC 2
Get an upper hand in trading …Seeing all the different currency pairs and the wave structures and hearing you explain why this has to do that on a nightly bases gives one a upper hand when trading. Elliott Wave applies to all stock and indices and can be applied to any candlestick chart. If someone ask what you want for Christmas – Tell them a membership to Peter’s “Traders Gold!”—JC |
Rise above the rest … SM 2
Rise above the rest …I have only ever met a few people who, in their chosen fields (astrology, medicine, music, martial arts, technical analysis), rise above all the rest and you are one of them…you have ‘the gift’…and that’s why I’m a Trader’s Gold member. —SM |
Have not had a losing week RW 2
Have not had a losing week …I have been with Peter almost a year. The only thing that matters is have I made money with his service. I think I have finally turned the corner using Peter’s EW. I have not had a losing week in the last 5 months. Thanks Peter, for your amazing amount of hard work. —RW |
The best of them JL 2
The best of them …Last couple of years, I subscribed to several ‘market traders’. You are by far the best of them and the personal contact is awesome. Daily and daily updates are very well written! Besides your expertise in EW, I also like your cycles analysis. Best investment I ever made! —JL |
A true expert in Elliott Wave FL 2
A true expert in Elliott Wave …You are a true expert in EW analysis. What you provide is not available anywhere and is priceless. Subscription on your services is the best thing I have ever done. Many thanks for your effort to make me a better investor. I now have more trust in my investment decisions. I hope you will continue the excellent work! —FL |
The Market This Week
Here's the latest daily chart of ES (emini futures)
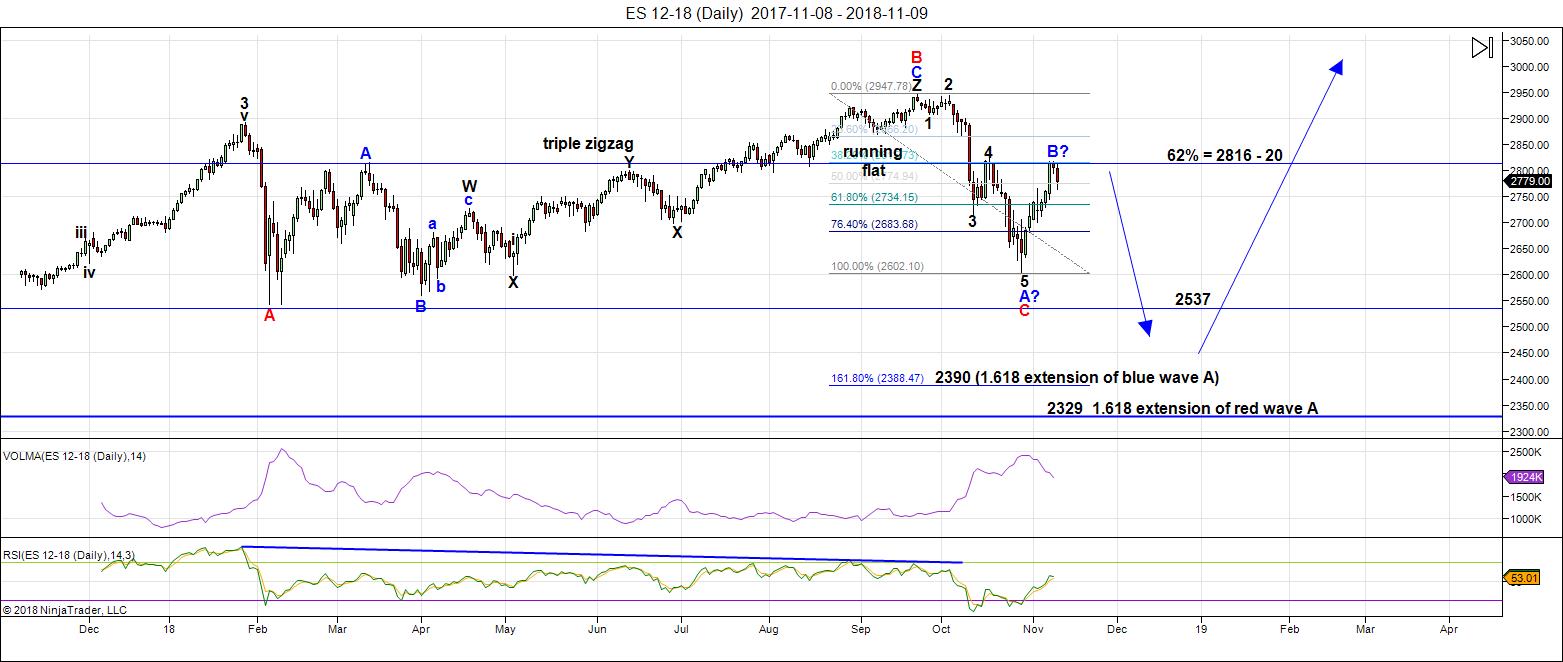
Above is the daily chart of ES (click to enlarge, as with any of my charts).
Last week, we reached the 62% retracement level of the entire wave down from the all-time-high, as predicted. The past couple of days produced a very deep fourth wave of the second five-waver of a zigzag.
Friday, near the end of the day, we turned back up again dramatically, after arguably tracing out an ending diagonal in ES.
We should see a top over the next couple of days, resulting in a large wave down to a new fourth wave low.
Fourth waves of this size are usually combination waves, so I've been expecting another pattern to put an end to this fourth wave. That big drop will probably be in a zigzag format and will end the C leg of this large fourth wave we've been in since January 29 2018.
The next pattern to the downside could also be a triangle or an ending diagonal. However, I deem this patterns of lower probability. There's always the possibility that we could see two patterns emerge to finish off this C wave (you're allowed a maximum of three by EW historical standards).
Summary: Expect a very large drop to a new low after a new high above this week's intermediate high. The pattern is likely to be a zigzag, but could also be a triangle or ending diagonal.
Once the c wave (down) has bottomed, expect a final fifth wave to a new high. That fifth wave up to a new high will be the end of the 500 year bull market.
___________________________
Trader's Gold Subscribers get a comprehensive view of the market, including hourly (and even smaller timeframes, when appropriate) on a daily basis. They also receive updates through the comments area. I provide only the daily timeframe for the free blog, as a "snapshot" of where the market currently trades and the next move on a weekly basis.
______________________________________
Sign up for: The Chart Show
Next Date: Wednesday, November 21 at 5:00 pm EST (US market time)

The Chart Show is a one hour webinar in which Peter Temple provides the Elliott Wave analysis in real time for the US market, gold, silver, oil, major USD currency pairs, and more. You won't find a more accurate or comprehensive market prediction anywhere for this price.
Get caught up on the market from an Elliott Wave perspective. You’ll also get Andy Pancholi cycle turn dates for the SP500 for the balance of the current month. There’ll be a Q&A session during and at the end of the webinar and the possibility (depending on time) of taking requests.
| "I think you are the only Elliot Wave technician on the planet who knows what he's doing.” |
| m.d. (professional trader) |
All registrants will receive the video playback of the webinar, so even if you miss it, you’ll be sent the full video replay within about an hour of its conclusion.


Yep! I think we do have one more shake out of weak short hands to start next week. While we did take out the round number pivots, the way it happened happened suggests we have another move up. Lots of analysts disagree and think the big move down is here but I think not quite yet…
Peter – Looks like the ES chart is last weeks ?
My goodness, you’re right! Fixed. Thanks! I had the power out all day Saturday and I guess between Friday and Sunday, I forgot to slot in the newer one. Thanks for catching!
peter:
how do you think about monetary crisis, will that cause hyperinflation? with USA being in debt so deep, maybe that is a good way to do to wipe out the debt. Also, about the capital flow, because of the crisis in Europe is currently facing , will that cause the capital flee to USA and the market will go as high as 40000? maybe we are facing an totally different environment now? Love to hear your thought.
Shunn
Shunn
shunn
IMHO, the inability oc futures to reclaim the round number pivots is a caution flag for bullish price action this week. Another close below them today would bearish. I will be exiting short puts if that happens.
Despite the pivot failures, decline still looks corrective to me, unless it is some kind of diagonal. This price action is designed to confuse as many traders as possible ahead of the market’s next big move. Be careful out there….
Shun
If you go to the home page
https://worldcyclesinstitute.com
Just read through the several articles is all I can say .
there is a ton of information on this site and the more
You read the better you will grasp everything Peter has been
And is looking at ( working on )
Thanks for the update Peter : )
bob snyder
I think we may have completed the up move and are on the verge of the big
move down. Perhaps “here we go”.
bob snyder
Sorry for the ambiguity, I was referring to Peter’s middle or lower objectives.
The gap fill greatly reduces the odds of this move down being corrective. I cannot get a valid upward count with the size of today’s decline. I am out of short puts and will be fully short if we close below pivots.
This is a very dicey market. It is looking like they have opted for a “managed decline” to try an avoide panic selling and a vol spike. If that is what they are up to, it’s going to be a long slow grind lower while the herd sleeps.
Hey Vern, I kind of think this is going to be a quicky.
Bob
Yep. Could be a double ZZ with modest new high ahead.
VIX suggesting complacency still reigns supreme.
Folk are now totally unfazed by 500 point DJIA swings. We are probably going to have to start seeing 1000 point swings to get anyone’s attention.
“Managed Decline” it apparently is. Move down did not look impulsive initially, but at this point, difficult to see it as corrective.
As Peter said…”All Aboard!”
What will tomorrow bring?
https://www.youtube.com/watch?v=3mRqjpRpuG0
Randy does a good job on keeping the larger picture in view.
he is a great mentor
Combine him and Pete and you have a pretty handy team. Very interesting few days coming up.
Verne – where did Luri disappear to. Really enjoyed his/her comments. Very entertaining. Any view on BTC.
She truly is amazing!
She wanted to take a break from public posting but we have been exchanging enough market anslysis and opinions to literally fill a few books! Luri is one of the best chartists I have ever seen. I told her tonight If I had paid closer attention to the dollar chart she sent me two months ago that could have been a six figure trade with a nnere 350 contracts. Live and learn….😎
Cool – try and get her back on.
IT looks like we’ve got a first wave up this morning in ES. However, NQ has too many waves, so some caution needed here. If we go to a new low, we’ll continue down. If ES rallies above 2753, we should continue up. Currencies have rallied for the most part overnight, but CAD reversed its move. So, a bit of a mixed message market this morning.
The flu continues with me, so I may or may not be around the market today.
Will do…
Hope you can get some rest and recover quickly Peter. We need you fit and fab tomorrow! 🙂
Thanks. I think I’ve lived and am back. Even though I got the flu shot, I wouldn’t recommend this year’s offering.
The banksters are working over-time to keep traders off-balance. They want as few traders as possible on board for this C wave down. Sadly for them, any newbie can look at the COT report and see exactly what’s coming. 🙂
How peculiar! RUT red. IWM green.
The system is more corrupt than we know.
I have always wondered about those bright digits posted on the exchanges….if we only knew…!
The failure of the bears to decisively take out pivots suggests to me that we are heading back up in yet anothet manic c wave of some kind. If we do not gap down past 2700 at the open, I am taking short term profits on short trades and deployimg another massive round of bull put spreads. Looks like we head back up.
So Far so good. we should have a rebound. But not much and then a further decline into Friday early in the morning. All my indicators give a low on Friday and perhaps Monday again or lower. Nearly all the analist are predicting a huge decline. And after the 19th my old indicator is going UP into 27/28th November. So If we would go low it must be quick. If this is wrong I think I stop predicting the market. But Be carefull! http://www.prognoseus500.nl/
Ung- Nat gas needs to keep running yet looking pretty good for
The year so far . )
Nov 27 is showing up a lot .
Nov 21 Nov 23- 26 I noted previously yet Nov 27 is massive and should be
An up day.
Things get interesting from there .
Peter T,
are you still sicking with below comments.. If i understand correctly you mean we go above 2815 and then fall to 2400’s
“Summary: Expect a very large drop to a new low after a new high above this week’s intermediate high. The pattern is likely to be a zigzag, but could also be a triangle or ending diagonal.”
Thanks for your guidance.
Yet another dogfight at 2700.
Bankster hanging on for dear life.
A strong move below triggers a margin call waterfall if they cannot recover it. They will not go gentle…you can bet on it!
It’s begining to look to me
Like 2353 spx and 21528 on cash Dow
Right into the range of Peters levels for a bottom .
It’s not going to happen in a day mind you
But if those indexs get there I’ll be a happy buyer
At those levels .
In the mean time, Venus is about to go direct and mercury is about to
go retrograde .
Brexit might be the news event yet it’s the cycle dates I’ve mentioned
That are key .
Just my nickel for what it’s worth
Joe
First Quarter Moon
The moon is currently in Aquarius
The moon is 6 days old
Looks to me like we may have a larger ABC up underway.
If so, we should get one more manic C wave higher ahead of “Le Plunge”.
What are you guys, who are real traders, seeing?
Sir Charles? 🙂
Waiting to see if uvxy has support once gap up is filled. If uvxy continues to head down, will see if 54.xx has support.
Interesting. I am still scratching my head over the disproportionate response of UVXY vs SVXY during Volocaust I back in Feb. I know they have since done a reverse split and reduced the leverage but there is definitely somthing crooked about the way those ETFs trade. Some days they are up or down by glaringly differing amounts despite supposedly being exactly equally leveraged. Wassup wid dat? 😀
Sir Peter T.
Kudos on the awesome call in the Chart Show yesterday.
Nice triple this morning!
I know you dislike counter-trend trades but I do ’em with flair! hehe!
Next round on me….Thanks!!
Same here. In 11/19 SPY 274 calls at .39, out most of em at 1.30. Holding a few for one last pop.
How ’bout some 260 lottos for the Full Moon before Black Friday?
Maybe shortly, would like to get them <.40
Already have longer-term Dec puts from 1.15. When over $4, Back to the high 2's now.
Massive open interest on the 255 strikes. Boy, they do look tasty! lol!
I was kinda hoping they would ramp things up a lot higher. I am holding a ton of 281.50 strike calls from a massive 279.50/281.5 bear call credit spread I rode on the way down. Oh well, one can’t be too greedy I suppose…
You’re welcome!
BTW, how do you get a triple trading SPY options?
The hammer at the low of 267.03 was the key.
Thanks to Peter I knew the move down would be reversed and nailed it!
Do the math on intra-day move of SPY from 267 -272…..
Looks like Peter T’s call for reaching over 2815 is materializing even though after a big shakeout, I guess its hard to predict all these move in details. Current 2729 spx at 2:29 pm est.
since I am new here, may I have an idea when will this 500 year bear market arrive? and how long it will last ? i think peter must mentioned before , I just missed.
shunn
Hey Shunn.
Spend a bit of time exploring the website. There is an absolute ton of information regarding the end of the current 500 year cycle free for your perusal. If you want more detailed information you can attend Peter’s weekly Chart Show when he provides quite a bit of detailed information about where he expects the market to go, and roughly when it will get there. The cost is minimal and well worth your time. Hope that helps.
thanks, just want to get a big picture first.
shunn
Shun Remember when the Dow was at 790? If so, you remember when this book was published. As the Dow was scraping bottom in late 1978, Robert Prechter and A. J. Frost resurrected an investment method that was spiraling into obscurity.When Prechter and Frost released Elliott Wave Principle, reviewers immediately hailed it “the definitive textbook on the Wave Principle”. But the book was more than that. In one of the most incredibly accurate predictions in financial history, it also forecasted the lift-off of the greatest bull market of the twentieth century.This special 20th anniversary edition is complete with a special foreword and expanded text. The book includes the basic tenets of the Wave Principle, the rules and guidelines of wave analysis, and the secrets of successful application. There are lots of books out there about investing. Yet none of them offers you a method more successful and more intellectually stimulating than what you’ll learn from Elliott Wave Principle — Key to Market Behavior.
Now though some 40 years later there are people and Peter is one of them
Who says that after researching that book that he has discovered some flaws
That he has improved on. ( I can’t speak for Peter )
Peter has done a great job navigating the market so I would sign up to the chart show
And get educated so to speak .
Here is the irony I see with some who don’t understand Elliott wave theory yet have signed
Up to EWI and have lost money reading Steve hochbergs or Robert prechters news letter .
They say prechter is terrible and has a bad track record ( kind of true , kind of )
Steve hochberg is not good .
So ask yourself this, if prechter was initially a guru for announcing the greatest bull market in history
Only to go down in flames some 10 years later and now 30 years following the 1987 collapse
Many think he is terrible . Then what did he get wrong ? And if prechter has been wrong for the past
30 years ( I’ll debate that since I did read his work and follow his newsletters from 1995-2009 )
And there is a few flaws in his book ” Elliott wave principle ” then might we question his initial wave count ?
Peter t ,
I’m truly a believer in Elliott wave theory and I do respect your attention to detail and your hard work .
But I’m having and have had for several years now a problem with this move up from the 1982 lows
To date a 5 th wave . In fact I would say based on the actual movements in the Dow that the move up
From 1982 to the 1987 peak was a 55 year wave 1 , the crash in 1987 wave 2 , the move up from 1616 low in 1987
To the 11750 high in the year 2000 was wave 1 of wave 3 . Note the 2009 lows , the math fits .
I am sorry for debating Elliott wave theory on this site so I’m going to stop . The question we are dealing with
Presently is important . Once this market does bottom and turn up then how far can it go ? And at what point to we go holy
Shut what is going on vs here is the top and then the market crashes ( as expected )
The 21528 level in the Dow and 2353 level in the spx matter to me and those levels fit Peter’s count .
I do believe we will see a deep decline into 2021-2023 .
the question being from what price levels ?
I promise I won’t ever write anything close to this again yet I do so based on mathematics which considering
Robert prechters original wave count just does not add up anymore . ( my thinking )
So shun read Elliott wave theory , read about socioeconomics read about societies social moods
and continue reading this blog, sign up to the chart show and learn .
It is all in your own best interest to understand the process from all angles and to be able to use
The wave theory yourself and as you do and follow Peter you can see yourself grasping how it all works .
I wish you the best success , be prepared to put in the time and effort .
Then you will understand the big picture
Good luck everyone !
The problem I found with Prechter and company was their obstinate bias.
The man is obviously very bright. It really does border on insanity to start calling a top at DJIA 10,000.00, and continue to do so for ten years all the way up to DJIA 26,000.00
Hochberg is a good writer, but a lousy analyst, a dangerous combination. I should know as I tried to trade his lousy calls for many months before I got a clue. His most common error, which even an ignoramus like me finally figured out, was a startling blindness to the expanded flat pattern, even when it came up and repeatedly bit him in the gluteus maximus.
Don’t waste your money!
That is hilarious. Yeah, he called a top on Bitcoin at 4,950, as it continued to head to 20K…
yes, don’t agree with Prchter, is he the founder of Elliott wave? I have read and followed his call for few years and bought his book “Conquer the crash ” 20 years ago, and nothing come true after almost 20….years. what is the point even it will come true after 20…years finally being right? We all waste 20….years being wrong! also, can’t guarantee he will be right from now! I just hope I can get at least a big picture right once for the rest of my life , which maybe another 20 years.
However , thanks to Peter , his guidance , I don’t know if peter’s mapping is different than Prechter’s ? I haven’t follow Prachter for a long time, so don’t know the difference. will be interested to sign up Ptere’s trade , after understanding a bit more if it is possible .
https://www.google.com/amp/s/metro.co.uk/2018/11/16/a-mini-ice-age-could-be-on-the-way-and-its-going-to-get-very-very-cold-8146529/amp/
NASA came out with lowest temperatures for outer atmosphere since they started measuring it. I guess we are at peak global warming !!
This is old news as far as I’m concerned, but here we go: https://www.zerohedge.com/news/2018-11-14/mini-ice-age-looms-nasa-scientist-warns-lack-sunspots-could-bring-record-cold
https://www.zerohedge.com/news/2018-11-07/major-math-error-puts-widely-cited-global-warming-study-ice
One more example of fraud from the global warming cohort. There was a time when this kind of nonesense would have zero chance of getting past NATURE peer reviewers and it absolutely shows how the so-called science has been corrupted and politicized. Does any one really think their fudging was inadvertent?
Let’s see how long it takes the cabal to start trying to discredit Dr. Lewis. Perhaps the tide is turning as another researcher had the cojones to back up his findings.
https://mmacycles.com/index.php?route=blog/article&category_id=1&article_id=225
The U.S. government ran a $100 billion deficit last month, compared with a $63 billion budget gap in October 2017. Deficits are projected to rise in the coming years as entitlement spending grows and interest expenses on the debt rise. A strong economy typically leads to narrower deficits, as rising household income and corporate profits help boost tax collections, while spending on safety-net programs tends to decline. – Kate Davidson, “Deficit in October Reached $100 Billion,” Wall Street Journal, November 14, 2018.
So, how does this happen? How is it that the U.S.A. has a strong economy, the lowest unemployment in decades, and yet the Federal government spends so much more than it brings in? In the study of Financial Astrology, we have a simple explanation, or rather a simple correlation: Saturn conjunct Pluto in Capricorn, January 12, 2020.
Well, maybe it’s not quite that simple. You might say it’s a setup, a sequence of planetary signatures involving long-term planetary cycles. The huge spending spree can be foretold by the transit of Jupiter into Sagittarius, approaching a three-passage series of square aspects to Neptune in Pisces, January – September 2019. This is a classical bankruptcy aspect, a period of overspending and overreaching in which many entities – governments, corporations, institutions, and individuals – are tempted to spend more than they bring in (think Italy and think the USA). There is a lack of attention paid to the consequences of this behavior in the belief that enough money will be brought in to cover those added costs. Except, it doesn’t. The estimates are woefully wrong. Budget controls get busted, and overruns on the account get out of control.
At some point, the credit binge is forced to stop as debtors demand payment and put a halt to any further debt increase. That day of reckoning usually happens when a strong Saturn aspect follows. In this case, the demand for accountability and fiscal tightening is due in 2020-2021, when Saturn conjoins Pluto, followed by Jupiter conjoining Saturn, and finally Saturn making its waning square to Uranus. It’s not just the U.S.A. that is under this pressure, although it does impact its founding chart. It is the whole world, and especially entities that have natal planets in 22-27° of cardinal signs. In addition to the U.S.A. founding chart, this includes Donald Trump, the Federal Reserve Board, Fed Chair Jerome Powell, and the New York Stock Exchange.
Can this be avoided? Must entities with planets in these degrees experience bankruptcy? Of course, this can be avoided. With awareness and free will to make choices, anyone under any aspect can choose to make decisions that are responsible, take into account the consequences of those decisions, and remain within the themes of those planetary dynamics. The cosmos, and the study of it known as astrology, is not a choice-maker. It is a choice-revealer. Here is the situation approaching: what choices are you going to make that will minimize the danger and/or maximize the opportunity? It’s a choice that is likely to be made based upon one’s consciousness of these matters and their potential outcomes.
Then problem is Joe, what it always has been, namely profligate spending. It does not matter how strong the economy is. As long as Washington keeps spending like drunken sailors at the local brothel the deficits will continue to worsen. The Guv’mint collected RECORD taxes in October…!!!!
Bottom line?
We’re screwed, regardless of what the economy does….unless of course we THROW THE BUMS OUT!!!
https://worldcyclesinstitute.com/same-wheel-different-hamsters-a-typical-172-year-cycle/
I used to think the natural cycle could be avoided if people knew about it, but I’ve learned too much about human psychology to believe that any more. Think abut it. This is happening all over the world. Canada is as bankrupt is the US, NZ, Australia, Italy, Spain, Brazil, and the list goes on and on.
The only way you could avoid this is through a knowledge of natural cycles, a one world government and more importantly, a universal cabal of the most honest people in the world at the top to keep a check on the predators that gradually take over through the centuries. Well, humans are naturally tribal, so I don’t know how this scenario could possibly happen.
You can argue you can elect new leaders (worldwide?), but humans also don’t change unless forced to. Besides, humans just vote in new leaders they like (merit has nothing to do with it). It’s an emotional decision usually helped along by a truckload of propaganda.
Major change all through history has been a result of revolutions. The ones that happen every 500 years are the big ones, and history is written about them (as well as the 172 year, small revolutions). But, people generally pay no attention to history. (But you’d need everyone to pay attention to make a difference)
So, my take now is to understand the forces at work, prepare properly, and enjoy the ride. It may seem a bit callous, but the herding phenomenon is so powerful, it’s proven rather pointless to attempt to turn them around before they head over the cliff. History says it just doesn’t happen. Certainly, few in my immediate area want to listen to me.
And yes, the origin of these cycles is most certainly from the Universe of revolving, cycling planets and other similar bodies that are much larger than us.
So true! I have to say I am really startled by how pugnacious some of the propagada proponents have become. I recently saw someone post pages and pages of global warming dogma, and won’t you know it? One of the papers he cited was the one above, shortly after shown to have bogus statistics. You are absolutely right about the terrifying ignorance of history.
I am increasingly inclined to remain silent and let the lemmings keep heading over the proverbial cliff.
Why endure the abuse? 😊
https://www.newsbtc.com/2018/11/14/imf-governments-and-banks-should-setup-and-control-their-own-cryptocurrencies/
There are some unexpected reversal signals in the dollar and I am wondering about the implications for the US indices.
We have yet another shooting star on the weekly chart (the one of August 8 did see a downside move). This week’s shooting star candle is also accompanied by an exhaustion gap so there may be a need for a bit of caution here with regard to any imminent C down in the indices, assuming of course the dollar relationship is pretty firm, and the dollar does indeed put in a turn here.
Hey Joe, enjoyed you’re LONG comments of nov. 14. Directed mostely to Shun.
Well done, BUT I confess to have trouble believing your “promise” to refrain
from such in the future. give em hell Joe
Bob
oops, That was the 15th Joe.
Yes indeed. Somebody needs to tell Al Gore to take his carbon credits, and stuff ’em where the Sun Spots don’t shine! 😁
A new free blog post is live at: https://worldcyclesinstitute.com/us-indices-the-edge-of-a-ledge/
Hi fellas, I have a comment on the sun spot influenced weather. The actual cycle is 22 years, divided into two halves. One half has the magnetic rotation rotating
clockwise and the other counterclockwise (of the sunspots). These halves are not
always of equal times. They are a product of the inner planets. NOW, if you look at the last three cycles, cycles 22, 23, & 24, you will see a longer term cycle rearing its
threatening head!! This longer cycle, 208.7 years in length, is a product of the
outer planets. It occurred (this minimum) ~ 1812 (Napoleon) and during the little ice age. I have carried this cycle back to Joseph’s sojourn in Egypt to the biblical famine (the nile’s flow was greatly reduced). I have carried it far beyond that and it has coincided with other so-called natural calamities. Check it out yourselves, it is very interesting. This minimum is due app. 2020 thru 2035. It is liable to be a lulu. John Casey’s book, “Dark Winter”, gives a good account (available from Amazon). Also in the 1950’s a couple of scientific papers gave a similar prediction of a coming little ice age for the planet. (needless to say they were ridiculed by the current crop of pol.s and global warming enthusiasts). There was also a book published in the 1950s on the subject. I have forgotten the title. Isn’t life interesting?
Bob
This website is for educational purposes relating to Elliott Wave, natural cycles, and the Quantum Revolution (Great Awakening). I welcome questions or comments about any of these subjects. Due to a heavy schedule, I may not have the time to answer questions that relate to my area of expertise.
I reserve the right to remove any comment that is deemed negative, is unhelpful, or off-topic. Such comments may be removed.
Want to comment? You need to be logged in to comment. You can register here.