Monday Morning Update
The futures dropped overnight in the US market, reflecting the carnage overseas. The futures look to have done a full wave down, though, so I think we’ll have our fourth wave bounce at this lower level. It is obviously not a good idea in this market to play bounces, certainly overnight. The count hasn’t changed; however, wave 3 is extended.
I put the bounce target for the SP500 at 1972, which is now a 38% retrace and the top of a small gap. It also marks the 1.618 extension of this a wave up, which is a typical Elliott Wave ratio. It doesn’t mean it has to stop there, but that’s the most likely point. We should turn down into wave 5 somewhere near that point, I think. We’ll see what happens.
Fun with a Microphone!
It’s kinda fun to watch the media and pundits scramble around for some logical event-based reason why the markets did what they did on Thursday and Friday. But, we know differently. As I watch these fools banter back and forth in meaningless gibberish, I find myself hurling one four letter word over and over again at the screen: DEBT!
Markets do not move based on events, of course. They move based on the longer-term, mood of “the herd” and in a rather precise pattern that’s highly predictable. They are also strongly dictated by cycles, as is virtually everything on Earth, including us.
In the longer-term, hopefully by bringing the knowledge of cycles through the influence of the planets to light, we can have an influence on affecting the futures of mankind to the positive. I dream … 🙂
Meanwhile, it is what it is, so let’s look at the damage and where we’re going.
Predictability
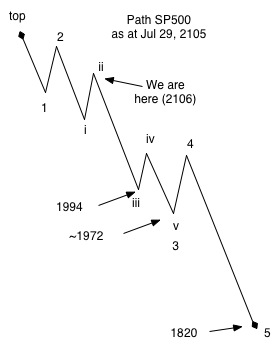 Firstly, for all those who disparage Elliott Waves, I just want to point out where we’ve been, where we are, and then move on to the next projection.
On July, 29, I posted the chart at the left showing the path forward. You can see where we were at the time by the annotation.
I projected the bottom of wave three of the SP500 at approximately 1972. On Friday, the wave came to a stop at 1971.95. I’d say that’s pretty good. But, it’s not really anything special that I did personally. Wave 3 is typically 1.6 times the length of wave 1, and it usually stops at a previous 4th wave low, which it did (you can see this on a daily chart).
When we’re in a trending market, I use Elliott Waves because of their predictability. I use cycles (in their various forms) at wave sequence tops and bottoms. That’s because, as we saw at the top of the market, Elliott waves are not very good at predicting the timing of a top or bottom. When Elliott Waves extend, it’s often difficult to know where they’re going (and they’re far more difficult to predict in a countertrend market, which we were in for the past seven years), and when specifically they’re going to stop.
I also predicted the top of the market quite precisely, as some of you know. I used the long wave projection from the Foundation for the Study of Cycles, as they’re the true masters of cycles, going back to Edward Dewey in 1941 (and his work in the 30s, 40s, and 50s). But Elliott Waves also predicted the recent market top, as many of the US indices formed ending diagonals, which are very definitely ending waves. The long wave was five days off (which is amazing on its own), and that information made it much easier to use Elliott Waves to pick the exact top at May 20, 2015. That historical post is here.
So, my point is that Elliott Waves are very powerful. But it’s taken me 10 years and almost 10,000 hours in the market to get this level of proficiency with them. Don’t pass them off as ineffective. I see way too many people use them improperly to make predictions. There are no shortcuts; you have to follow the rules. You have to put in the time and do the work (and, as I often say, you sometimes have to drill down to the one minute charts to see the underlying structure).
We have a long road ahead of us, as we’re projecting the DOW eventually below 3,000 and perhaps under 1,000.
The Next Few Days
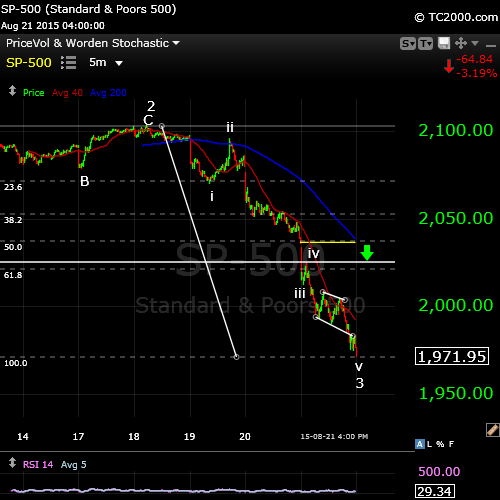
We’ll start with the SP500 (above) and the wave structure over the past couple of days. You can see the top of wave 2 and the first wave down we had (i). If you measure the distance of wave i from the top of 2, you’ll find that from ii to iii is exactly 1.6 times the length of it. That’s wave iii. Then there’s the wave iv spike. Now, the distance from the wave iv spike to the end of v is again exactly 1.6 times the length of wave i. Textbook.
If you were to drill down to the 5 or 1 minute level, you’ll also see that all the indices completed ending diagonals, with quite a throw-over. Ending diagonals are ending triangles, each wave in 3 waves and they usually sport a “throw-over” (they progress below the lower trendline of the diagonal triangle). Then they reverse in the other direction (in this case, up).
We ended at 1971.95 and I’d projected 1972. So that being the case, I deem wave three done. The next move is up 38% (the reciprocal of phi: 1.00 – 0.618 = 0.382). We’ll either turn at about 38% or go a bit further to the fourth wave, which is slightly higher. The target is 2020-2025. Then we should turn down into wave 5 which will take us to about 1820. Let’s see how we do.
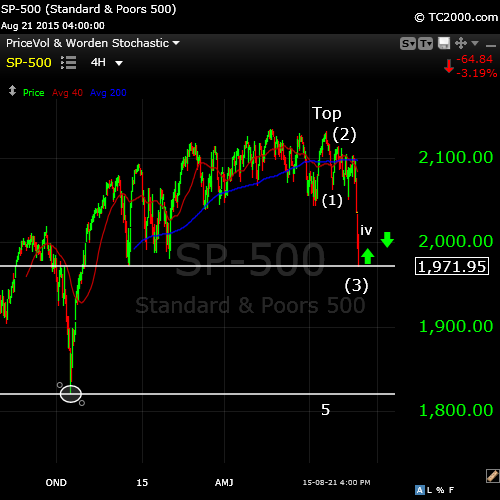
Now, the SP500 big picture. You can see how wave 3 has come down to its previous 4th wave low. That’s typical. The next stop should be the previous 4th wave low of one higher degree at approximately 1820. Then we will have completed one wave of 5 down. The next step will be a larger degree second wave retrace of 62% … and then we start the process over. And that’s essentially how Elliott Waves work.
You can bring cycles to bear if you want to fool around with knowing dates of turns at this point. With Elliott Waves, the fourth wave we’re going into will have to look balanced against all that “stuff” forming the second wave, so I give it about three days. The fifth wave down will likely only take 2-3 days to drop. Then you’ll see the fear enter the marketplace and who knows what the media will come with for cause … haha.
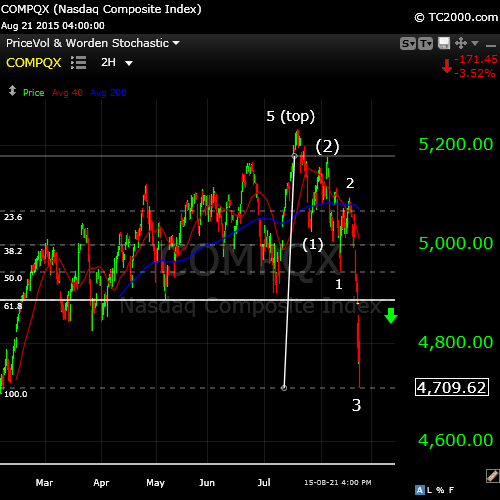
Let’s look at one more index. The Nasdaq above is interesting. You can see it’s a similar pattern to the SP500. I’ve drawn a horizontal line at the 38% retrace level. You can see there’s a gap there. Markets love to fill gaps. So it’s always interesting that gaps are usually just at the point of retrace and that’s the case here. Target for the retrace is about 4887.00.
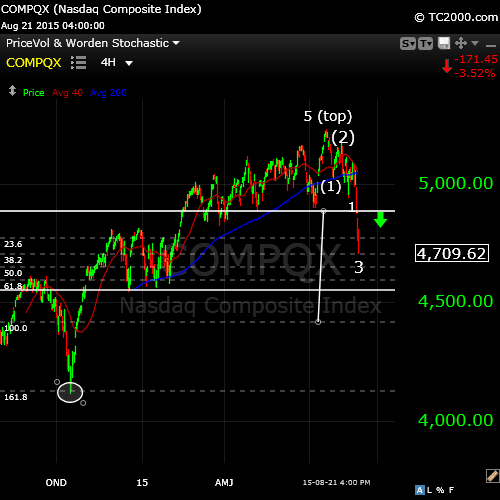
But there’s more. Now, here’s what I always find REALLY interesting. We’ll look at the Nasdaq in a wider view to see how this all works. You can see the structure of wave 1-3. Now, If I measure the length of wave 3 and then I take that measurement and start it at the wave 4 retrace level we’re about to rise to (38% retrace), you can see (on the chart) that 1.6 times that measurement brings us to the circle on the chart, the previous 4th wave of higher degree, which is where the entire first wave drop (of 5 waves) should end up. So … I’m predicting a very long wave 5 down for the Nasdaq of 1.6 times the length of wave 3.
It’s interesting to me how Elliott Waves are so precise, all revolving around the number phi (.618) and of course, how phi relates to the ratios between the planets. But I digress … haha.
This site is really about the wonder that’s our Universe and how, if you understand a little bit about how it works, you can predict the future to some degree. After all, they say, “History rhymes.” It’s important to be in tune with where it’s going.
The next two weeks will be really interesting and a great big surprise for 99% of the world. Stay safe, have a great weekend. Enjoy the ride.
NEW (Sunday) – Mid-Term Projection
There have been questions about what happens after the bottom of the impending fifth wave, so I’ve put together quick chart.
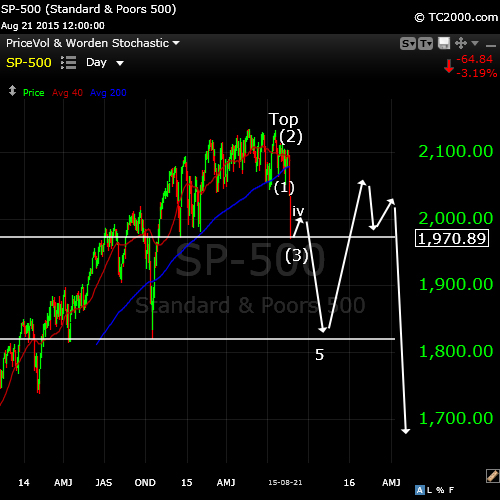
In Elliott Wave structure, what happens after five waves is that we retrace at least 62% in three waves to produce a larger degree second wave and then we head down in a larger degree and much longer set of five waves. That’s what I’ve drawn on the chart above. The top of wave 2 will get to at least 2015 in the SP500, but may retrace a little higher.


Stunning analysis, Peter,
I appreciate it very much.
Let’s see if the market will like it.
I’m ready
Good work Peter.
Do you stay out of the market in the upcoming corrective waves?
This one I’ll likely play (I got long end of day Friday).
Another master piece of work Peter. BIG THANKS. i see very clearly your ending diagonals count now. Wow, Dow 3,000????? I don’t take that comment with a grain of salt, because I too believe that we are entering a brand new phase of the market, as an epic crash for the ages is around the corner.
I m really stunned about the the precise price action what you had predicted SP 1,972 .
This is art and it’s nice to have good information from a lot of perspectives.
I mentioned the Mercury August 18/19 next is Mercury max elogation east Sept 4
That’s from friday till friday 2 weeks so it could fit in your prediction.
So it’s upppperdepub for 2 or 3 days and after that caboom…..
Cheers
Hi Peter
I would like to congratulate you on such excellent work.
You have restored part of my lost confidence in EW just after following few of your last posts / calls.
Please may ask you the following question.
On my chart S&P CASH chart , I can see a gap on Friday around the price 2035 .
Do you think that wave 4 , which might start some time next week will close that Gap ? or the Gap might not be closed since wave 4 could not exceed the 38% retrace level ( 2020 – 2025 ) ?
Regards
AZ
Thanks, AZ,
You’re right! I hadn’t noticed that gap originally as it’s so small. There’s a good possibility it will get filled. We’ll have to see. I may add a small note to my post this weekend. Thanks for the head’s up! The correction for wave 4 can always exceed 38%, and it’s more likely to in the early stages of a downtrend as there’s still a lot of optimism … “Hopium,” I call it. It can’t, as you know go into the area of wave 1, so it can’t go above 2052.08.
Much of what I had to say was in my post yesterday. The same angle in the 3rd ring would give 1840; a level that has a natural connection to the 5/20 high. Peter gives 1820. For now that’s pretty close.
Short term : It is very clear the cit is 8/23. This will likely give low in early trading on Monday. Yesterday I wrote 1970 is a strong number. Combined we could say : price isn’t there yet and timing suggests Monday. That fits. Lots of reasons for cit.
Then up again to 2034 with Wednesday evening most likely the turn. Then down into 9/5-6 weekend. Think Monday is most likely.
Cheers,
André
Thank you very much andre. Both you and Peter are on a winning streak with your precise calls. If I may ask you what long-term direction you see the markets after 09/05, especially during the usually weak geo months of September and October? I am convinced that the major corrections with super large magnitude is overdue and might not be bottoming until October, but I just don’t see the end of the bull market here. Would like to pick your brain on this.
Erick,
It’s all in previous posts, but I’ll repeat one time. I use 4 different tools for longterm timing and they all are saying the same. Big picture : Gravity gave the top of a multi year trend early december 2014. Gann timing pointed to May 2015. So in december we saw an inversion and a flat market since then. With gravity down Gann timing had to be followed. The ‘all time highs’ were caused by noise, not by a strong trend. That’s why the market could sustain that level; it was unsystematic.
So after May, there are no reasons left to stay levitated. The bull market is dead. After so many years up there was a lot of absorption to do. Dumb money had to replace smart money. That took some months. But last week showed the real picture and we better get used to it.
My best estimate for a low would now be april 2018. After that is still a long way, but one scenario says a high in november 2020. If that’s going to be a new high or a retrace is still a matter of research.
Hope this helps.
Cheers, André
Anther way to illustrate this. After WWII the world was in ruins except the USA; they had participated but not on their soil. So USA was the sole supplier. This party lasted 25 years. By 1970 Asia and Europe were rebuilt and something fundamental had changed. America was addicted to wealth now, but had lost the means to support this life style. So they had to let go of the golden standard; printing money is the only alternative you have when you can’t earn it.
Fiat money systems have an average life span of 40 years. Then the implode. That would have been 2012. The FED counter acted this with creating even more phony money.
The petrodollar is dead. Almost 100 mln Americans don’t participate in the labour proces, so real unemployment must be above 30% and rising. The middle class has been wiped out. World debt out of control. All that is left is war.
Not sure why people thought this was a bull market in the first place.
We need a system reset; a big one. Not a happy message on Sunday; but you decided to pick my brain. This is what you get.
So much appreciating your contributions to this site andre. I have been following you for a while since your solarcycles posts. Have to say you are like fine wine, getting better and better with the arsenal of tools you use to analyze the markets.You’ve never failed to to amaze me and make me think harder. Happy Sunday!
Thank you andre. Much appreciated your prompt response. You’ve pained a market outlook that is hard to deny. QEs or anything going against natural forces are not working and never will.
Erick,
Thanks. Reason I post here now is the interaction with Peter and the fact we’re on the same page.
Fun with Gann.
To please Peter I will use the NYSE. Using price to time conversion 9/19/14 gives 8/27/15 and 10/15/14 gives 8/25/15.
Now I take the 5/21 high date. Applying cardinal timing I get 8/25/15. Applying PI-squared timing I get 8/27/15.
Using 3 different techniques and 3 different dates; it doesn’t matter. This is typically Gann. I think this is what Gann called the law of vibration. The universe vibrates and all we see is reflections of this. That’s why everything is exchangeable, it all resonates with the same vibe.
This concept may be hard to grasp. But the results speak for them selves.
P.s.
The 5/21 date itself is a result of the 10/15/14 low; cardinal timing gave 5/21 and PI-squared timing gave 5/20.
Andre,
So according Gann the next retrace top should be in August 25 or 27?
Thanks
I expect 8/26; exactly in between. 8/26 strongest turn day of the week. And the trend is down; so the first date will have more power.
Andre, if we hit 1820 around early sept, sept -oct are still negative months what do you expect
Rose,
I expect a low early september, then a retrace into the equinox, then down into October 10-ish and up again into October 20-24 before the real panic selling will start. And then is basically down into early 2016. I think.
Cheers,
André
People have got used to fed coming to rescue and printing money. the entire weekend at the parties I heard them saying, even if it goes down 1000 points it will come back. so at 1820, they are not scared. what happens to the rest of the month of sept/oct. will fed intervene or it will rally these these longs will celebrate again, no real fear
Hi Rose,
What you’re describing is the perfect scenario for a market top: Complacency. All the money is in the market, so there’s nowhere to go but down. As for what happens, as per André’s explanation, I’ve added a chart to the bottom of the most recent post that explains the path ahead after the first five waves are complete. https://worldcyclesinstitute.com/steady-as-she-goes/
You can go back to 1929, 2007/8, and you can look most recently at the China market. It’s always much the same scenario.
Maybe some reasons for my dismal outlook.
1) we are heading for a heliocentric Jupiter/Saturn square, exact 9/21. Major disasters occur within a few weeks from this event. Tsjernobyl? Fukoshima? Asian super Tsunami? All within weeks of named event.
2) the lunar eclipse 9/27 will be a supermoon eclipse. And not just any supermoon, this one will end a full moon cycle that lasts 413 days. The full moon cycle is part of the Saros cycle that is used to predict eclipses. So when a full moon cycle ends at an eclipse – a rare event – it is special.
3) This year the lunar eclipses come after the solar eclipse. In 2014 the lunar eclipse preceded the solar eclipse. This is a major thing. The October decline last year is no indication of what we are staring at now.
The fact that we see all these things at the same time makes it extra special. I have no clue of what is in Pandora’s box. But we’ll find out soon enough.
André,
Futures extended lower during the night so we’ll open much lower this morning. The count doesn’t really change—it just makes wave 3 longer. We should bounce in wave 4—that’s what it looks like to me.
Peter, andre and subs. curious if any of you are using the VIX vehicles through UVXY, TVIX, VXX…etc. to capture the downfall? I have used VIX quite frequently, mostly short positions the past couple years, then turned long since July when VIX was at 12. It doesn’t look like VIX follows any EW pattern. Any spike is subject to a sell-off within days.
That mid-term projection is wonderful Peter. Like it so much. Is that something you’ll maintain as part of your future posts? It is on my wall now 🙂
When appropriate 🙂
Thanx
Peter,
This violent move looks like a wash out to me it happend in 1987 and 1929,
Do you think it will fall deeper Peter or are we in for a strong retrace rebound rall now?
Thanks..
I went long AEX…
My puts AEX 440 went through the roof bought them at 1,60 …sold to early at 8 they are now 30…
John,
Wave three has extended. I’ve been watching the futures. It looks like they’re ending their wave right now. That would mean we bounce in wave 4 here. It looks to me like the DOW will open at about $16,000—the next obvious stopping point. We should bounce in a 4th wave here. The target for the bounce will be different, of course, but should still be about 38%. I wouldn’t advise playing bounces in this market (as I just tried to do).
Peter,
Don’t you think the bounce wil be higher just like in 1929?
John,
This is still the third wave, so the bounce should be a fourth wave, which should be at least 38%. It can go higher, of course. It will go up in three waves. I’m not going to play the bounce, rather wait to see what happens.
This is what I posted two days ago. Not to boast, but to show you how to use gann techniques.
“1972? subtract 5 times 360 and we get 172. Look at sqo9. 176 is a cardinal number in the 7th ring opposite 334. This seems to me a more natural number. As S&P wasn’t able to stop there, there is likely more downside. Natural reversal points are 170, 163, 157 and 151. “
I’m afraid those numbers don’t mean anything to me. I don’t know what 170 means.
Other numbers were 106 and 69. It’s really not that difficult. Just showing these examples so we can get used to it.
what is 170 etc, are these some number or s&p 1700
Rose,
170 would be 1970. I explained in another post.
André
Thanks Peter,
I went long and see what happens.
The bradley is spot on …and it looks like hitting a bottom today or tommorow..
In terms of the bounce, the market will attempt to fill those gaps. So it may be a large bounce. On the other hand, the larger the bounce, the larger the downside.
John,
I put the bounce target for the SP500 at 1972, which is now a 38% retrace and the top of a small gap. We’ll see what happens. It also marks the 1.618 extension of this a wave up, which is a typical Elliott Wave ratio. It doesn’t mean it has to stop there, but that’s the most likely point.
Good EW summary, Peter! Until typical October lows, this market will definitely be volatile. In cash now, looking for short bounce Tuesday/Wednesday to Friday. Next week is seasonal strong, but lunar weak (phase post full moon, post perigee, weak post equator declination) so will mostly want to short next week.
Thanks, Valley. Really weak market. Best not to play bounces, imho, until we get a set of 5 waves down, which will then “set the stage” for the rest.
Well Valley,
I will likely post a chart tonight but it may not be helpful. I can only guess at which fourth wave we’re in. My best guess because of the lack of momentum is that we bottom in wave three tonight (around 1820 SP) and then tomorrow head back up in a larger degree fourth wave and will likely sit here until the end of the week. How does that fit with your prognosis? I think it fits well by your latest post. Fourth waves are frustrating.
Thanks Peter. I got lucky… Closed my shorts over the early AM panic selling, and I am long now. But I agree that there is so much weakness so it is best to not playing the bounce.
Looks like the bounce might be more than 38% though, considering how powerful wave 3 was?
It could be. I’m sure it will last through tomorrow at least, to give Europe/Asia a chance to weigh in. All the big surprises will be to the downside from here on in.
Countertrend bounces are always 3 waves. We’ve done the a and b wave and are in c. I’m focussed on 1972 for the SP500. I would be surprised if we go much above that. Wave 5 down will be destructive.
As I look closer, this looks like the 4th wave of the third. So the drop after this bounce may not be all that large. It would simply finish the third wave. It would likely take us to 1820 in the SP and then we’d have another 4th wave bounce of higher degree and then a fifth wave. So we could come down tomorrow, then bounce the remainder of the week, and then down hard next week, which would fit with Valley’s prognosis.
Excellent! Thank you Peter.
Erick,
I haven’t been paying attention, but I think this wave down is a larger b wave, which means another leg up.
Thanks Peter for your update. Now my counts sync up with yours 🙂 We’ll see how the rest of the week pans out.
Thank you Peter for your update. A break down below 1898 SPX seems like wave 3 is almost complete to me. Or it could go as low as 1835? I think my counts now very much sync up to yours, that we are at the bottom of wave 3. We’ll see how the rest of the week pans out.
Well, be careful, as this could also be the first wave down of the fifth of the third. It’s hard to tell as the subwaves are so small.
Noted. Agreed. Big thanks Peter
Hi Peter
Please is it possible to send us a new updated Predictability chart .
Regards
AZ
AZ,
It wouldn’t help. We’re waiting for the SP500 to reach a 38% retracement, which is about 1961, although there’s a gap just above it, which it might try to close. Then I don’t know if we’re in wave 4 of 3 (which is my preferred count) or the larger degree fourth wave. The former would take us to a new low to finish wave three. The latter would take us way down another 250 points or so.
AZ,
I’ll post one tonight as we now look like we’re in a fourth wave triangle with the final leg up to go, so we likely won’t make the 38% target. That’s in the SP. The Nasdaq is slightly different.
Thank you Peter
Regards
AZ
I may post one chart. I’m not going to be of much help because I can only guess at what’s happening. We’re in a fourth wave of some degree. We’re not going higher, but depending upon the count (as I explained) we could be here the rest of the week …
New post up. https://worldcyclesinstitute.com/fourth-and-holding/