
I see so many comments out there on the internet that are focused on the near term outlook of one index or another, with projections into the stratosphere. Of course, a trader has to keep his or her eye on the bigger picture and trade in the direction of the trend. So, today, I’m going to start with some “bigger picture” charts, based on my Elliott wave count (as well as a dose of logic), and then drill down to what I expect this coming week.
The Weight of the NYSE
It’s important to keep in mind the size and relationship of the exchanges versus the indices like the DOW and SP500. I rely heavily on the wave count of the NYSE because it’s the largest exchange in the world by market capitalization—by far. It’s “where the money is.”
The NYSE has a market cap of nearly $19 trillion, while the Nasdaq (the second largest in the world) has a market cap of almost $7 trillion (about the same size as the London exchange).
The DOW and SP500 are subsets of these two exchanges. While the Nasdaq (3100 stocks) and NYSE (1800 stocks) total about 5,000 stocks, the DOW by comparison has 30 and the SP500 has, of course, 500. So the NYSE is the elephant in the room in terms of money. As a result, I look to it first to determine where the overall the market is headed (this is the logic part of my argument).

I’ve maintained (since it happened) that the NYSE topped on May 20, based on the EW count and the long cycle wave. You can find it here. It’s the fourth chart down—long wave of the DOW. The NYSE above sports a clear ending diagonal of 5 waves, all of them in 3’s, which is the textbook pattern for an ending diagonal.
My count (above) shows us sitting atop the second wave ready to descend into a third. Note that while the animal spirits were alive and well in the lesser indices on Friday, the NYSE sat at a 62% retrace level. Cycle and cosmic energy waves have turned decidedly negative over this weekend and so I would expect the NYSE and other indices to turn down now.
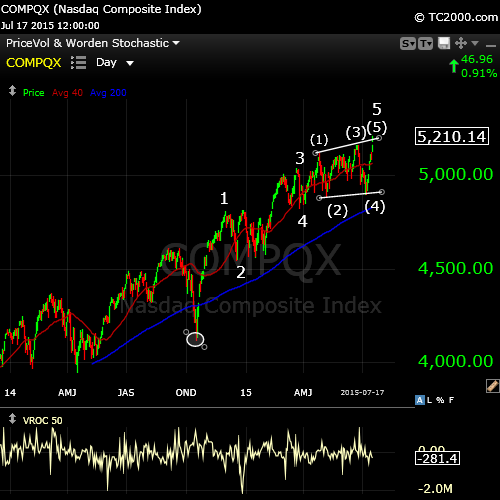
The Nasdaq exchange is the higher beta exchange, much more volatile. Friday’s wave up has completed either an ending diagonal or an ending triangle, or will with about another 10 points of rise. Either of these patterns is an ending pattern. Note the volume rate of change indicator below the chart. It turned decidedly negative for the final fifth wave up, telling us the volume was extremely thin, which is typical of a final wave up.
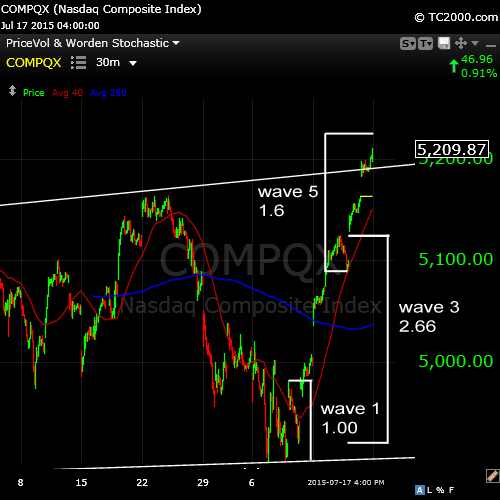
Zooming in to the final wave of the Nasdaq, I see what looks like five waves up, although the fourth wave is not very deep. Be that as it may, the lengths of the waves are textbook, suggesting that it’s a final 5th wave up (rather than 3 waves). If so, we’re shy about 10 points, which we may get in conjunction with a small opening gap reversal on Monday morning.
As you can see from the chart, the third wave was 2.618 the length of the first wave and the fifth wave is almost 1.618 times the length of the first. These are typical lengths for a motive wave. The final wave of any ending wave pattern is always in five waves Unless it’s an ending diagonal.
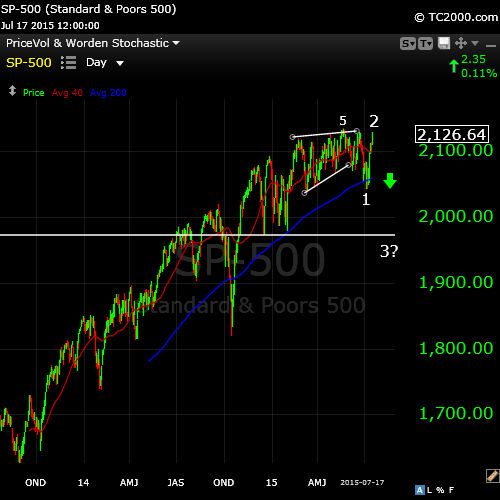
The SP500 has not gone to a new high. I suggested last week that it likely would not. That’s because the final wave up is still in three waves. As an ending wave of the sequence, it would have to be in 5 waves (an Elliott wave rule). It could still happen, but the patterns of the other indices lead me to believe it won’t. In order to complete a wave of 5 waves, we would have to turn bearish to the previous fourth wave and then head up to a new high in a fifth of fifth wave. As cycles are turning very bearish now, I’m anticipating an immediate turn down into a third wave.
A close look at the underlying wave structure of the SP500 shows the three wave sequence up. A fourth wave would mean a downturn to about the $2100 area before a turn up to a final high. A drop below this level would be a good indication a third wave down was underway.
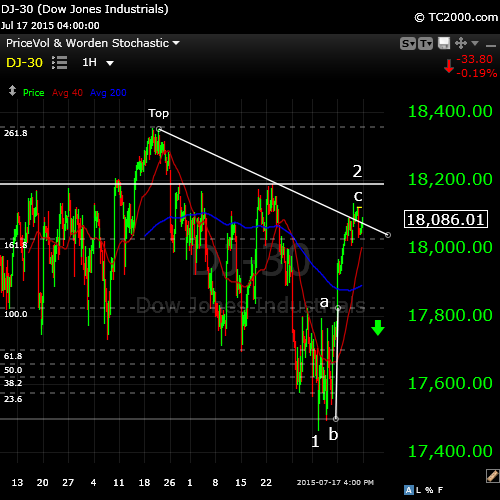
The DOW is a bit weaker than the other indices but has a somewhat similar structure to the SP500. It’s sporting a very clear 3 wave structure in the most recent up wave. I am leaning towards a drop into a third wave.
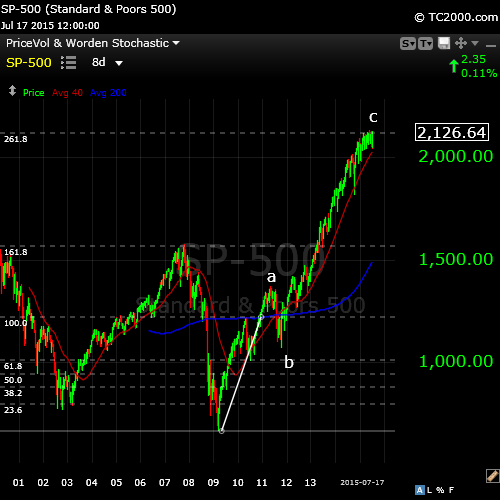
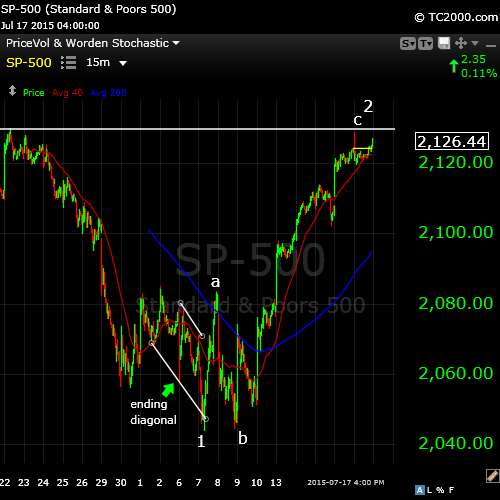
Zooming way out to an 8 day chart of the SP500, it’s important to note the lengths of the waves. Firstly, it’s a clear a/b/c pattern, which means it must retrace the length of the wave. Secondly, the fibonacci extension from the first wave (a typical countertrend wave relationship) is a multiple of phi (2.618). This would be a high probability area for a major turn down.
If I were to add in cycle indicators (like the RSI and others), just about everything is giving a decidedly bearish outlook. That’s my story and I’m sticking with it. Not much has changed since my forecasts of the past couple of weeks.


Peter, yet another well written article! My contention has been that once the stock market rolled over, it would take the dollar with it. As discussed with you earlier today, my chart shows my expectations. With ramifications for gold, (and gold currently falling to $1080 tonight – my long-term target of many years coinciding with my time target for a bottom of July 17th), I’m expecting gold to begin a new leg up shortly.
Joel,
Gold, as per the chart I sent (GLD) should, if the ending diagonal count is right, head up tomorrow. That would fit with a US market top and save my count, which is still good, but requires a turn down before the SP reaches a new high. In other words, tomorrow morning.
Thanks…….n
Have to admit 7/17 is close to my 7/20 – that I mentioned in a previous post.
Watch my words after 23 we will go down in the first wave..
7/23 will be a low with a pull back into Monday 27th. Then down again into 3/8-ish. I think.
This is starting to look a lot like a first wave down in SP500 and SPY. NYSE just keeps rolling on down …
Typo; 8/3-ish
Andre,
I thought your first august bottom was planned arround August 10?
Strong turnwindow 3-8 august; still looking at that.
If Apple disappoints…….[close]…..n
Aha! That’s called foreshadowing … I guess we did in fact, top. 🙂
Very good call Peter…..n
Thanks, but let’s see what happens from here. The waves down look motive but we may have to still test the top. We’ll see where the wave up ends. Looking for a 62% retrace. My count is still good, but it’s a bit too early to tell if it will stand.
Nick,
OK … we’re pretty much in the clear. We’re continuing the first wave down (the second half) and the target is at least 2101 SP500, and 17,700 DOW.
Thanks !!!
Now I’m a bit up in the air. Futures (emini ES and NQ) look like perfect motive waves down and they all measure correctly. I can’t tell what’s going on the US indices … they’re really difficult to see at the moment. We’ll see what happens tomorrow to get some clarity. The NYSE is the clearest at the moment and it looks like it’s got another leg lower coming. Till tomorrow …
Like I said; 7/23 a swing low. Now ABC up into monday 27th and then a more sharp decline into August. Current thinking 6-8.
This all within a longer cycle down into December 7-10.
André,
The wave structure is very clear now. We’re struggling to complete a second wave up. It’s obviously a very weak market so it may take another day to get there …
EUR/USD in a third wave up, dollar down likewise. Gold starting to perk up. NQ and ES futures have beautiful textbook-like first waves down and a countertrend move that’s struggling, but will get there …
Took 5 mins to read through the comments on solarcycles. They seem so “lost” … I’m debating whether to post there one last time … I mostly get slammed, so doing so has questionable results … Thoughts? I tend to catch up once a week, but the dialogue never seems to change much.
I used to post there but I’ve stopped. I see so much more value in your site as I am very enthusiastic about combining EW theory with timing tools. Hope really we can continue this.
Yes, I have similar aspirations. Putting cycles and EW together seems to be “the holy grail.” Thanks for all your input. I knew you used to post there. I tend to try to stay away from all the “noise.” It distracts from pure technical analysis.
Peter,
I think that fits nicely with a swing high on monday before we start a more energetic wave down.
Andre,
I think we are down hill now till 29/30 July
Peter also mentioned in his Barydyne (planet model) exit half at 31/7.
I don’t now exactly what it means but it looks also down hill till that time to me..
Cheers
We’ll see.
The exit half at 31/7 was just their trading instructions to be short until that date and then exit half, expecting a bounce in the near future.
I think what we’re seeing today is the NYSE’s attempt to get that index and the Nasdaq back in sync. The NYSE (DOW, SPY, SP500, etc.) is in a third wave, while the Nasdaq is in a first wave down.
We’ll see how it all plays out … the market is really quite broken.
Peter,
You may recall I told you about the 7/20 date, and how that was calculated on the 2007 high and the 2009 low. So this 7/20 shouldn’t be taken lightly. I really think it gives a long term change in trend. So markets should be broken; badly. Bob McHugh registers Hindenburg omens almost every day. DJ Transports has been down for some time. Revenue of Caterpillar (construction) and UPS (delivery) down. All this should be expected at major highs.
I’m more concerned with the subwaves right now. ES seems to have morphed into a 3 down and all the major indices now look corrective. In fact a few have come down to the previous 4th (SP500, SPY). I wouldn’t be surprised now to see part of this market turn around and go up to a new high. The Nasdaq Comp is overlapping and definitely headed to a new high. NYSE is the only one that doesn’t stand a chance of a hew high. I think the DOW is also done.
So tomorrow we’re going up … how far is the question. But however far it goes, it should be the last wave up.
Tomorrow will be up alright. Into a high on Monday; a strong turn date. All major cycles are down. But ‘false tops’ are part of EW theory. Short squeezes aren’t a reflection of sentiment but can push markets up. Maybe some new highs. But like you said it will all be final.
Good, we’re in sync. The way the market is setting up, the next wave down is going to be fast. There’s very little now holding this thing up.
New post, buddy.
We need a 10% down move in a short time than we are talking just like the Dax did…
But the real breakdown will start some where after Sept 10…
My best estimate for the low in this cycle would be 8/8. It comes from multiple sources. As august 8 will be a Saturday, Friday 7 will most likely give the turn. Monday would be 10. So not so far off from my previous forecast.
Same forcast like Peggy from Spiral update..
p.s.
Next Tuesday another severe weakening of force. Consider this the last straw the market had. And it will vanish. Just like that. And we’ll have to wait until early December (7-ish) before we see some force reappear.
Hi all!
I am Wouter from the Netherlands, I Swing Trade on the AEX Index (Dutch stock exchange) and am not a standard guy (like some others on this blog) when it comes to analyzing the markets. 🙂
I just wanted to say that I really appreciate this blog by Peter. Also I would like to thank Andre for his ‘Astro’ insights. I really appreciate those! So please continue! 😉 Looking at my time cycles, I see 3-4 August as important turndates. 😉
I read that you guys also read SolarCycles.net? I read the site as well. However, it seems that there is to much discussion going on. And I was already missing Andre so I am happy that I found this blog (somebody named it I believe, I can’t recall). I just wish we could get ‘Valley’ from SolarCycles.net over to this blog! I like his views as well.
Well a good night to you all, 12:00 AM now in NL. 😉
Greetings,
W
Welcome Wouter!
You’ll fit right in!
I don’t read SolarCycles much any more. As you say, too many comments (about nothing – addition 🙂 ).
Thanks for the kind words.