
Update Wednesday, Sept 16, AM
We have a very bearish looking triangle formed on all the indices. In the futures, it’s an upward sloping channel, which is also very bearish.
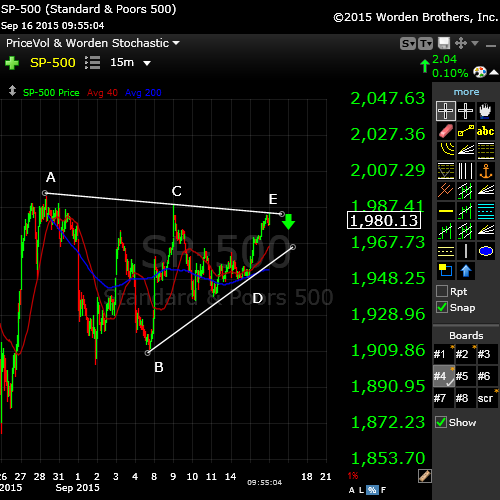
Take a look at the SP500 above. All the indices look very much the same. It’s an odd-looking monster, but still a triangle. You’ll see a version of this on all the major indices. The safest place to short a triangle is when it drops over the lower trendline.
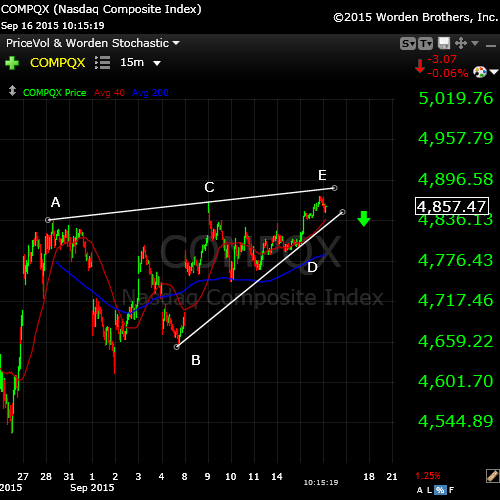
And check out the Nasdaq. That’s about the biggest, scariest wedge I’ve ever seen. I wouldn’t be long. GLD (gold) is also on the move up this morning.
Update: Tuesday, Sept 15, PM
Here are the time spans of all the waves in this first motive wave series down:
- wave 1: 5 days
- wave 2: 3weeks
- wave 3: 5 days
- wave 4: 3 weeks
- wave 5: 5 days?
Update (Monday 11:30 am EST): Here’s a chart of the SP500 after this morning’s action.
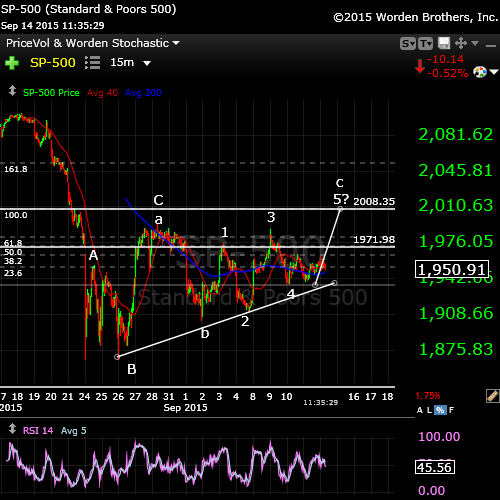
Looking at the SP500 (above), the most likely projection is for a top at either the top of the previous 4th wave (a) or a little higher to 2008. The case for the higher number is the c wave. c waves are typically in 5 waves (which makes them an ending wave, as wave 5 is always the end of a trend). You can count 4 waves so far. We are ending the fourth/beginning wave 5 up this morning.
Wave 1 and 3 are almost the same length (the third wave is always the longest wave) and a projection of the 1.6 times the wave 1 from the bottom of wave 4 takes us right to 2008. 2008 is the junction of the previous wave 4 down, which is a typical retrace point. All the waves are overlapping, which is typical countertrend. There’s no question we’re heading down and the Fed meeting on Wednesday is the likely turn point.
_____________________________
Original Post from Sept 11 (from here): The train’s pulling in to the station, I think. It’s not “All Aboard” time yet, but it just might be on Monday. And then there’s the Fed meeting on Wednesday.
Wave 4 patterns are always the most complicated structures in an entire motive wave sequence of 5 waves. However, this one takes the cake in terms of my history with the markets. It has been SO drawn out and there have been many twists and turns. It’s one of the reasons I simply stay away from trading within them. Wave 4 is the next to final wave in a motive Elliott Wave pattern—we still have the final wave down to go—wave 5.
The next couple of weeks look volatile:
- There is China data coming out Sunday night, which is also a solar eclipse.
- The Fed meeting is on Wednesday, and there’s a lot of expectation that rates will rise. The result may be a big disappointment. But the two days ahead of the Fed meeting are typically bullish.
- On September 27 is the lunar eclipse, which forecasts volatility.
Prognosis: The bottom line is that the trend is currently down. Once we properly finish the topping process on Wave (4), the market will head dramatically down to new lows. The issue is the exact timing—Monday through Wednesday. There is an alternate count which could make the turn point slightly higher.
Caveat: The expectation is that we will rally on Sunday to reach the (4) high. If we continue up over the next couple of days, we could rally as far as the 62% retrace level (another $30 or so in the SP500). That’s an alternate scenario that’s much less likely. I’ll explain both scenarios below.
I’ve got a couple of extra charts at the bottom tonight. The EUR/USD pair has a really clear path as of Sunday night (update) as it failed to turn down at Friday’s stated inflection point. It’s in a corrective wave pattern so it’s just a matter of time until it rolls over. Gold is waking up and should head up and the US market turns down. You’ll find the pertinent charts below.
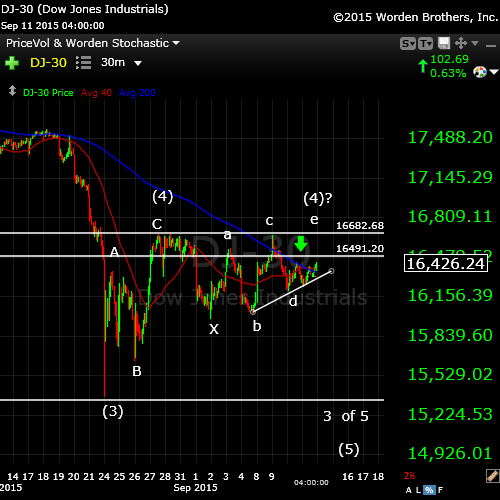
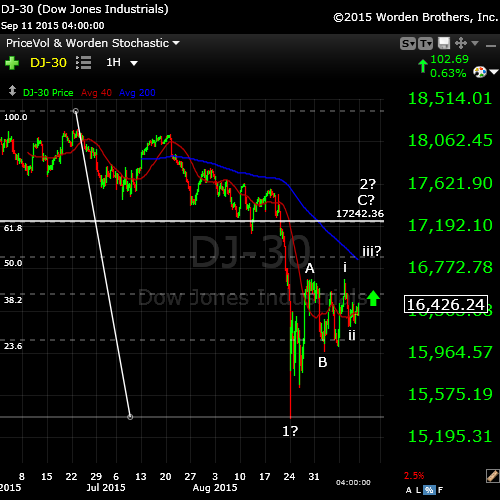
Let’s start with the DOW big picture. You can see the present top of the DOW wave 4 marked by a (4). I keep coming back to the first wave down from (4), which is X. I maintained at the start of this structure was a wave that came down in 3 waves (corrective).
Since then, it appears that we’ve been attempting to rally back to the top of (4) (weakly) in a sort of triangle pattern (abcde). With today’s turn up, which was unexpected, it changed the wave structure. I’m expecting wave e to complete in either a double top to complete wave 4 or continue slightly above it before a turn down.
The wave 4 top in the DOW is ~16,682. All the other indices have the same structure more or less and will all turn at the same time.
This will make the entire structure a “do over,” as wave 5 down will begin again at the top of (4) with wave 1 of 5 down. Depending on what the futures do this weekend, we may head down Monday morning.
The alternate count is only a difference in the amount the final wave travels past the top of wave 4 in a continuation of wave C, again a corrective pattern.
Most likely in the DOW is a stopping point at the top of wave 4 (where wave C=A) at 16,682 or at a measurement of 1.618 X A (measuring from the bottom of A, at , if we measure wave A up, 1.618 times A (from the bottom of A) in the DOW gives a target of 16,986. But the top of wave 4 is also right at the previous wave 4 point, so 16,682 is much more likely.
An alternate stopping point is 17,242, which would be the top of wave 2 (62%). A turn at this level would result in a much larger set of waves down. I think this highly unlikely. But we’ll wait to see what happens Monday before we delve any deeper into that scenario. The interesting thing is that the 62% mark is also at the exact point the wave C would equal 1.618 times wave A (the market typically has these relationships).
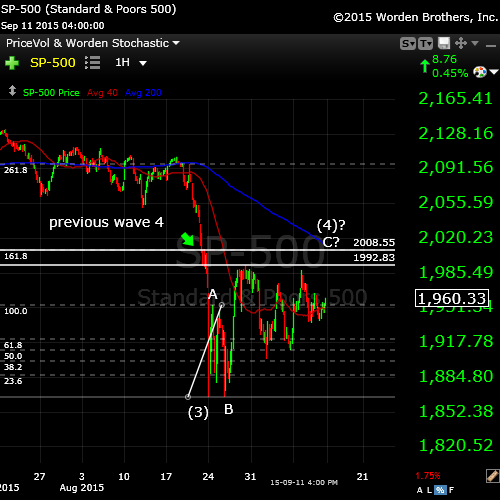
In the SP500, measuring 1.618 X A from the bottom of A brings us to 2008, which is the previous 4th wave down point. This would be my preferred stopping point for the SP500 above the top of wave (4).
The wave structure changed today. The chart that shows this the best is the next chart: the SP500 futures chart.
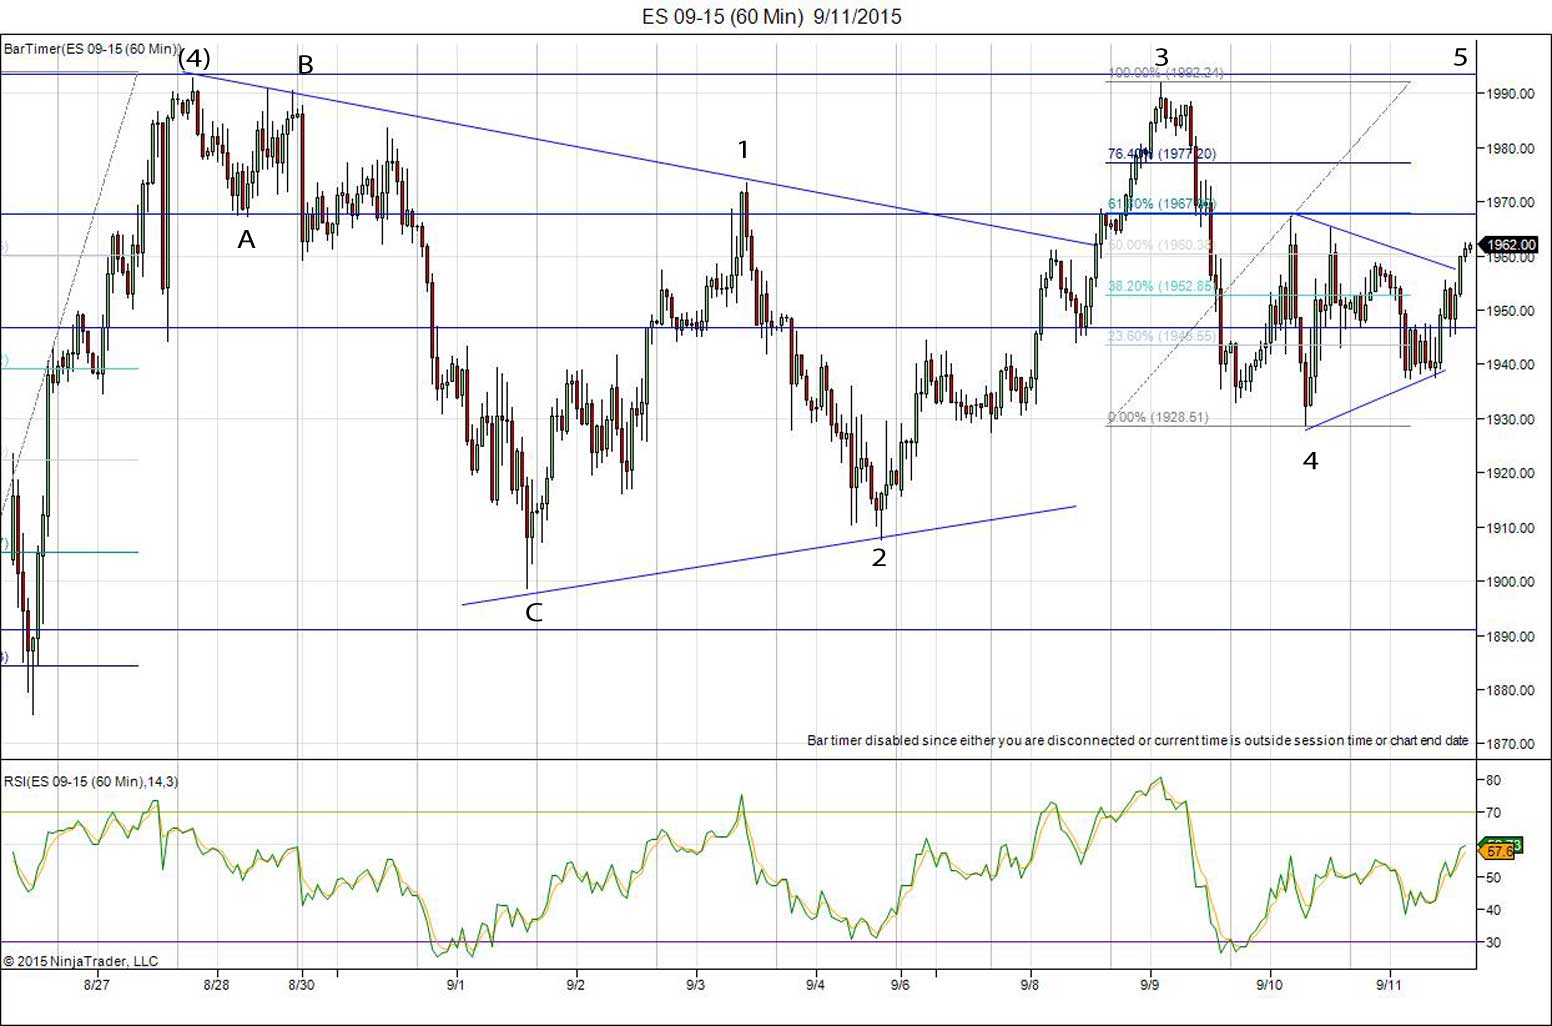
Here’s the ES (SP e-minis futures). This is a 60 minute chart showing all of wave (4), starting with the top, which is labelled. You can see the first wave down, which I’ve labelled as a 3 (ABC). It’s not motive-looking—the top portion is in 3 and so destroys the count for the entire wave. So, this means it must retrace, which tonight, I realized it’s been trying to do for a couple of weeks now.
So, we’ve got an ABC down and then we’ve got 5 waves up. The ending wave of any correction is always in five waves. The overall correction, from the very bottom of wave (3) not shown here, is an ABC correction, as well.
The prognosis: We’re going back to test the to of wave (4) and then we’ll start down in wave 5.
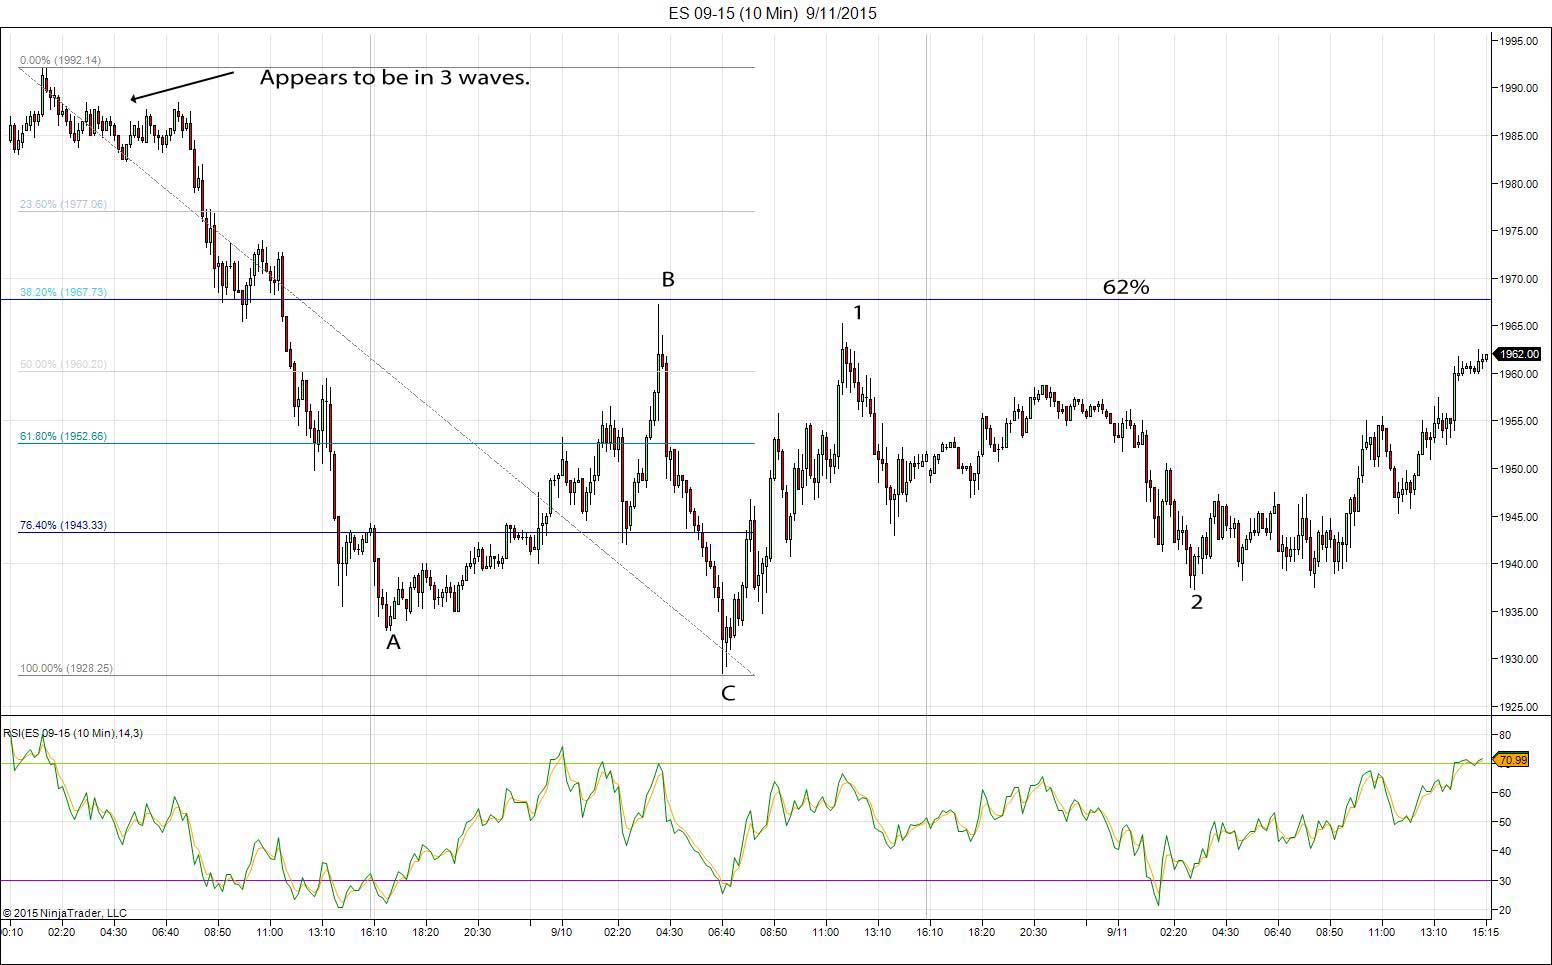
This is the closer shot of the ES (e-mini futures, ie-SP500). This is the last couple of days only. You can see that the wave that came down on the left (the A wave) looks to be in five waves, but then it went up 62% in a B wave (just to fake us out) and came way down to a new low (C), which made the entire wave an ABC corrective wave. Waves in 3 must retrace.
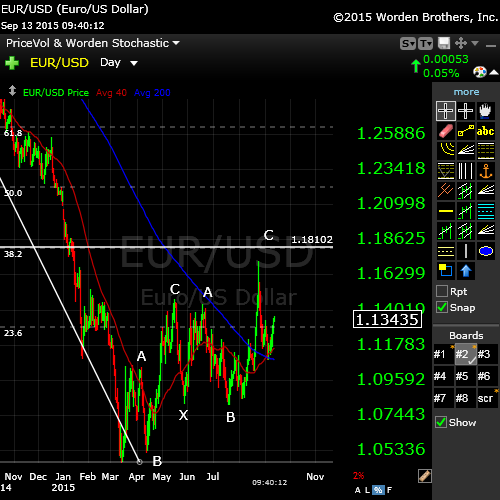
Update: Sunday, Sept 13. Well, I thought the Euro had topped on Friday, but the move tonight completely negated that possibility. I like to take a position in terms of where a trade should go and then provide a level at which I’m wrong. Sunday proved me wrong with no loss.
So, we’re back to waiting. The big picture is that the EUR/USD pair is in a countertrend move (ABC) and so it’s just a matter of time before it rolls over and heads down, down, down. I would now expect the turn to be at the 38% retrace level (about 1.181).
The US dollar is in exactly the same position (in reverse) and we expect the next BIG move in the dollar to be up. But it too has to roll over first.
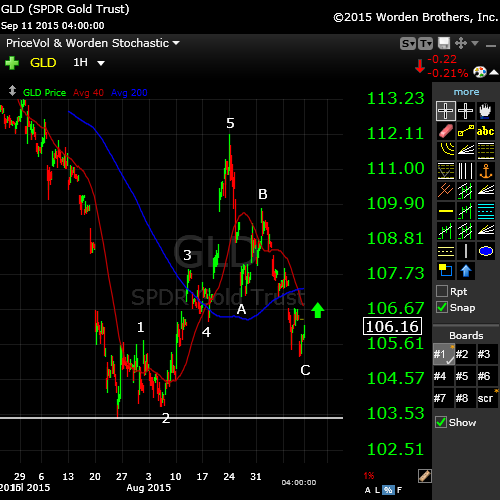
Gold (in this case, I’m using GLD) looks like it’s about the take off … finally. We’ve done 5 clear waves up from the bottom, which is a first wave up. Then we retraced deeply in an ABC corrective wave. Today, we started to perk up and I expect us to head up from here.
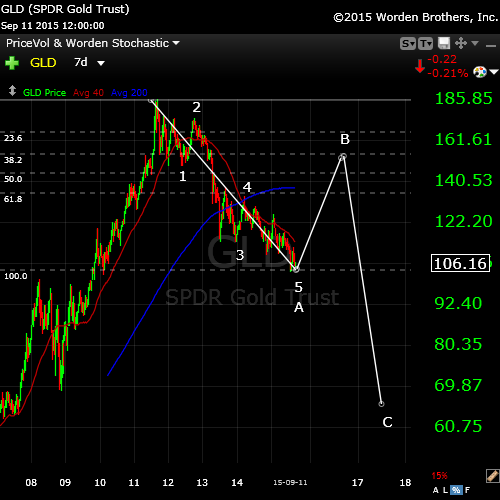
Here’s the longer term view of gold (in this case, the ETF GLD). We’ve completed wave A down (it ended in an ending diagonal) and we’re poised to head up in wave B, which should retrace about 62%, which would take us to about $153.50 before turning and heading down in deep C wave. The C wave should take us down past the previous fourth wave at about $69.00. The gold commodity should trace out a similar pattern.
Take care and be careful out there! Next week should be volatile.


Hi Peter
Thank you for your update and your hard work.
If you remember in my first post I sent out few weeks ago I did say that EW was a lagging indicator rather than leading one ( in my opinion ).
When using EW , you end up changing your count again and again to follow the market movement , rather than the market follow the EW road map .
I say that since I have followed Robert Miner and Prechter work for years , and kept being disappointed with their results, since they keep change their wave count to fit it with the market movement .
Your excellent work have restored some of my confidence in EW , however if we end up closing the gap at 2035 ( S&P ) before we take the low of August 24th , then EW is over for me once and for all.
Once again , thank you for all your effort and help , and I will keep watching and learning.
Regards
AZ
AZ,
Thanks for the kind words.
I’ll respectfully disagree in one respect. My count has been the same for months – actually, since early May. We’re in the midst of five waves down.
I used EW and the long wave (cycles) to predict and call the May top in April).
Now, I normally don’t trade a fourth wave because it can be impossible to predict at times, and we tend to be “in the weeds” at the moment. The daily ups and downs are difficult, yes. But I don’t day trade. I’m of the opinion that you make much more from the market from a swing trading approach.
So EW is predictive on a weekly and monthly scale much more than daily. I’m still predicting a drop to the 1700s for the SP. And even in the weeds, I don’t know anything else that can be as predictive of price than EW, even with the twists and turns. I think you’re expecting too much of it. Show me another method that will predict price levels more accurately. I haven’t found it.
All I’m doing is using a tool and trying to play as closely as I can to the rules (with a good dose of market experience).
I too got frustrated with the Prechter group as they typically give two counts (“We’re going up or down!”) and they won’t drill down to the minute charts to see what’s really going on. EW is fractal and you need to do that. They still do that today (as I do get to see some of their work weekly and I disagree quite often).
One more point. I truly believe that putting EW together with the historical psychological impact of the cosmos can go a long way in providing a more predictive path to prosperity in and out of the market. But unfortunately, none of this is perfect science … sigh.
Thanks for your thoughts on this, AZ.
Hi Peter
Thank you for your reply .
There is no way I can compare your work with the work of Prector & Co ., and personally I think Prector have done so much damage to EW than good.
I have full respect to you , since you are trying your best in putting all your time and effort to explain every detail in every move / wave , which is very hard to do , and even you try to do it during trading hours , which make it harder .
At this stage I have trust in you ( Peter ) and not EW , and I hope within time this will change positively .
For now I don’t trade based on your EW count , but by using my Geometry patterns ( wave 59 Vortex ) , which took me some time to get it right , and I am happy with the results . It would be nice to back up my Geometry work with EW , and this is why I keep asking you , since I am very keen to learn rather than to just trying to prove a point.
One thing I would agree with you , and that is my work shows that the low will be around 1758 – 1760 ( S&P DEC Future contracts ) , and I think we should reach that low by Oct 2nd latest . I am more confident about the price target rather than date ., but at least that what I see.
If you decide in the future to launch a service based on paid up subscription fees , than I will be the first to subscribe with your service , disregard whether you keep changing your wave count or not :-))
Regards
AZ
Haha! Yeah, the joke is that Elliott Wave tells you where you’ve been and why, rather than where you’re going. But I think it’s the same as history. Understanding where you’ve been will predict where you’re going.
Anyway, we’re on the same page re: direction.
Hmmm. 59 Vortex. Is that an offshoot from Gann’s work?
Yes, I may do a service. My dilemma is that I’m a speaker and want to be more active in that area, so I’m working on a system using video for market updates (Camtasia) rather than spending the time writing and updating charts. Haven’t quite figured that out yet …
Truth be known, I spent about 6 hours on last night’s update, as so much changed in the market yesterday. Gotta cut down that time!
Sigh … once this first set of waves completes, the road ahead will become much clearer … hopefully.
Thanks for your input, AZ!
Hi Peter ,
3 – 5 minutes video update after market close will be a very good idea , plus a longer video on Sunday night where you can go thru long term charts , strategies …etc .
Gann Global Financial have a service where he sends a weekend update , but very long ..about 30 – 40 minutes , I think that is too long .
Wave 59 Vortex was created by Earik Beans , it can be used with other Gann tools from Wave 59.
Good luck
AZ
Thank, AZ.
Good feedback. Less is More. I agree.
I also added an SP chart this morning to the post and updated some targets for the top of 4.
I think the key here is not to rely too much on the prediction since counts can change. Even cycles change. Not to say they don’t work, but only a few in history can accurately call it.
Hello, Peter,
the FED is on Thursday. So, we have few days usually bullish with possible final spike after FED.
Your alternative count is what I was thinking about last days. It sounds for me more reasonable that the market haven’t yet finished the big 4 wave and it is still in its C wave up.
In such case the fifth wave of this C wave in ES may go much higher than the high of wave A that is marked at your charts of ES as the top of the wave 4 on the 27 of August and almost completely retraced in futures on the 9 of September.
If you put the possible top for DJ at 17242, so ES may go up to 2050 in its fifth wave of the C up.
Some analysts gave this target area one week ago but last two days they abandoned it and everybody is targeting 1800 and lower now.
It has become too bearish since Thursday.
So, your alternative scenario may be fits better with the timing and would allow to the market to wash out the bear sentiment before the descent in the 5 wave.
Dmitri,
Valley a week ago predicted a positive bias until Tuesday night and that fits with this scenario. We’re in the last wave of this countertrend move. That I know.
The question is will it hold up through Tuesday/Wednesday or start a leg down before that? We also have a solar eclipse this weekend (as well as China data). So … a really weak market with natural and unnatural elements that could dismantle it. And there’s panic beneath the surface. That’s about as accurate as I can be.
There’s one other thing I should mention. Extrapolating from the first wave of a sequence is typically highly accurate. If we take wave A, 1.618 times Wave C would give an SP top at 2008, which is exactly (or extremely closely) the top of the previous wave 4 down—a frequent corrective wave 4 stopping point.
If wave 3 exceeds the top of wave 4 in the SP, 2008 would be my target.
Last week when you told that we were already in the fifth wave I hoped that the market would begin its decline in front of the FED approaching in order to influence its decision.
Apparently last Friday this opportunity window was closed.
The market can’t go down right before the FED.
The leg down in Europe on Friday was on very small volumes driven by the US futures during only European session with risk-on stocks recovered in the second half of the day.
Usually it happens when the market wants to turn up in after.
So, I think next week it will be moderately bullish until Friday.
FED wouldn’t like to break the market from one hand and to destroy its “forward guidance” from the other hand.
So, the bullet may be in the middle. They may hike the rates but only by 0.10-0.15%.
The market will be happy and ready for the fifth wave when everybody is in the train.
I think the Fed’s hands are tied. I don’t think they have any choice in what they do. They’ve been trying to pull the wool over our eyes for a very long time. They know how weak the market is. I would not be surprised at all to see no movement in rates and a panic drop in the market.
Monday and Tuesday are the wild card for me. And forces turn negative Wednesday.
I added a paragraph under the lower DOW chart in the post giving some projected stopping points for both the DOW and SP500.
Thanks, Peter
Thanks very good !!!!….n
From 9/9 we are down into 9/17. The turn on Friday (see the tidal inversions I posted last weekend) will result in a high on Monday. And then down into Thursday. My guess is there won’t be a rate hike and the market wil jump on the good news, to reverse a few days later (around 21st) to head lower into the end of September. Retro Mercury conjunct the Sun with a supermoon (closest perigee of the year) and a total lunar eclips that ends the tetrad begs for a low. Sunday New Moon at Apogee; should really be a high.
Last : tomorrow the end of that Shemitah cycle. As this is a 7 year cycle it won’t time exactly, but September should be volatile (strong correlation with crashes). I have mentioned before the heliocentric Jupiter Saturn square that wil be exact 9/24. And the start of a new full moon (412 days) cycle, possibly a new saros cycle.
Things will get wild.
Cheers,
André
Hey André!
I cannot concur with down into 9/17. I think we are up into 16/17 September and than we go down into 22 September, up into 28 september. My forecast for september. 😉
Pricelevels: 2040 and when we go in overshoot mode the 2070 level.
Cheers,
W
This is an interesting scenario, because we should have a small wave 1 down, short 2 up, and then a large 3 down, another 4 sideways (but not anywhere nearly as big as the one we’re in) and then a 5th of 5th final plunge.
Great info Andre. I agree with your market forecast, except for one little blemish mid week to fake out the Bears. Depending on how the markets come down Tuesday. I may go long for 24 hours than back to short into the 17th. I will be able to confirm that bounce later on Tuesday with my indicators. Best of luck to you.
To put things in perspective : next week Saturn will enter Sagittarius, home of the galactic center. The Galactic center is a huge source of energy that travels through the solar system and affects us, earthlings. Saturn is a big boy and when it positions it’s self between Earth and the Galactic center it will reflect a lot of that energy. This is will bring change. Saturn will stay in that sign for 2 years which correlates nicely with an expected low in 2018.
It will take more than a year for a full conjunction, so the effect will get stronger with every passing month for the next year and a half.
André
Your view for the coming years is what I see as well. I just could not have guessed it would take about 3 years. 😉 That is why you are the master of Gann/Astro. 🙂 Thanks for sharing André!
Cheers,
W
PS: Peter, thanks for the update! 😉
Last three Sat in Sag have corresponded to mania in market peaking in 1987 (29.5 year rotation), 1958, 1929. Interesting South Sea Bubble and Tulip Mania corresponded with Sat in Sag as well if memory serves. If you buy the “Electric Universe” model of Sat being original Sol or Helios and earth once being in its mini solar system before our current sun captured Sat, Earth, and Mars into its electrical domain, then it is understandable why when Mother/Father Saturn is in the river of Galactic energy it would have an effect on the child Earth. Based upon this, I would expect a high in 2018 not a low, although I realize this may seem to be a stretch.
That is no Stretch at all Valley. I fully agree with you. I see this short term time frame, nothing more than a correction phase. All years ending in a 5 have been positive by the end of the year. Later this fall, I would expect a lot of bears are going to be ruining their accounts.
Great info Peter. I see some very wild swings in the market coming up. I do NOT believe we will see Quotes of 2040 – 2070 spx It does NOT make sense with my own indicators. We will have some down drafts in the market this week testing at least the previous lows.
Every one is waiting for the fed meeting this week. I believe the Mr Market is going to pull the rug out from most investors, eyeing the fed date. I see a strong down draft in the markets from Monday _ Tuesday. A very strong rebound Wed to fake every one out.
I am looking for spx 1880 min – 1820
Good luck every one
Those investors waiting for sp reaching 2040 – 2070 are going to be very disappointed !!
Dave,
Here are my targets for wave 5 (preliminary).
DOW 14,050
SP500 1739
The 5th wave should be the same length as the first three waves. And sure enough, that was the case within wave three down. It’s fractal, even in length.
Peter, your figures are very close to mine. I have the Dow coming down to the 14,320 Sp 500 1710 – 1725 With all my indicators, It looks like a 81% chance of the dow and SP 500 coming down to those figures. I am not saying this week. But certainly we will see the Bull start to roll over.
Dave,
I’m also trying to figure a time for the China data. What do you make it BC time? 11:30PM?
Sorry Peter, I do not know the exact time. I just know that the Data is coming out Sunday night eastern time. Personally I would not trust the Chinese Data any ways. Andre” time cycle for Monday conflicts with my cycle work. LOL Based on our two outcomes, we both maybe right. Pre market highs put in and lower values in the market by the end of the day. Either way both Andre” and I our on the same boat for later this week.
1:30am NY time; should be 23:30 your time
Thank you Dimitri for clarifying the time.
Thanks, Dmitri!
Dmitri,
Tonight, ES is in the fourth wave of the C wave up (bottom at 1950 or so) then we should head up in the 5th wave, which I put the top at about 1985, which is about the top of the larger degree fourth wave. So far, so good. This also correlates with the C wave being 1.618 X the length of the A wave.
Thanks, Peter,
Hope it will stop there
My high on Monday is primarily based on timing. Friday I had a tidal inversion that gave a low. So, logically, the next inversion should turnthings down again.
Sunday we have a tidal extreme (multiple sources), partial solar eclipse, new moon and a cosmic cluster date. On Monday Apogee (formally Tuesday, but distance is flat from Monday on). Monday a Bayer #38 inversion (Heliocentric latitude), a speed diffiferential venus/mercury inversion and another cosmic cluster date. To name just a few.
Big picture is that 9/9 marked the beginning of a new 225 day venus cycle and this is what the market needed to test.
Overall, the lunar cycle is down. But the next Apogee will be the farthest this year and the next Perigee the closest. This indicates that earth is going to change direction within the apogee/perigee orbit; it has reached an extreme position. I consider this to be significant.
Anyway, I see a massive inversion Sunday/Monday. 9/17 Mercury retrograde. With mercury always +/- 3 days = 9/14-9/20.
The 9/9 – 9/17 swing I see in everything I look at.
We’ll see next week but I would really be surpised when it doesn’t play out like I said. But that’s just me.
Cheers,
André
Very Impressive, you nailed the high for today.
Thank you Andre
My prediction for the market:
I was wrong mercury retograde date is not the 14th but on the 17th..
So I expect these comming days will be down and/or sideways we will plunge into Sept 21/22 after that recovery till end off the month and after that capitulation till end off mercurius retograde Okt 9…..
but this monday will be a down day…
10/15/2015 will be a 1 year anniversary of the 10/15/2014 low.
So I think 17 low, 22 high, 30 low, 10/6 high, 10/14-ish low.
10/15 Mercury declination crosses the equator upwards; perfect spot for a low.
PALS and SPX
Monday: up
Tuesday: up and tops
Wednesday: fed meeting flat
Thursday: sell off due to fed raising rates .25%
Friday: continuation sell off
Note: PALS is a combination or 3 lunar aspects: phase, distance, and declination each one of which has an effect on SPX. Also include seasonal data from Stock Trader Almanac.
Well I admire your courage to stay in the market Valley, still holding on to your target SP 2025-2040 arround Tuesday?
Do you also have a date and a target for the low ?
Cheers…
No idea, just trade PALS and try to stay fully invested unless PALS is negative.
Andre said, “9/9 marked the beginning of a new 225 day venus cycle.” Do you think it’s possible 9/9 high marked the top for September?
LizHM,
Yes; with the supermoon total eclipse, the sun conjunct the north node (=moonwobble), heliocentric Jupiter/Saturn square and lots of other reasons I expect a volatile downtrend into mid October when the 88 day Mercury cycle is at 90 degrees and the 225 day Venus cycle is at 60 degrees. Gann timing on DJ1929 gives 10/17 as major date. 10/16 Mercury max west.
Thank you Andre!
The one-hour chart of 9/9 to 9-11 is similar to 7/31 to 8/4 or 8/5 to 8/7. For 7/31 to 8-4: Aug. 5 had a gap open but didn’t reach 7/31 high. For 8/5 to 8/7: Aug. 10 had a gap open but didn’t reach 8/5 high.
Due to personal issues in my life, I will have to curtail any more postings for a while.
LOL wasupp will be happy.
I am changing my views on the market for this week. I calculated the wrong percentage of 81% chance of the markets coming down hard. My main indicator is not cooperating with that scenario. I still see a mild down draft in the markets into Tuesday. A bounce up Possibly Wed back down into Thursday. Tuesday lows will be lower than Fridays highs. The SP 1820 is off the table for this week. I still fully expect the 1820 to be hit shortly down the road.
All the best every one
I am still fully short heading into Tuesday from Fridays near highs.
I will e mail Peter my trades, due to the fact that my integrity was being questioned from a rogue blog that I use to post on. I have also e mailed Peter my trades from the previous week to confirm my winning trades. Some very emotional disturbed people were trying to discredit and questioning my integrity.
I wish you all a profitable week.
You have to frequent happier places! 🙂
I changed my view on the Euro and posted a new chart. It missed the turn at the stated inflection point and now it’s clear we’re going to head up to the previous high before we turn down.
Can the SPX be in a large Flat with a C-wave failure since the low of Aug 25 (Aug 25 retest is a better bottom of the larger degree A wave than Aug 24)? Smaller A wave goes up to 1993 on 8/28. Its B wave is a flat within a flat that concludes on 9/4 around 1911. Then comes the C Failure which we still are in. According to Neely, C-Failures can spend a lot of time with price going nowhere. It then, IF it is completing the Corrective Phase, is followed by an impulse larger than the previous Impulse of same degree….. so larger than the drop from 2104 to 1867…..?
…. which would give a roughly 235 point drop from the top of C, i.e. 1988-235 = 1753
Here are my downside projections that I posted yesterday, I think it was …
DOW 14,050
SP500 1739
I haven’t looked at the finer details of your note, but the C wave we’re in now could turn at any time. I’d say looking at the futures this morning that there’s next to nothing left in this market. Futures are down in three waves so, we have a little bit of work to reach the previous C wave high. We might make the previous 4th high but that would surprise me.
To expand a bit on upside targets …
So far, the SPX has come down in 3 waves (not motive, but corrective). The first target on the upside then is ~1972,which is the 62% retrace from the low on Sept 10 to the wave 4 high. I think that less likely than a test of the wave 4 high at 1993.48.
It’s amazing how the Fed meetings seem to dispense so much Hopium and draw the market up like a magnet.
We could turn over in the meantime, but I’d have to see a motive looking wave that breaks the up-sloping trendline along the various lows of this fourth wave pattern.
Hope this makes sense and helps a little bit. The patience will pay off …
It’s more likely that we make the high the day of the FED
That’s what I was intimating, but I think it’s less likely that it’s the higher high of 2008 in the SPX, based upon this morning. We’re heading up in a fifth and final wave.
In the ES, the 3rd wave from yesterday was exactly 1.6 times the length of the first. I would expect the fifth wave to be a similar length as the third wave.
To me, everything seems to be pointing to testing the top of the larger fourth wave one last time.
Let me take that back. Looking at the SPX, I think the target of the end of C may very well be 2008 (top of previous fourth). It would make for 3 equal length waves in this final C wave. I will post a chart shortly.
Hey Dmitri.
I posted a new chart at the top of the post – SP500 with the most likely EW path … as of now.
I unwind progressively the shorts to rebuild the position higher.
But there is a strong chance to go to retest recent lows into tomorrow before the up.
Dmitri,
I posted a chart of the ES tonight with a note as to how it affects everything else. It’s an obvious triangle shaping up and we’re in the final leg up. I find triangles as well in all the major indices but not as well defined. The NQ has a similar look.
Thanks, Peter,
they may also exit from triangle by the down
Not before it completes the E wave.
It has already broken this lower border of the triangle.
Let’s see if it is fake or not.
It’s at very strong support since three days
yes, so that means it’s not a triangle anymore. What we’re doing is attempting to understand the pattern. If you know the pattern, you know what it’s going to do next. So, we can scratch triangle off the list.
Futures are set up in a second wave pattern now, as is the eur/usd—exact same pattern. eur/usd is in a countertrend move (we know that, and in a final wave, as well), so perhaps it will finish off that move as the market tops. What I get from this is that the market seems to be confirming we’re going to get a final wave up.
The support is really strong. It has been tested third time on large volumes but holds. Somebody buys strong at this level.
So, the triangle is still valid
No, it broke the triangle. It is not valid. The point is that the market moves in patterns. If you can figure out the pattern, you can predict the move. We’ve eliminated the triangle. There are only so many patterns left. From the double bottom, the ES has moved straight up in a final wave, as predicted.
It should move up in 5 waves and it should break through the upper trendline of the triangle.
The market can’t move down from here, because it’s come down in overlapping waves and that’s not motive. The large fifth wave down that we’re waiting for has to have a motive structure. So, by process of elimination, I know we’re going up to finish off this wave. That’s the process we use in EW to determine where the market is in order to know where the trade is. So ES has to get back up to 1985.
Let’s see what will happen when the cash opens
Unless you’re implying the D wave on the triangle has just moved down a notch, and yes, I see that. That is a possibility. It would mean the triangle is still in play.
I note that the triangle for NQ looks better now with the D wave now moved, so maybe it is the triangle. That means we would turn at 1955 in the ES. There aren’t many patterns left on the board …
The Europe has jumped more than 1% in few minutes.
The market is very nervous. Imagine what is waiting us next two days
Dave sent me a note that the futures yesterday were on track to set a record low average trade size. So, no volume … at all. Yes, I suspect we’re going to see some real volatility!
In average the volumes were low except that three attacks of the support.
So, you have taken out the triangle?
No, you made me think … lol. The triangle is still active, but I have misgivings about it. The NQ would have to also complete its triangle at the same time and it has much further to go. Let’s just say the triangle isn’t my first choice, but it’s still viable for the ES.
Apparently everybody is i standby mode.
Just chaotic moves up and down on no volumes.
I think no real move until tomorrow afternoon
Just small shorts at the rebonds to gain some 5-6 points
We are close to the upper side of triangle.
It’s too close. It’s not possible that we touch it today and go down.
Do you think we should make the high on Thursday with Yellen?
I don’t know. The ES and YM have both done five waves up to the top of the triangle. So this is the top or it’s the first wave of a larger 5 wave sequence.
We’ll have to see what happens.
In case if it is the first wave of another one higher degree we should retrace 62% of it?
Yes, exactly.
On a 5 minute chart, note that the 3 and 5th wave of that first wave up are exactly 1.6 times the length of the little first wave.
So it looks like we have two more waves up in a five wave sequence and that should finish this thing off. But, of course, that could take until the Fed meeting announcement.
ES didn’t quite make 62% but NQ did.
Smart Move, I am now long going into the fed meeting. Probably see Just before the actual announcement. Good Luck
Hi Peter ,
Are you still looking for SP-500 to reach around 2008 ,or this option is invalid now ?
Regards
AZ
It’s too hard to tell, actually. Dmitri and I have been discussing the ES (futures) and we’ve seen one very motive wave up. The last wave in a sequence is typically in 5 motive waves. So, measuring the SP500, if the last 5 waves are of similar length, it looks more like we’ll top at the 4th wave high. But, I can’t really say for sure that we won’t get to 2008. We don’t have to because we’re already past the 38% retracement level. So, we’ll just have to wait and see.
It depends upon the length of the third wave. If it is equal or 1.6 of the first
🙂
We still haven’t broken the upper side of triangle
SP500 has. And the DOW.
Broken now
Should be relatively easy to see the top when it comes. Just a matter of counting a couple more waves.
Eur/usd is still moving counter to the US indices. I thought maybe that had changed.
I measure the top of the 3rd in ES at 1970.
Except that the 3rd already looks like it’s got 3 waves within it. Final wave don’t always reach their full potential.
Looks like they wanted to top today?
Or the top is going to be tomorrow. I am out of shorts. 1/2 position long. LOL back to bed
And the up is again on no volume. Just short squeeze
I’ll not be surprised if they make significant top into the Europe close and retrace after
Hi Peet,
I still feel like the 2040 is possible per end of this week/beginning of next week. I said a hard move up this week, we will see. 😉
Cheers,
Wouter
Peter,
do you think we need one more wave up at least?
I mean have done the third or it’s the first of the third?
We’ve done the third wave up in SP500. We need to back off to the previous fourth (1966 or so) and then do a fifth wave up.
Actually, we may have a bit more 3rd to go.
That’s wave 3 done. In the SP500, another wave that same length, will bring up to about 2008. That’s the final wave.
Sorry, we’re in wave 5 now. These waves are so tiny, it’s hard to measure.
ES should come down to the previous 4th tonight at about 1959 and then we have a fifth up tomorrow. This looks like an extended third.
Wave 4 tonight could come down as much as 62%. Where it ends up will determine where the ultimate top is. If it falls to 62%, then we’ll likely tag the fourth wave top.
Mid-month re-balance, pre-fed squeeze job.. One last wave up into tomorrow and possibly thursday morning. I believe the final high, before heading down significantly. I had mentioned a retrace into Wed from a low tuesday. Not the low I was looking for. 1/2 position long going into possibly thursday morning depending on volume and other technical indicators. Looking for a downward thrust from thurday after fed announcement into friday.
There is only more subwave up – correct. 5 of 5. In the SP, target looks like 2008.
THe name of the game is Mercury retograde the Joker Planet wants to suck everybody in again Top Sept 16/17…
Sp 500….. 2008 or higher…
I believe you will be very close, going into late Wed thru Thursday morning. To many Bears at the moment. Need too clear some of them out before we head down.
As I look again, we appear to be in wave 5 (really small waves), so we may not make 2008. We may simply do a double top at wave 4.
No, this looks more like end of 3. We need to back off 38% a fifth wave up. We’ll need at least to do a double top.
Platy @platypusfoot 38m38 minutes ago
Possible disaster Sept 17 when Saturn enters Sagittarius 30° from the Galactic Center or Sept 18 when Moon conjuncts Saturn.
Still long, possibly 1985 spx before we head down
I watch time and see what price it will bring patience again…
I agree John, I am always reluctant to put on price levels.
Valley, congratulations on staying discipline with your trading system.
Yeah Valley,
Somehow I knew you will be right again you have got full control over your emotional part of the brain that is priceless.
Cheers.
Peter,
I can see only wave 1 of 5. And like you’ve noticed it has not retraced completely 62% after.
In the third wave I don’t see any significant retracement that cold help to determine the structure.
How do you know that we’ve finished the third?
In answer to your last question: Lots of experience in reading waves.
https://worldcyclesinstitute.com/es-wave-structure/
Looks like Peters SPX wave 5 is playing out nicely with Fed Meeting Wednesday and Thursday. Still in SPX until Thursday’s close as have hunch Fed will say something market likes. Will fade any rally after Thursday. Whazzup and his “up” prediction nice. PALS is all negative on Friday. Monday next week becomes neutral. Later next week positive. Seasonally this is bad until October so grain of salt.
Valley,
So you changend your mind no sell off on thursday and friday?
It looks toppy to me
Cheers
I’d like to see a top end of this week/beginning next week. Then it is time for some real shorts. 🙂
Cheers,
W
Looks like the top will be today.
It has done already 1, 2, 3 and 4 of the 5th
We have one more wave up 5 of 5
May be we’ve just done the first of fifth in 5 waves, then just retraced 62%. In this case we are beginning now the third. So, it should top around 2000 +- 10 points
Hi Dimitri,
3 Targets for you, choose what you think is best:
2008+-
2040+-
2070+-
I can see all three happen, but I would still like to go for the 2040+- target!
Top per end of this week/begin next week (22 Sep).
How do I get to these numbers? EW + other stuff. 😉
Cheers,
W
I posted a new chart at the top of the post for this morning’s market.
I just added the Nasdaq with a really scary wedge formation!
Peter,
where may we be in termes of waves according to your count?
SP500: In the 5th wave, which is typically 1.6 times the length of the first wave, which puts the likely turning point at about 1998, although, I suppose it could extend a bit.
You mean 10 points more from now?
But where we are in the Fifth wave?
According to my count we have one more, the last one 5 in 5 in 5.
Am I right?
Sorry, I don’t count every tick and I’m not near my trading setup at the moment.We’re close.
The wave down is either a first wave down or a final 4th wave. If a first wave down, what you want to see is a 62% retrace and a turn down.
So, it’s the 5th
Probably the top is in?
The last 5 is of the same length as the 1st of the same degree
I think so … we may wander around tomorrow morning (and tonight) and put in a double top, but I don’t know that there’s anything left up top …
Well, actually, I just measured it and 1992 looks like the number in the ES.
Just from the usual point of view it’s a little bit strange to be so close to 2.000 and not to strike it.
Don’t forget it’s expiration day on Friday
That’s what I was thinking, SPX should strike 2000. This will give your 1992 in ES
Good point. I’m already on dec futures, so my numbers could be off a point or two.
The NYSE is the only index that hasn’t topped and I would expect it has to do that. It’s about $30 away.
Sold out of my longs from yesterday morning 1982 spx Looking for a retrace to get back in possibly later today. Good luck every one.
WRONG key strokes I did not get out at 1982 spx. It was the cash sp
Still in cash, waiting to short possibly before the fed announcement tomorrow. 1985 spx as of now, which I expected from yesterdays post
All the best everyone.
Peter, you have the patience of Job…..Nick
good work!!
🙂
Peter. you have the patience of Job…Nick
Good work.!!!
I AM A CONSISTENT WINNER BECAUSE ; 1 I Objectively identify my edges.
2. I predefined the risk of every trade.
3. I completely accept the risk or I am willing to let go of the trade.
4. I act on my edges with out hesitation or reservation.
5. I pay my self as the market makes money available to me.
6. I continually monitor my susceptibility for making errors.
7. I understand the absolute necessity of these principles of consistent success and therefore, I never violate them.
Mark Douglas
If we all meditated on the above for 5 minutes a day, before the opening Bell. Our winning percentages of trades would grow exponentially.
Good luck every one.
Thanks Dave,
Or this one:
http://www.elitetrader.com/et/index.php?threads/paul-tudor-jones-trading-rules.292843/
What certainly helps is meditating just 5 minutes every hour when you are trading disconect with your screen and relax
Our brain is wired to avoid pain so fear of pain often leads to emotions and bad decisions.
Keep your brain in the Alpha state and take a walk with your dog on the wildsite (lol)
LOL,,,John you must be reading my e mails.. This is exactly what I do each day. I also take the dogs after the market closes to decompress from the stresses of the day.
Chile EQ triggered partially be Saturn entering Sagittarius as mentioned yesterday: We may see more events later on today or tomorrow. I wonder if the markets will feel this energy ? I would say so, by late this afternoon thru Friday.
I have just finished layering the shorts at my 1985 SPX level as quoted the last two days.
I will have a exit point if needed. Looking to keep into tomorrow.
Good luck every one.
New post. https://worldcyclesinstitute.com/fourth-wave-kiss/