
Market Update for Friday, February 15, 2019
Market Update for February 15, 2019  |
 |
Make sure you zoom the video to full size with frame expander (arrows) in the bottom right hand corner and also set the quality to as high as your web connection allows. This is a high definition (HD) quality video so the best viewing is at that level. |
_______________________________
Market Update for Thursday, February 14, 2019
This is the CHART SHOW
The Chart Show for February 13, 2019 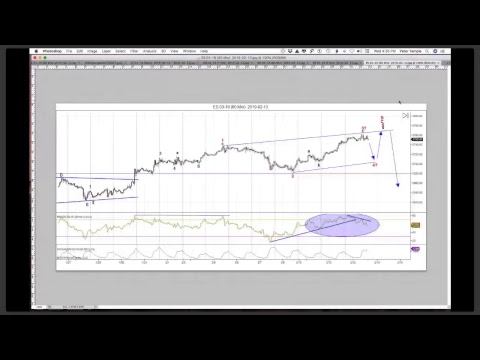 |
|
Make sure you zoom the video to full size with frame expander (arrows) in the bottom right hand corner and also set the quality to as high as your web connection allows. This is a high definition (HD) quality video so the best viewing is at that level. |
_______________________________
Market Update for Wednesday, February 13, 2019
CHART SHOW signup
Market Update for February 13, 2019 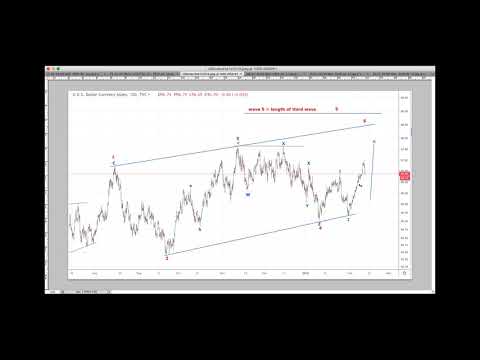 |
|
Make sure you zoom the video to full size with frame expander (arrows) in the bottom right hand corner and also set the quality to as high as your web connection allows. This is a high definition (HD) quality video so the best viewing is at that level. |
_______________________________
Market Update for Tuesday, February 12, 2019
CHART SHOW signup
Market Update for February 12, 2019 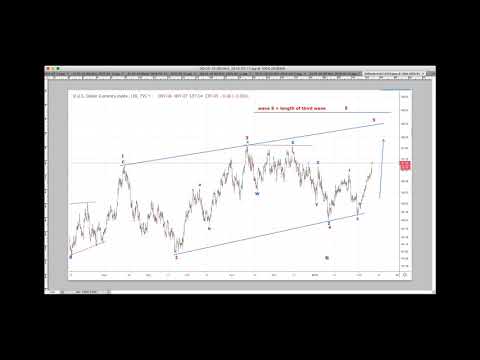 |
|
Make sure you zoom the video to full size with frame expander (arrows) in the bottom right hand corner and also set the quality to as high as your web connection allows. This is a high definition (HD) quality video so the best viewing is at that level. |
_______________________________
 Watching … Waiting
We’re very, very close to a top of this corrective wave up from the December 26th bottom. As a result, it’s critical that we’re very cautious about playing what I believe is the small final wave up.
As I often say in these situations, “the surprises will be to the downside.”
At first glance the waves down in the SP500 appear to be in five waves. I’ve spent hours going over the 1 to 5 minute charts on all the indices and I’ve come to the conclusion that we have three waves down at the moment. There’s no question this is the case in the Russell 2000, a chart of which you’ll find just below.
However, there is a wave configuration that’s an extended first wave down that starts off with the first part of the first wave as an apparent three-count. That being the case, we need to be extra careful with the current setup. There’s no question that a top is in the works.
On Friday, we completed what looks to me to be a first wave up in five waves. That forecasts a B wave down and a C wave up. While I believe we’re going to a new high, based upon my analysis of the wave structure, there’s certainly the possibility that things could change over the next twenty-four to forty-eight hours.
I’ve already shared my thoughts on timing. It seems to me slightly early for a top, by at least a few days, and maybe a week. A top on February 5 is a wave up of six weeks when the wave down from the all-time high took 12 weeks. Since the wave up has retraced 62% of the wave down, I would expect a wave up of about 7 weeks, and perhaps a couple of days longer than that. That would put the top at February 13 at the earliest.
So, here’s what we need to look for in ES:
- Fifth wave to a new high: If we’re going to a new high (which I expect), then we need to see a second wave down from the close on Friday to about 2692. Then we need a third wave up that keeps going very close to a new high (my measurements target 2737 in ES for the third wave. That should lead to a deep fourth wave and a fifth wave up to a slight new high.
- Second wave up 62% and a reversal: if somehow my count is wrong, then we’ll be looking for a B wave down (which may not reach the 62% retrace level of 2692), that will lead to a C wave up that will only reaches slightly above the 2716 level in ES before reversing and dropping to a new low.
My work this weekend tells me the former is more probable, but I want you to be alert to the option.
In this weekend’s video, I take you through a 15 minute chart of ES, where I explain what I’m seeing.
_______________________________
IWM – Russell 2000
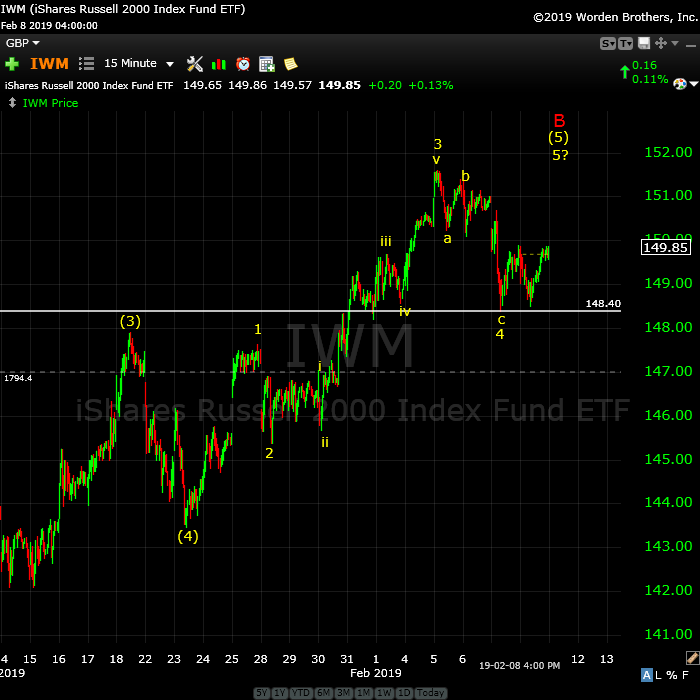
Above is the 15 minute chart of IWM (the Russell 2000).
While the most recent wave down in some US indices is questionable as to whether it’s a five-waver or a three waver, this index is unequivocally a “three.” Since all NYSE indices move up and down together, you can’t have one with a corrective wave moving up, while all the other ones move down.
You always look for confirmation across indices whenever you get questionable waves.
Therefore, I’m expecting one more wave up to a new high to complete the 5th wave of the 5th wave of the C wave in the US indices.
Elliott wave is based on probabilities, of course, and this appears to be the most probably outcome, based upon the current wave structure (and what other asset classes are doing).
Lots of Uncertainty in Currencies
USD currencies are not providing many clues at to what the next move will be. I’m unable to come up with a count that I can rely on:
USDJPY continues sideways.
EURUSD is down in three waves so far and doesn’t measure properly, so it’s either going to retrace of move down to finish the current wave.
GBPUSD has come down in three waves and needs to correct this wave with a new high, imho.
AUDUSD has the strangest set of wave down that don’t have any kind of fibonacci relationship that I can find. They appear corrective to my eyes.
USDCAD has reversed as predicted, the wave up on Friday is corrective, so it has more of the current correction to complete, but I’m unsure if this is a second wave or a fourth wave to the downside.
____________________________
Elliott Wave Basics
Here is a page dedicated to a relatively basic description of the Elliott Wave Principle. You’ll also find a link to the book by Bob Prechter and A. J. Frost.
_______________________
Trend Changes: How to Enter with Reduced Risk
First/Second Wave Combination: This is what to look for if you’re entering a trade after a trend change.
___________________________
Week at a Glance:
Use the usual amount of caution and if you’re using EW for entries, it requires entry on a second wave (a 62% retrace of the first wave). Wait for the turn. These summaries are not “official set-ups,” but rather a summary of the movement expected this week.
- ES/SPX/NQ – Setting up for an imminent turn down
- WTI Oil – Retracing a corrective wave down – direction still up
- Gold/Silver – Setting up for a turn down
Current Timing in the SP500:
- Red A wave down from the all-time high: 12 weeks (Oct. 3 – Dec. 26)
- Red B wave up 62% from ~2330 low: 7 weeks at Feb 6 (Dec. 26 – Jan 13 — 7 weeks?)
- Red C wave down to possibly 1800: 14 weeks takes us to May 22
_______________________________
Here’s the latest daily chart of ES (emini futures)
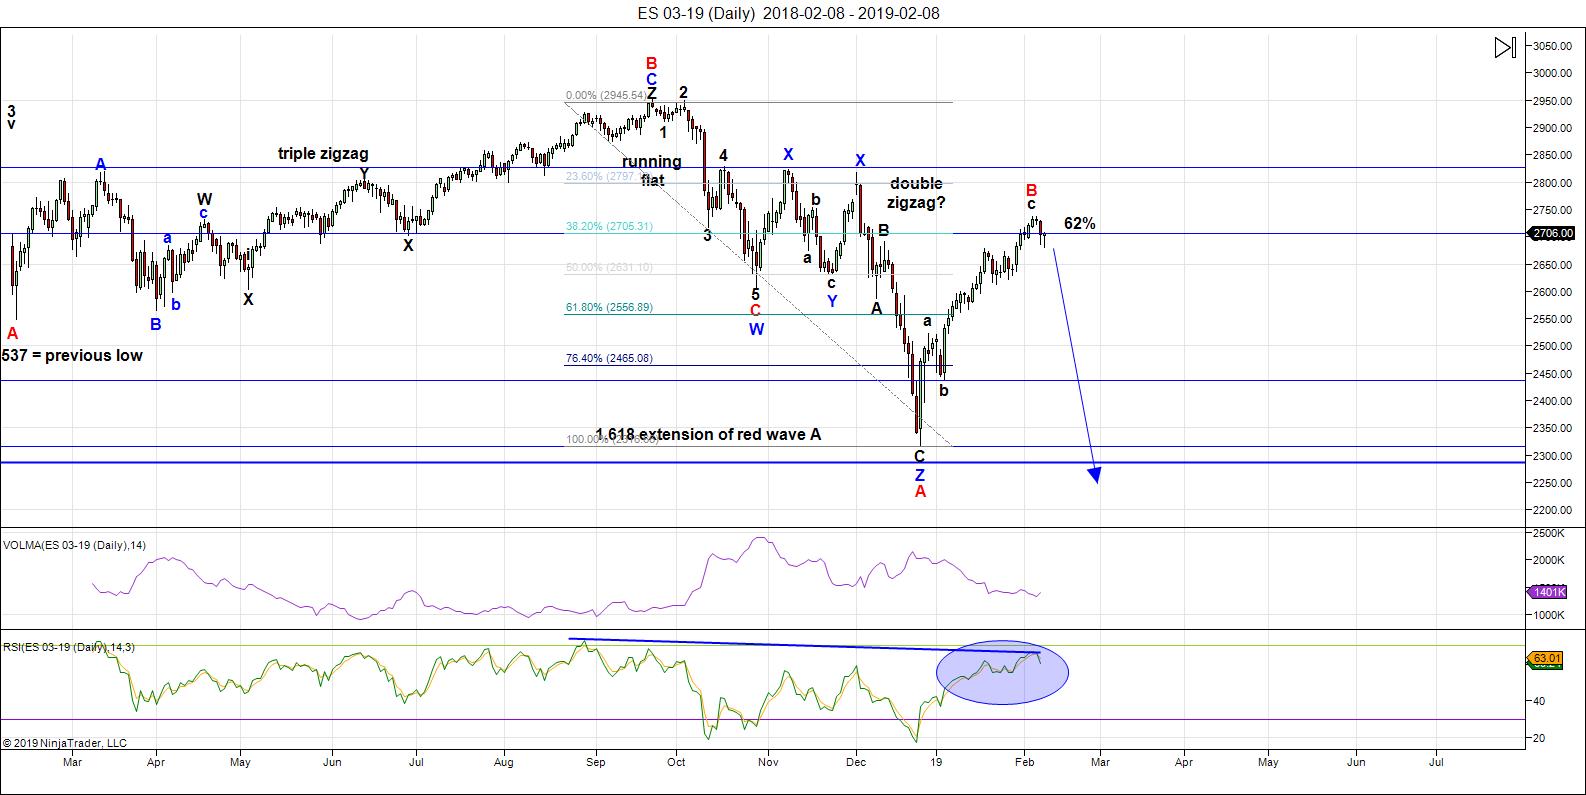
Above is the daily chart of ES (click to enlarge, as with any of my charts).
We have a B wave that’s now risen 62% of the of the height of the previous set of waves down from the all-time high.
This past week, we had a wave down in the US indices that, at first glance looks like a “five.” However, to my eyes, the additional waves within it suggest that it’s corrective. it also dropped slightly below the 38% retrace level of the previous set of waves up. First waves need to drop to the previous fourth wave of one lesser degree, which it did not do.
In IWM (the ETF for the Russell 2000), the waves down are undeniably in three waves. Since all NYSE sub-indices must have the same count and can’t move in opposite directions, the probability is high, imho, that we’ll see one last new high in ES.
There is also the question of timing. The waves down from the all-time high to the Dec. 26 low took 12 weeks exactly. The B wave up from that low, that we’re at the top of now, has a high at February 5. That’s one day shy of six weeks.
However, the B wave up has risen slightly more than 62%, so I would expect in this case, that it should take a relative amount of time to complete, closer to seven weeks, or slightly longer (by a day or two). That suggests the top will be this week.
On Thursday night, I called for a bottom in the current area and a turn up in a first wave, which we now have. The wave up looks motive and rose to slightly above 2705, which was my call. This is consistent with the start of 5 waves to a new high.
Let’s see what happens this weekend, but the probability, as far as I can see, if for a new high to complete this B wave.
There are other asset classes (currencies, oil, silver, and gold) that also suggest a new high is coming in the US indices.
Summary: My preference is for a dramatic drop in a C wave to a new low that should begin this week. The culmination of this drop should mark the bottom of large fourth wave in progress since January 29, 2018 – over a full year of Hell. It may be a dramatic drop that lasts multiple months, and will target the previous fourth wave area somewhere under 2100.
Once we’ve completed the fourth wave down, we’ll have a long climb to a final new high in a fifth wave.
_______________________
Here’s the latest 60 MIN chart of ES (emini futures):
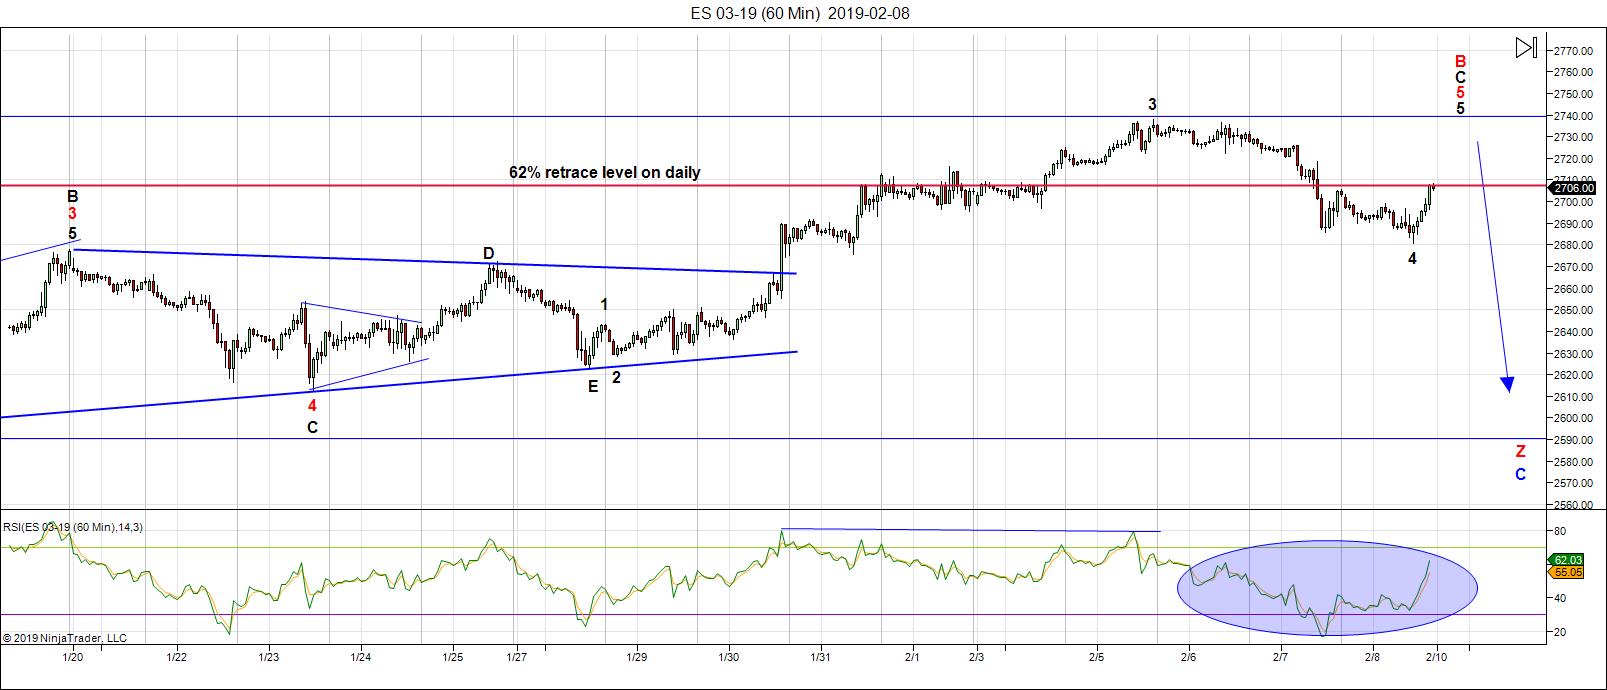
Above is the 60 minute chart of ES (click to enlarge, as with all my charts).
With the achievement of the 62% level of this large B wave, I started to think about the time factor involved in relationship to the waves down from the all-time high. It gave me a concrete fibonacci level that I could equate with the larger timeframe.
Corrective waves on this scale (particularly second waves in a bear market) retrace in relative timeframes to the waves of the larger trend.
So, for example, a B wave that retraces 62% of a preceding larger wave down of 12 weeks, should retrace to that golden mean level in approximately 7 weeks (or even a couple of days longer). That would suggest a turn mid-to-late week (Wed-Fri). That’s my working prognosis for the timing of the turn going into this week.
The waves down so far last week appear to me to be corrective, although the wave structure at first glance appears to be in five waves. I see telltale signs that it is not.
The wave down also did not retrace to an appropriate level for a complete first wave. Now, keep in mind that it’s possible that it could be the start of an extended first wave; however, the rally up on Friday rose above the 38% level of a higher degree fourth wave (you can view the structure of a typical first wave by clicking here.
I go through the structure of the current 4th/5th wave combination in this weekend’s video.
Then there’s the problem of the Russell 2000, which has come down in three waves. Oil has also come down in a corrective wave and requires a retrace to the top again. Currency pairs looks like they’re going into a countertrend move, but I’m unsure as to how far that move will go. Gold and silver also look like they’ve dropped in a corrective wave and have not topped.
In any event, we’re looking for a top in place this week. It’s prudent that we take great care if trying to trade the final wave, just in case I’m wrong in my count.
My extreme targets suggest we’re going to get a drop of 900 points. I can’t guarantee that level, but I can’t come up with a good reason why we won’t get there. So many factors seem to be pointing to that level. The wave structure on the way down will give a good indication of what to expect, though. As well, we have lots of other asset classes that will help with warning that a bottom is coming.
Virtually eveything is going to turn at the same time and I expect them to reach their targets for this move at about the same time.
The key levels for the bottom of the first wave down (there are previous fourth waves) are 2598 and 2562. Then look for a three wave retrace up to around a 62% level (remember, this is likely to be a zigzag down, so the second wave doesn’t have to make it right to the 62% level — be on the lookout for a slightly lower turn).
Summary: I’m expecting a zigzag down to finish off this never-ending (year-long) larger fourth wave. Look for the turn down this week. It will will lead to a dramatic drop well below the previous low.
USD currency pairs, oil, and possibly gold and silver should turn at the same time as ES/NQ/SP500.
This next bottom will confirm the end of the year-long Fourth Wave from Hell and start of the final fifth wave up to an all time new high.
_____________________________
Housekeeping:Site navigation: You can find all the specifics on site navigation and elements you might not be aware of by clicking here. Next Federal Reserve Annct: Meeting is Wednesday March 20, with a statement at noon EST. New Free Blog Post: The Pressure is Mounting The CHART SHOW signup is live for Wednesday. You can sign up now in the usual spot by clicking here: webinars. Problem receiving blog comment emails? Try whitelisting the address. More info. Moons, Eclipses, PlanetsFeb 19 — Full Moon Mar 20 — Full Moon April 19 — Full Moon July 2 — Total Solar Eclipse July 16 — Partial Lunar Eclipse Dec 26 — Annular Solar Eclipse |
Market Report for Monday, February 11, 2019
CHART SHOW signup
Market Report for February 11, 2019  |
|
Make sure you zoom the video to full size with frame expander (arrows) in the bottom right hand corner and also set the quality to as high as your web connection allows. This is a high definition (HD) quality video so the best viewing is at that level. |
_______________________________
Longer Term Charts
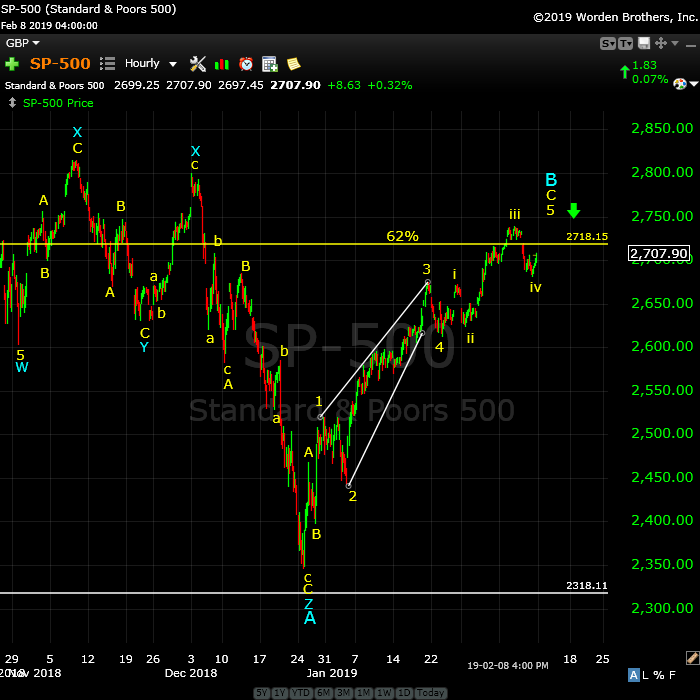
Above is the hourly of the SP500. (click any of my charts to enlarge)
The projection here is the same as for ES. After a six week “bear market rally,” we’re at a top — more specifically, the 62% retrace level of the entire wave down.
This chart shows the full 5 waves up of the C wave, which makes it much easier to see the corrective nature of this wave from an Elliott Wave perspective.
Measuring from the first A wave, we’re now at a level where the C wave up is exactly 2.618 times the length of the A wave, which is usually the maximum retrace level for a corrective wave.
Look for a turn down this week; the target on the downside will be similar to that of ES. I expect this to be a multi-month decline and to strike some real fear into the hearts of minds of anyone paying attention to the economy.
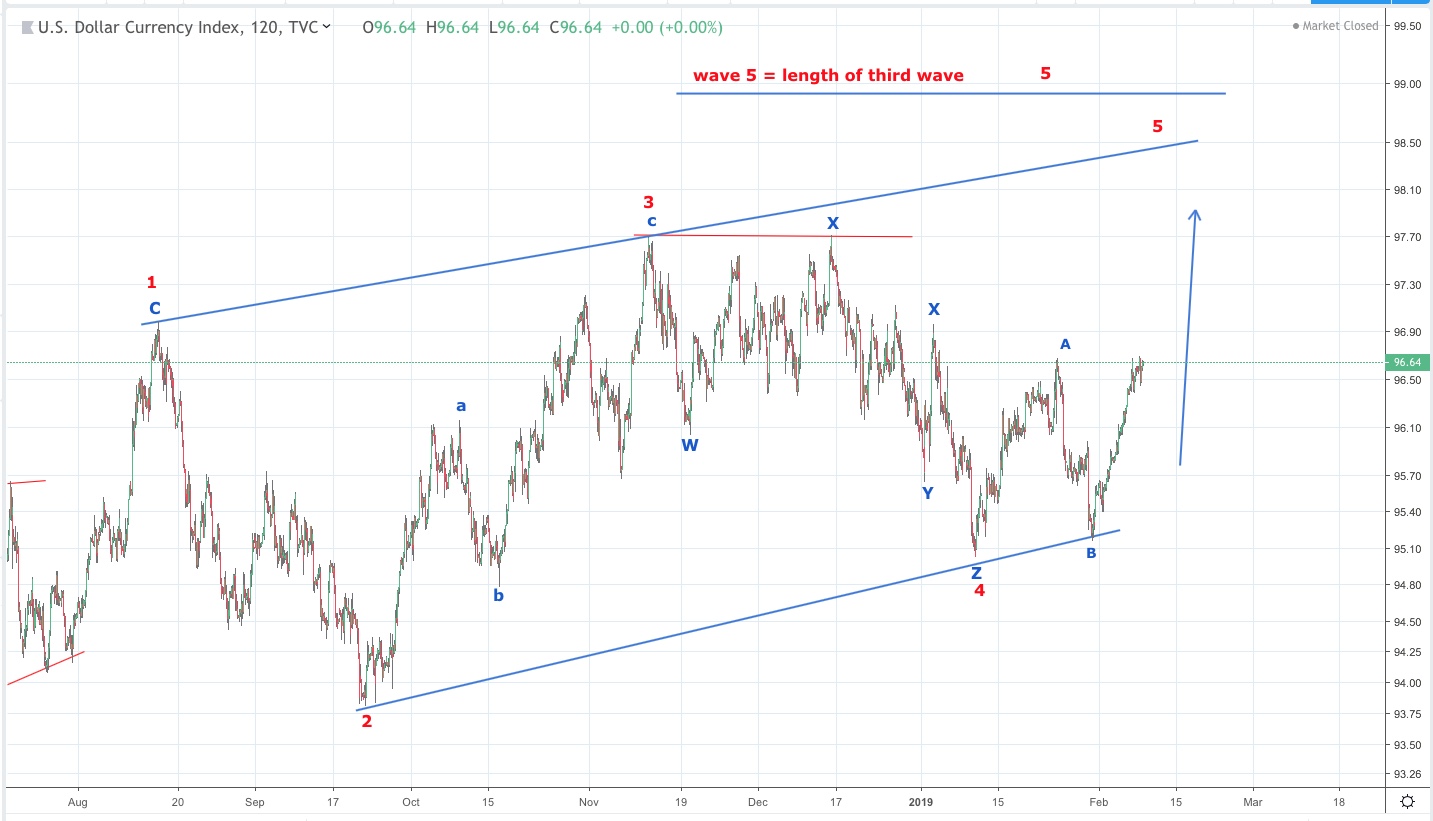
Above is the two hour chart of the US Dollar Index.
It’s important to pay attention to the dollar because it’s the thing that’s moving the entire market (all asset classes that I cover, at any rate).
It’s not clear what the next move for the dollar is on a short-term basis. I expect to see a corrective move to the downside, but I don’t know if it will be a fourth wave (38%) or a second wave (62%). All currency pairs are exhibiting a potential for a retrace.
The issue is that the current wave up does not measure as a complete wave — we seem to be in the middle of a wave up. In any case, the larger direction is up, so any three wave move to the downside would be considered a potential entry for a continuing rally.
This week, I raised the concern that the pattern we’re in does not look like a usual ending diagonal, but I don’t have an alternative pattern to suggest here. The concern is that with the US indices set up for a large drop, it seems unlikely that the US dollar will rise to only the 99 level, which would be the maximum level for the fifth wave of an ending diagonal.
In the meantime, the intermediate direction is to the upside with a minimum target of 99.
The longer term scenario that I’m expecting is a complete retrace of the dollar right back down to the 89.50 area. I expect this wave will trace out as the US indices finish up the fifth wave to a new high and end the 500 year rally.
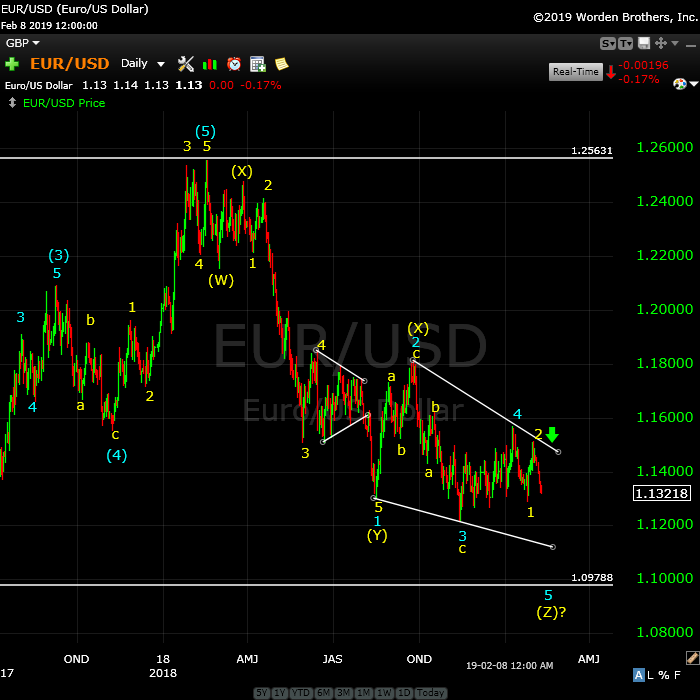
Above is the daily chart of EURUSD. Caution at the moment in this and all currency pairs.
Last weekend, I predicted a turn to the downside, which we got. The larger direction is to the downside.
In the short term, I’m looking for a retrace up, but I’m unsure as to the level to expect. There’s no set up here. I would urge caution. Best to wait until we have a clear pattern.
Any retrace in three waves would be a set up for a trade to the downside. Weakness should continue in the longer term. If this is an ending diagonal in play, expect a continuing drop to the 1.09788 area, which would be a maximum low. If we have some other pattern in play, EURUSD would likely drop even further.
Once we reach a bottom, which may be weeks away, we’re going to have a change in trend, which should lead to a new high above 1.25631.
More in the weekend video.
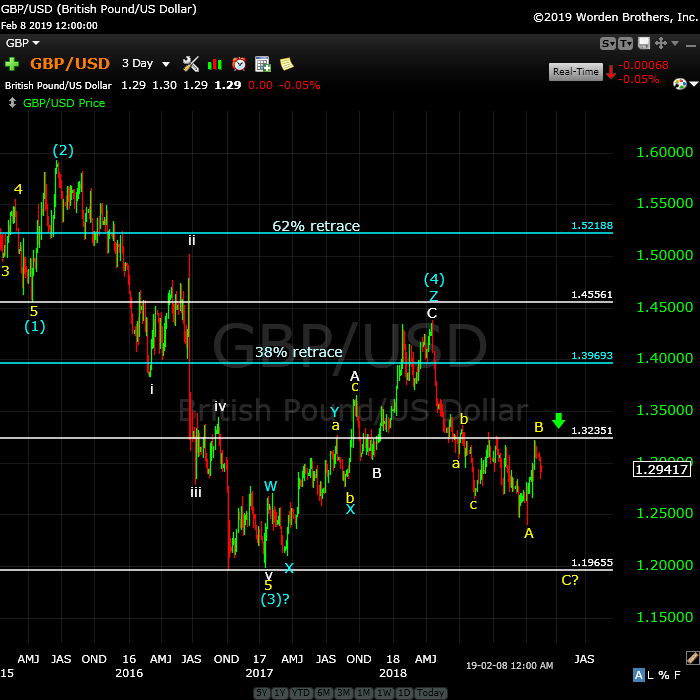 Above is the 3 day chart of GBPUSD. Caution at the moment in this and all currency pairs.
I’ve been suggesting this pair may rise higher to a double top in 1.33 area, for a B wave. The current wave we’re in to the downside is in three waves, so I’m still expecting a complete retrace to the 1.323 area. If we reach that level, look for a turn down (with the other USD currency pairs) and a target of a double bottom in the 1.10655 area, or a lower low.
After we find a bottom, expect a trend change. The bigger picture is that we have an ABC set of waves down that must fully retrace up to the 1.33 area, at least.
More information on the short term prognosis in the video.
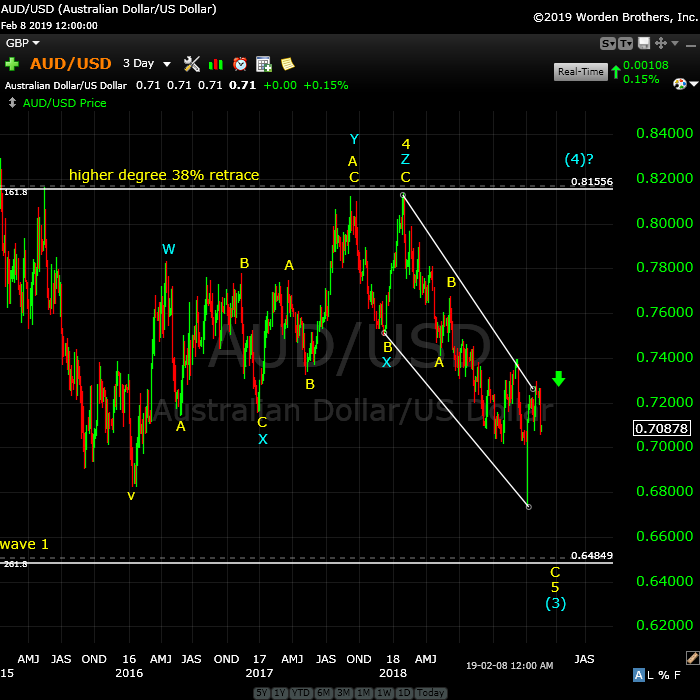
Above is the 3 day chart of the AUDUSD. Caution at the moment in this and all currency pairs.
The large pattern down in this currency pair is very confusing. I cannot get any fibonacci measurements to work; the waves themselves look corrective. I’m expecting a retrace to the upside, but it’s unclear now high this rally will go. Longer term, I’m expecting a large set of waves down to a new low. However, we need AUDUSD to provide more information as to where it’s going, both short and intermediate term. Lots of caution needed here.
After a low is in place, we’re looking for a major change in trend. The target on the upside will be the 38% retrace, which is where the previous fourth wave has topped, at 0.8155.
More in the video.
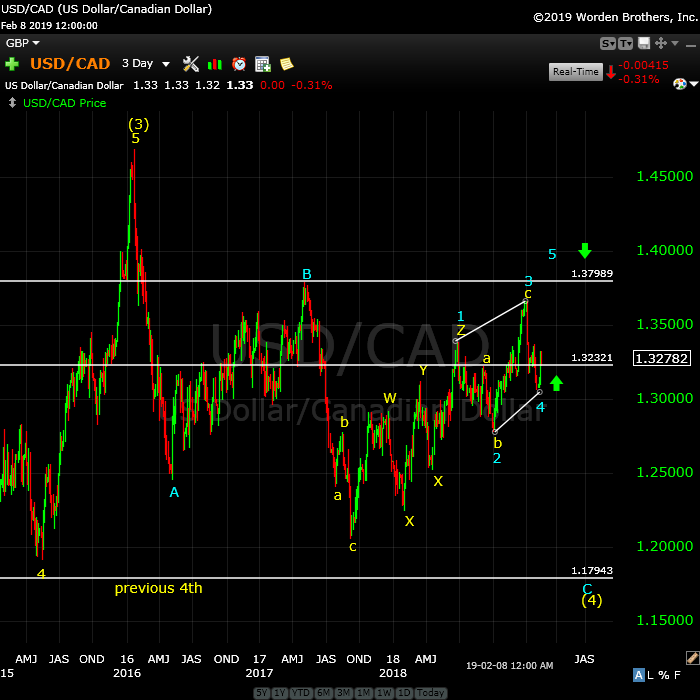
Above is the 3 day chart of USDCAD. It moves opposite in direction to AUDUSD (due to the orientation of the charts).
The last couple of days, I’ve been expecting a turn down and a partial retrace of this large rally. More downside is expected short term, but I’m unsure as to what the downside target is.
The longer term direction is up and after the US indices turn down in earnest, we should see a large rally here that will target the 1.38 area at least.
Once USDCAD has rallied to its final high, expect a drop to the long-term target of 1.18. That large wave down should coincide with the final 5th wave up in the US Indices (that will finish off the 500 year rally).
Once this pair hits the final downside target of ~1.18, it will turn up and will eventually rally to a new all time high for USDCAD well above above 1.46254.
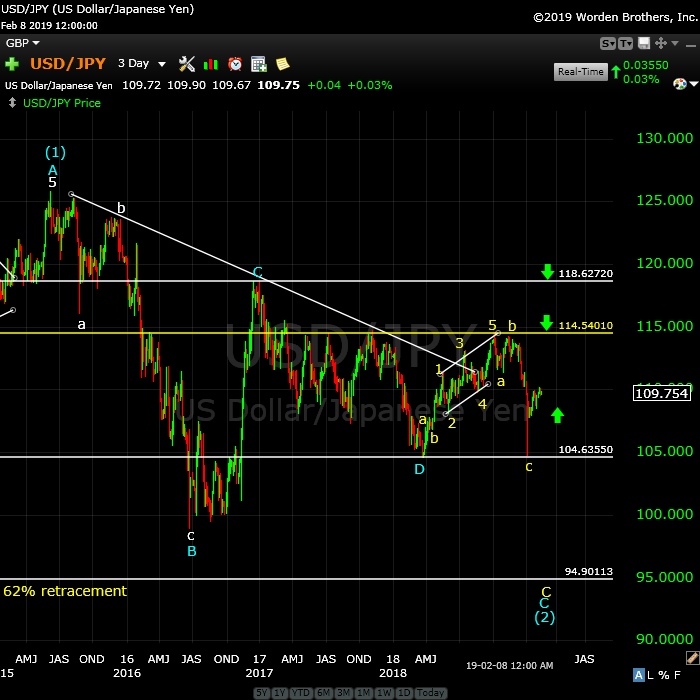
Above is the 3 day chart of USDJPY. For this pair, the longer-term prognosis is for a big drop to the 94.6 area after a top at about 118.5.
I’m expecting a full retrace up to the 118.5 area before a turn in the opposite direction and a drop to a final target of 95, or so. In the meantime, this pair has been moving sideways, not providing any indication of shorter-term direction.
I’m projecting a partial retrace of the US dollar and this should lead to some short-term weakness in this pair, but so far, we haven’t seen any. As with the other currency pairs, we need to get some clarity as to where we are in the wave structure.
Finding an entry for this pair has been difficult and I still don’t see anything I’d recommend; however, I’m extremely confident in the outcome. In fact, with the revised long term forecast for the SP500, I would expect we’re much more likely to reach a target of 118.5 before turning back down.
CAUTION: Since this is a very volatile pair at the moment, I’d recommend letting it find its way back to the top before attempting the less riskly move from a new high to the downside, which should be a protracted move to the $94 area. I expect this downside move in tandem with the final 5th wave up in the US indices. We’re not quite there yet, of course.
After we hit the long-term downside target (~94.6), I expect a turn up in an impulsive third wave far, far above 130.00.
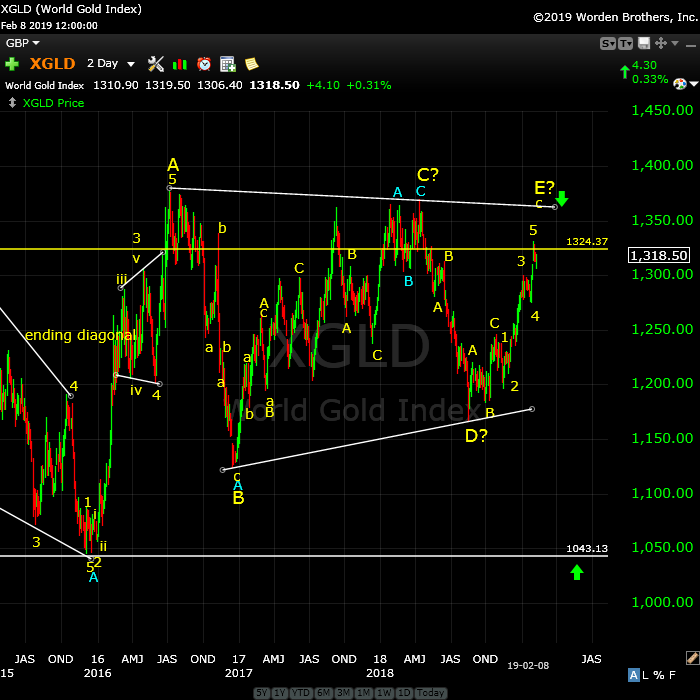
Above is the 2 day chart of gold.
Gold has rallied as expected in a small fifth wave and sit slightly above the measured target of 1325. I’m still skeptical that the triangle shown on the screen is a real one, so we’re now in the area for a turn down. It’s likely gold and silver are going to turn down with the US dollar turning up (and US indices turning down).
Short term the small waves to the downside are corrective, so it doesn’t look like we’ve topped yet. However, the top is very close. More info in this weekend’s video.
Longer term. I’m looking for a target on the downside of 1043 (the previous low).
After a bottom at around 1043, look for a wave up in gold to the 1600 area.
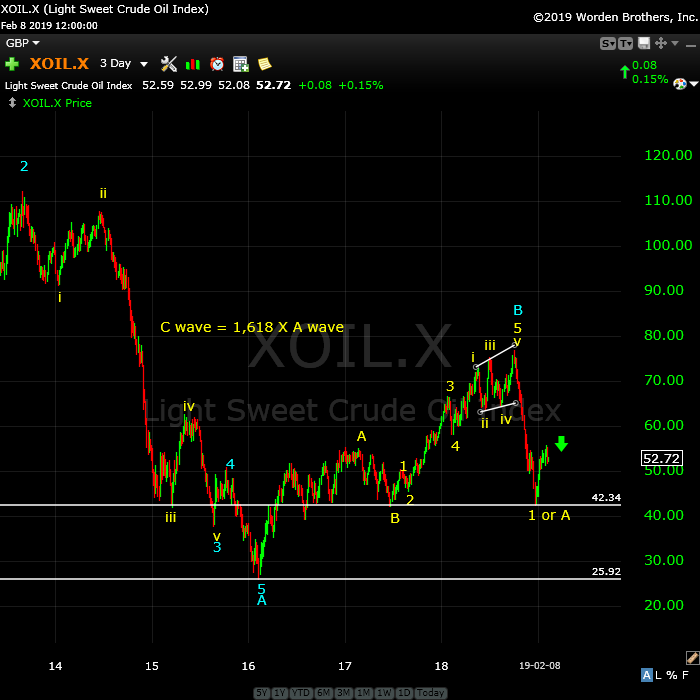
Above is the 3 day chart of WTI oil.
Oil has topped long-term. We now have (or almost have) a first wave down in place. We’re looking for a bottom, which is definitely not in place yet.
On a short-term basis, oil appears to have trace out an ending expanding diagonal at the top of a corrective wave up that that appears to be finishing a fourth wave flat.
The most recent turn down on an hourly chart exhibits overlapping waves, so the direction is still to the upside: Expect a retrace up to the upper trendline of the ending expanding diagonal in progress.
Longer term, I’m expecting a turn down to a new low below 42.50 and perhaps a lot lower.
More info on the short term projections in the video.
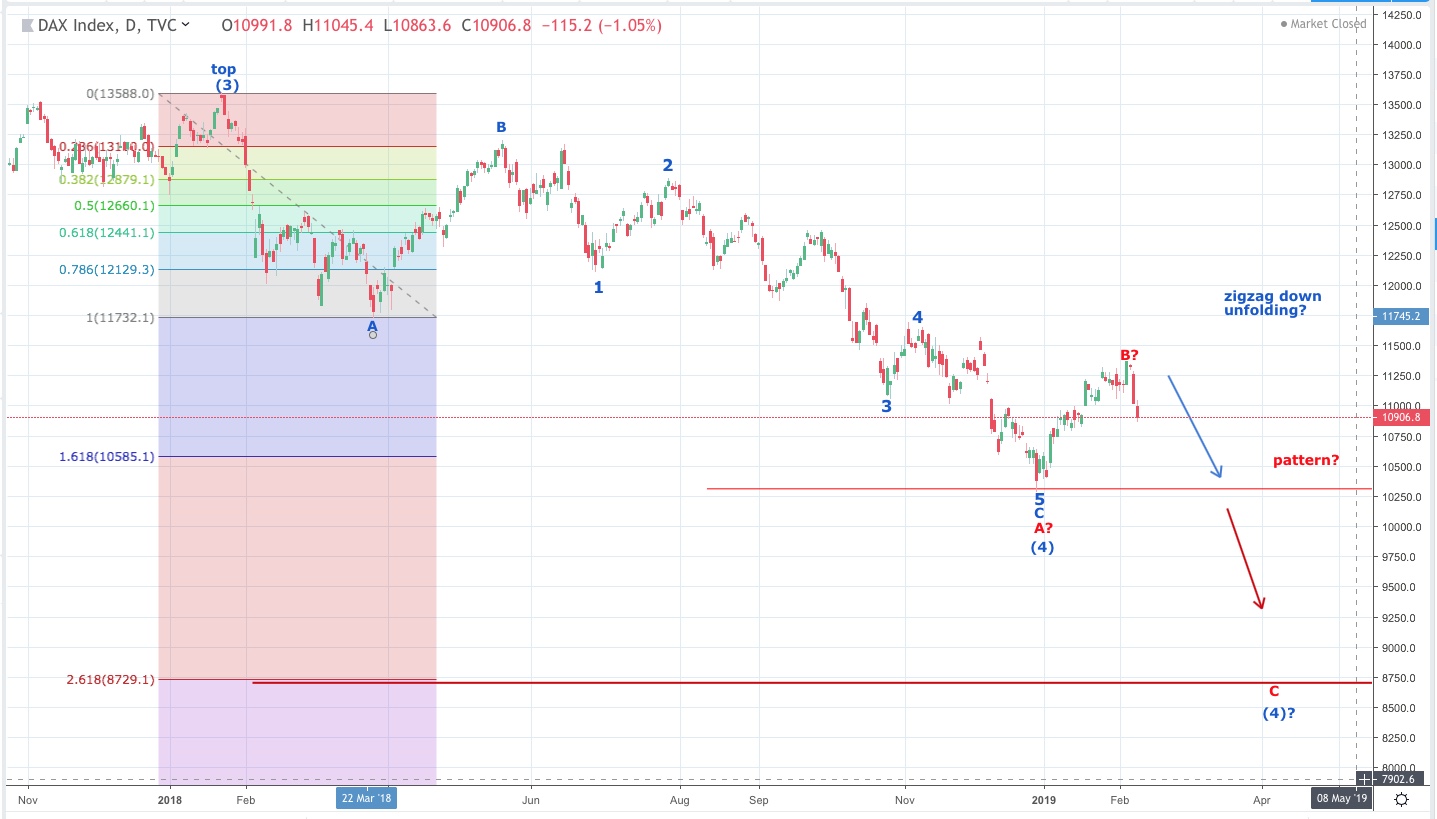
Above is the weekly chart of the DAX. (click chart to expand)
DAX bounced off the downside target of about 10,319 and did so in a corrective three waves. I’ve been calling for a turn down, which we now have.
I’m expecting further weakness, with a projected target at the previous fourth wave level, which is at about 8700, which is also the point at which the C wave would be 2.618 X the A wave down.
You’ll also find a projection for the DAX and another write-up on this weekend’s free blog post: https://worldcyclesinstitute.com/the-pressure-is-mounting/
Longer term, once we have a confirmed bottom in place, expect a rally to a new high in 5 impulsive waves.
Good trading!


Thank you for your diagnosis. Two questions……
1.) in the snp, was the drop in the 4th of the 5th deep enough? Looks very shallow and shouldn’t it have at least a 38% retrace off that large 3rd wave move up on the dec lows?
2.) is your snp 5th wave target still 2740 or is it slightly higher now?
Thank you,
Matty
Also In your labeled snp chart the first wave (174 points up) is longer than the 3rd wave (155 points up), is that ok from Elliot wave perspective? I thought 3rd wave is always the longest?
There are no rules in an ABC corrective wave. The rule in impulsive waves is that the third wave can’t be the shortest, otherwise the wave is corrective.
Makes sense! Thank you sir.
Matt,
yes on the first, dunno on the second.
I guess, in ES option 2 started to play out.
Yes, I think that’s exactly what’s happening. I was just about to comment.
CAUTION: Tonight, we have ES at the 62% retrace level after three waves up. It looks to me as through the alternate option is playing out.
I’d wait until the open to do anything. If we’re still sitting at the 2720 area near the open, then it will be a second wave we’re looking at and it will be time to consider getting short. There’s also the option of waiting for a larger first wave down. I’ll explore options in the morning.
WTI Oil: I would be cautious with oil. The alternative is that it could be in a third wave down, which would allow for the overlapping waves. The waves up so far overnight are corrective. If we drop to a new low below the lower trendline, oil will continue down. The trendline is at to the current low (around 51.85.
Gold and silver. Since the waves down really do look corrective, I’m on the fence here. It seems we should get one more top. I don’t at the moment see a pattern that suggests a top is in.
ES and NQ have now put in double tops (we may get another test after the open as cash rises to the same level. But other than that, I’d be looking for a turn down after the open.
There will most likely be another larger second wave after a larger wave down.
Oll has rallied slightly and it now back down to the lower trendline. I would expect it to drop below and keep going. Again, we might see a small little rally at the open.
Currency pairs are difficult, as they appear to be in the middle of a move, so I would be inclined to wait until we see a full first wave and second wave.
Gold and silver aren’t providing any clues as to what they’re doing. The current waves to the downside look corrective, so it looks more like it needs another high.
SP500 has a gap just above the current high this morning, and I don’t know if it will get filled. It may.
Futures are obviously not going to go easily. The wave down counts as a three. 2708 is a fib level that may serve as support. Be careful, as we may get a rise to this morning’s high still.
Good morning Peter. After this drop in crude oil, are you still looking for the prices to head toward the upper trend line ~ 56.00 or just continue lower from here???
The direction looks like it’s down because we dropped below the lower trendline, but I don’t have much more to go on. I expect a C wave up this B wave down on a 5 minute chart. I note that the most recent wave down from 52.60 looks like 5-waver, so this rally may only partially retrace this wave.
This is one ugly market, as wave structures are not very clear … all over the place.
Kyle,
I now don’t know what oil is doing. We dropped a bit lower and now the large wave down from 55.21 is exactly 1.618 X the first wave (or A wave) down. So, we either have an ABC structure or a first, second third wave (the fib measurements would be the same, but as you know, the first wave down was impossible to decipher). What concerns me is that the C wave is overlapping all the way down. We did drop below the trendline, but otherwise, this market needs to tell me where it’s going.
The entire market, including everything I cover, is more or less a big puzzle at the moment. I know we’re bouncing (or should bounce), but I don’t know how far). It just keeps getting weirder and weirder.
This is first wave up in ES that actually looks like it has legs and could reach the previous high.
We’re ultimately looking for 5 waves up in ES. This wave up looks like a good first wave (of 5 subwaves). Now we need a second wave. This may take a good portion of the day, but eventually, I’d expect a top.
Neither NQ nor ES actually completed a double top. They both fell slightly short according to my charts.
EURUSD dropped to a new low as I suggested it might and now sits at a point where the third wave is exactly 2.618 X the first wave, which is the first fib relationship that makes sense.
In that case, a third wave would be likely in place and we’d need a fourth wave to the upside that should retrace 38% to 1.1366. This may be the reason we have futures in such a difficult situation, as they’ve been moving more or less together.
Not sure, but that’s what I’m seeing.
With the progress to the upside so far (which is very little), I’d be surprised to see a top in place today.
The SP500 only has an A wave up, so it needs at least to test 2718 and will likely go at least to 2721.50, which was this morning’s ES high. The gap target in s&p is 2724, if we’re going to fill it.
I’m seeing attempts to bounce in currencies, gold, oil, and, as I’ve explained, I would expect a bit more time before a turn.
I don’t see anything I would want to go anywhere near at the moment. Perhaps we’ll get some light on the short term by the end of the day.
I also can’t rule out a new high for the US indices. The Russell 2000, which I highlighted on the weekend, is certainly headed in that direction. This morning could have been a bear trap, with a new high in the works over the coming days.
That’s what my analysis on the weekend was suggesting was going to happen.
The small wave up in oil on a 5 minute chart looks like it’s tracing out 5 waves, which would suggest there’s another wave to the upside to follow after a B wave (or second wave).
Thanks! Being patient and looking for the possibility of a double top, or a slight new high above that upper trend line around the 56.00 area ??? I’ll wait for a couple days and see what crude oil looks like into Wed/Thurs.
The waves down look corrective. The ending expanding diagonal pattern may just be widening out (a trick of triangles, but I’ve never seen one of these patterns do that — they’re very rare, so that’s probably the reason.
I get the sense that eminis are going to a new high even though there’s no second wave (although we could still get one, because we haven’t gone anywhere today). If this is a first wave up in oil, it would also need a second wave, so maybe that’s the game (they’re going to get back into sync). That’s what makes the most sense given the wave structures of the past hour or so.
The market was created for the sole purpose of driving me crazy … lol.
The Market Update for Tuesday is live at the top of the post.
Everything is more or less on track this morning.
The dilemma with ES and NQ is the poorly formed waves in this rally. It looks to me as though we’re in the fifth wave and could top today, but looking around at other asset classes (currencies, oil, gold), I’d put my money on tomorrow.
Wednesday is also exactly 7 weeks from the Dec 26 start of this corrective rally.
Oil is up, expect more upside. Gold and silver the same.
Currencies are all rallying and have more to go (mostly fourth waves, by the looks of it). The opportunity here (as I’ve been saying) is the tops of these rallies and I’ll try to provide numbers tonight. (CAD to the downside, JPY may now correct another small 5-waver to the upside).
It looks to me still that the whole works are going to turn at the same time.
So, we’ll watch for a turn today and tomorrow.
Bradley in the mirror(inverted) made a Low on the 8th. On the 12th (now) we have a High and the next Low is on the 22-23th. My old indicator made a Low on the 8-9th. On the 12-13th we have a High and the next Low is on the 20th.
http://www.prognoseus500.nl/
So I can confirm that we are on a HIGH period today. And a decline can start into the 20-22th. After 22th it looks up. So how deep can we go in 10 days?
Use this only as confirmation
Nice call in oil Peter . . . . . (and Willem)
Oil also has an oddly-shaped wave up; there’s no second wave. It can easily count as a corrective wave and it’s up against the 62% retrace level this morning, so watch it carefully. 62% is at 54.10 or so.
I’ve added a chart of ES at the top of the post. We’re closing in on a top, so we’ll keep eyes open today.
USDCAD is the best potential currency pair, imho. Watch for a test of 1.3232 for a turn to the upside. It may go lower, but this area would potentially complete a fourth wave. The larger direction is up.
ES and NQ are very close to previous highs. It’s looking more like today for the turn …
Actually, NQ is lagging substantially, with another 45 points or so to go to tag the previous high, so that suggests we’ll need more time to get everyone to a position where they can all turn as one.
The Russell 2000 is now testing the previous high.
In the SP500, this wave looks like it might be the top of a third wave. In that case, we may get a deep fourth still and a fifth to a new high. Wave structures are making the count questionable.
Looks like a good move that I went long at open. Thank you Peter. Think S&P can get above 2800 now?
There’s also the possibility (with this wave structure) that we could be working on and ending diagonal. I would not be “picking tops.”
So 2800 in snp is slightly possible? I think above that we are going to a new high as that would exceed 76% retrace, correct?
That’s not what I’m seeing.
Oh! ES is up near 2756 meaning 2800 isn’t too far away, only 40 something points.
The wave up in ES really looks like a third wave of an ending diagonal. I would have to call it corrective and measurements make no sense. If so, expect a fourth wave down overnight and then a fifth and final wave to a slight new high tomorrow.
I don’t know this for sure, but I can’t think of anything else that fits the structure I’m seeing.
NQ close to the previous high, with only about 10 points to go.
Peter, any update on oil?
Not since I replied to a comment by Kyle earlier. No more info. I think it depends in what eminis do.
I can tell you that the waves to the downside on a 5 minute chart look corrective, so expect at least another test of the intraday high.
I replace the chart of ES at the top of the post for one showing the potential ending diagonal I’m seeing.
ES: If you want to play this 4th wave to the downside, I don’t really have a good entry point other than perhaps under 2739. The upside now is extremely limited, imho.
The target would be somewhere around 2700, or a bit lower.
The Market Update for Wednesday is live a the top of the post.
NQ has just done what I thought might happen … rallied quickly to a new high. So, now both are set up in potential ending diagonals. We need to get them confirmed by to drop in a fourth wave.
The ‘both’ refers to ES and NQ.
It was a fairly active night.
NQ did indeed rise to a slight new high, which also sent ES up to a new high. Both completed what look like small ending diagonals at to tops of these waves. So I expect a down day today after we top this morning (the small waves down are corrective).
There’s the possibility of the larger ending diagonal playing out, as well, as per last night’s video. As a result, there are two scenarios. We could be forming a final top here, with waves down to a new low, or we could be forming the top of a third wave of an ending diagonal with a fourth wave down and another fifth wave up to come (it would rise to a slightly new high).
EUR, AUD, and CAD have all formed incomplete corrective waves and are sitting near their targets, except for one more C wave needed. If they complete these waves at the open, that would suggest ES is forming a final top. If they don’t it would probably suggest the other alternative of the ending diagonal.
Oil sits at the 62% retrace level still and I’m unsure if it will rally higher. Gold and silver haven’t moved.
If the waves down in ES and NQ appear corrective today, then it’s likely we’ll trace out the larger ending diagonal. If we get more motive-looking waves (in 5 waves), then the likelihood is we’ve topped.
It also is Wednesday (7 weeks exactly since the Dec. 26 turn), so there are lots of moving parts this morning to be aware of.
The best currency pair for a trade is still USDCAD, as it looks like the target here is the 62% retrace level now at 1.31644. That means it will be heading into a large third wave up after a turn.
EURUSD: target is 1.136 (38% retrace level) larger direction down
AUDUSD: target is .715 (38% retrace level) larger direction down
I just placed a chart of ES at the top of the post, showing the potential ending diagonal setup.
ES and NQ have corrective waves down. It looks like there’s a small fifth wave left to go to a new high. Currency pairs are moving. Gold has a rally going on.
Oil also starting to rally. The potential larger ending diagonal is still in play. Nothing has changed really since the open, other than a new high in futures. I don’t see a top in place.
The market has an overall look of multiple assets moving towards a top … but still some work to do, if a top here is the plan.
It looks to me like we’re getting a failure of the final wave up. Ending diagonals have no rules inside the trendlines, so it’s certainly possible. The patterns within them should be zigzags, so if we get 5 waves down here, and a B wave, then I’d expect a C wave down to complete a fourth wave.
In other words, you’d expect a 5-3-5 pattern (ABC) down to around 2700-2710.
Measuring what might happen in this fourth wave down in ES, I would imagine the A wave might drop to about 2740, then a B wave up and finally a C wave down to the target – speculative, at best.
It would take me some time (if I even could) to come up with a weirder situation that the mismatch between ES and NQ today. ES has been trying to go up, while NQ has been trying to head down.
Finally, it seems they’re getting back together. Very strange indeed.
The Market Update for Thursday (the Chart Show) is live at the top of the post.
Hello Peter. Nice chart show this evening . . . . very informative. Alright, this may seem like a strange question, since over the years I’ve seldom asked others’ opinions on the markets (most have little clue as to what’s actually going on in the markets ~ as you well know). I realize you’re expecting a sizable drop coming in most markets beginning in the next couple days*; And with that in mind, do you have a preferred market or more confidence in selling one over the other??? I pretty much concentrate on crude oil, gold, and the Dow/Nasdaq.
Hi Kyle,
I think ES will do slightly better than NQ in terms of return because I think it has a longer distance to go, but I haven’t done the math. I’ll take a look tomorrow. I think that will be the best performer. We need another high before we get the drop so I think it’s most likely to start about mid next week.
I like USDCAD the most in currencies, because the current count will lead to a large third wave up (or C wave in this case, more probably). And there’s gold, that will perform well.
I’m confident about all of them I mentioned above. Not GBP or EUR right now and if I could figure out a clean entry to USDJPY, that would be high on my list. If we get five down in AUD and a second wave, then that would also be a good candidate. The problem with currencies is that we appear to still be in first waves for some of them.
Oil will do well, but I don’t expect it to travel as far as emini futures.
When we get closer to a top, I’ll post targets again for all of these.
I should have started that last comment with the fact that like all your subscribers, I/we certainly value your opinion 🙂
Peter,
The markets just keep going higher and higher, very very bullish. ES is now only about 30 points from the 76% retrace. Would you still conclude if it goes above that level, ES will then go to a new all time high?
One asset (ES) went up about a point overnight. I wouldn’t call that very, very bullish. I have NEVER said this corrective B wave is going to a new high — just the opposite, fact.
Overnight, ES went to a very slight new high. The waves down ended up being a corrective mess, so they’ve now been corrected. NQ didn’t follow.
Everything else flat. EURUSD now has five waves down in the current wave, with a bit more downside to go, I suspect, then a large retrace up 62%. That’s somewhat the trajectory for ES … down then up to finish this large B wave.
My indicators give a start of the decline on 12/13th and a low on the 19th and by opening of the EU markets a (very) huge up and als direct a decline into Thursday and perhaps further.
Willem,
That certainly fits my scenario … tks.
A really big drop in retail sales in the US. https://www.zerohedge.com/news/2019-02-14/us-retail-sales-collapse-december
Have you a downside target for this current ES action. So appreciate what you do.
Hi Blue,
I’m expecting ES to hit at least 2710, if this remains an ending diagonal. It might get as low as 2700. Then I expect a wave up to a new and final high slightly above the current high.
If we drop to a new low below 2680, we’ve very likely topped, but the waves down don’t support that outcome, so far. It’s looking like a zigzag forming, which is what I expect.
So, pretty consistent with the chart show, etc. Great stuff! Thank you.
So far, so good.
After today’s big drop in spx just need one more high? Looking like we’re close! PTL!
The Market Update for Friday is live at the top of the post.