
Update: Friday, June 15, 2pm EST
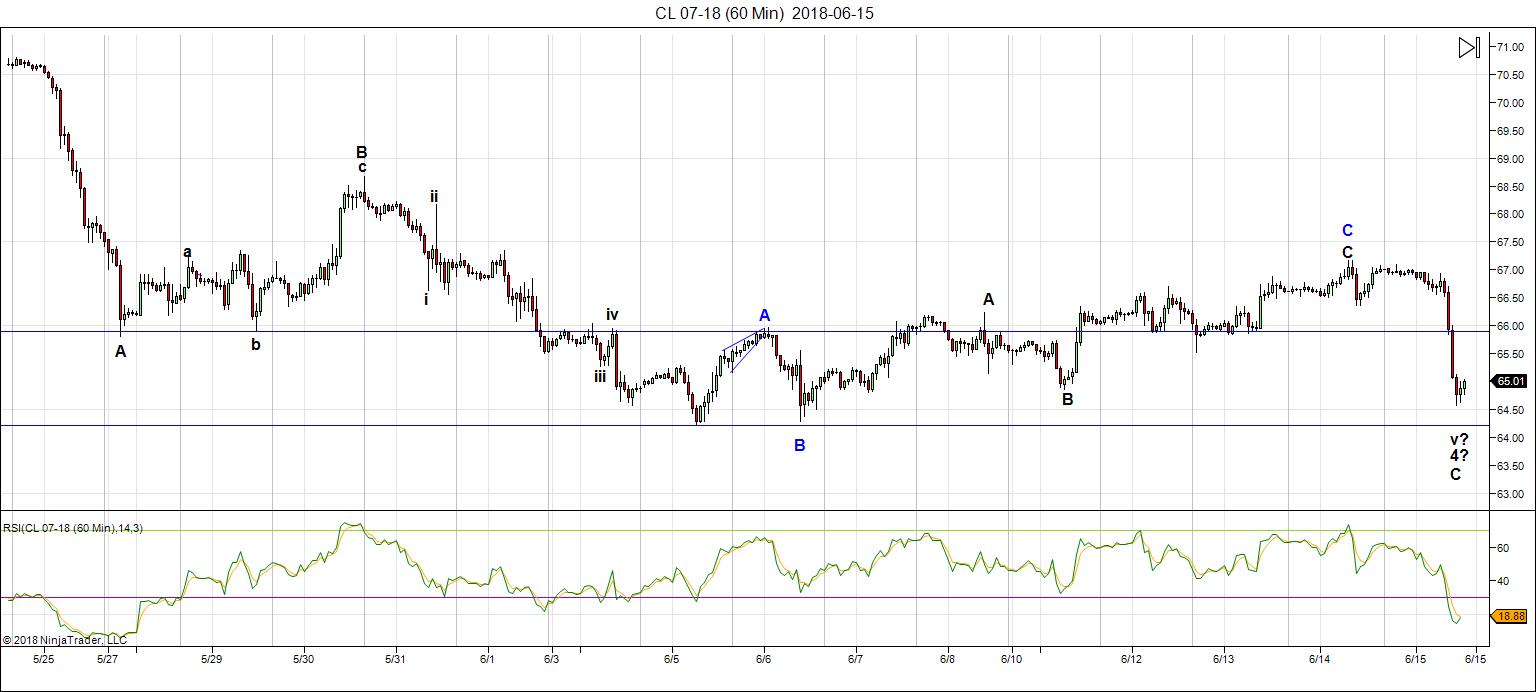
Above is the hourly chart of WTI crude oil. If you caught the small leg down, there’s more to come! We’re just about to double bottom. I don’t know if that will be Monday or today, but it’s imminent. The target to the upside is the mid to high 70s, which will be the top for oil. This the fourth wave of an ending diagonal, which set the max. level the fifth wave can’t exceed, which at the moment is $79.00.
____________________________
Market Report for Friday, June 15, 2018
Market Update for June 15, 2018  |
 |
Make sure you zoom the video to full size with frame expander (arrows) in the bottom right hand corner and also set the quality to as high as your web connection allows. This is an HD quality video so the best viewing is at that level. |
_______________________________
Update: June 14, 2pm EST
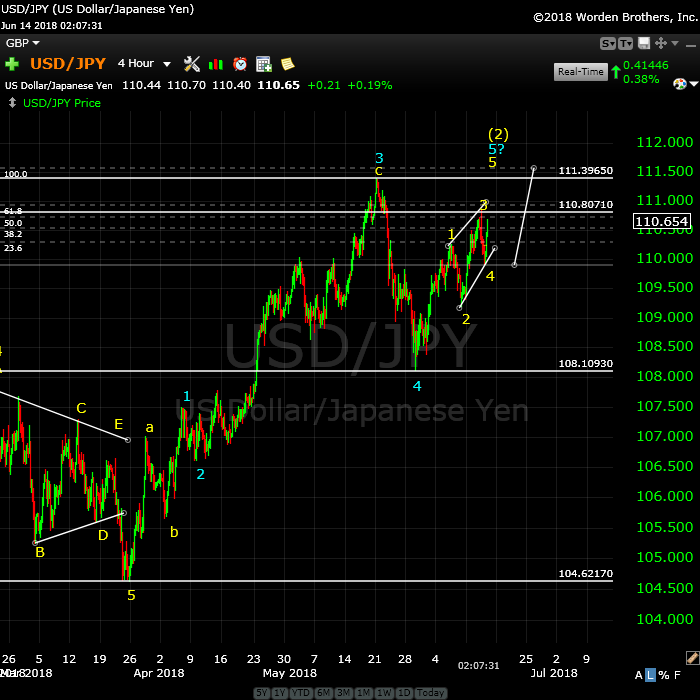
Well, this waiting is certainly tedious. There seem to be ending diagonals all over the place. Here’s one more. Above is the 4 hour chart of USDJPY showing the partially formed ending diagonal, now likely in the final wave. The projected top would be the previous high at about 111.40.
The final wave will need to be in three waves, so we’ll need a down wave before the final wave up to the high, which will likely correspond to our turn in ES and the other indices and stocks I identified in the Chart Show.
Ending diagonals result in dramatic turns to the downside, which would also support my feeling that the fourth wave in the ending diagonals in the US indices is going to come down hard.
A little more patience. Hopefully tomorrow morning.
_________________________
Update: June 14, 11:30am EST
Updated: Above is the 30 min chart of ES this morning. It looks like we have an extremely rare expanded diagonal, with a final 5th wave tracing out. They generally don’t overshoot the upper trendline and the 1.618 extension off the ‘a’ wave up now shows a target of about 2807.
_______________________________
Market Report for Thursday, June 14, 2018
This is the Chart Show (approx. 1 hour, 25 mins)
Chart Show for June 13, 2018  |
|
Make sure you zoom the video to full size with frame expander (arrows) in the bottom right hand corner and also set the quality to as high as your web connection allows. This is an HD quality video so the best viewing is at that level. |
_______________________________
Market Report for Wednesday, June 13, 2018
CHART SHOW signup
Market Update for June 13, 2018  |
|
Make sure you zoom the video to full size with frame expander (arrows) in the bottom right hand corner and also set the quality to as high as your web connection allows. This is an HD quality video so the best viewing is at that level. |
_______________________________
Market Report for Tuesday, June 12, 2018
CHART SHOW signup
Market Update for Jule 12, 2018  |
|
Make sure you zoom the video to full size with frame expander (arrows) in the bottom right hand corner and also set the quality to as high as your web connection allows. This is an HD quality video so the best viewing is at that level. |
_______________________________
 Monday Should Be “Good-bye to Wave D!” — FINALLY
For over three weeks, we’ve watched the D wave of the contracting triangle in ES and SPX try to top. Monday looks like it will be the turn down — there are a number of signals that support this. Good riddance to this wave!
I think the drop is likely to be sharp — the Nasdaq in particular needs a large fourth wave down in an ending diagonal. These waves are usually sharp and fast. However, the E wave has to be in three waves, so we’ll trace out an ABC wave to below 2600.
While the US indices head down from the top of the D wave, I don’t expect a lot of movement in the USD currency pairs. USDJPY is the exception, as the movement of JPY itself means this pair moves differently from the other USD pairs I cover. There’s more information on this is this weekend’s video.
What I see is everything moving around to get into position for the final wave up — the 5th wave in the US indices that will rally from the bottom of the E leg of the triangle up to a new high. It has quite a distance to go.
While that final 5th wave in the US indices rallies, we should see rallies in EUR, GBP, AUD, and CAD (CAD will move in the opposite direction). Oil will likely also rally in what looks like an ending diagonal pattern playing out. Gold and silver should drop to their targets while the 5th wave plays out.
I take a look a the possible timing in the free blog this weekend. Perhaps worth a read.
As I’ve been saying for the past couple of years, everything will top at the same time, but to do so, they all have to finish their final waves within Elliott wave rules.
After they all top, they will all move down together in what’s going to be the show of a lifetime. The drop in the eventual third wave (likely this fall) will be labelled “the crash” and it’s likely to be breathtaking in it severity.
Facebook: Update on June 1
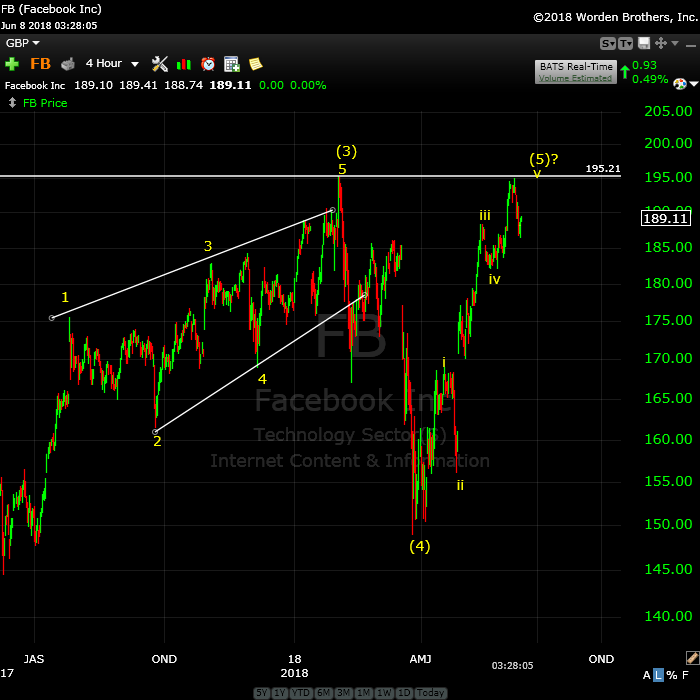
Above is the 4 hour chart of FB (Facebook).
Last weekend, I flagged this double top and something to watch. We’ve now dropped down slightly, but the waves down appear to be in 3 waves, so I’m expecting a retrace to a new high.
As well, wave yellow (5) did not quite reach the previous high, missing by one a few cents, but this is enough to declare that a top is NOT yet in place.
In terms of trading it, I would be looking for a small wave down to the previous small fourth wave at about 182. I want to see a 5 wave pattern down to that level, and then a 3 wave retrace to around the 62% level, which would be roughly at 190 and change.
I’ll continue to watch this stock as a bellwether for the larger market.
Elliott Wave Basics
Elliott Wave Theory has two primary components:
- fibonacci wave relationships that give clues as to wave lengths (and probable measured targets)
- wave counts in impulsive waves and corrective patterns (each corrective pattern has its own rules and guidelines)
Trend waves, or impulsive waves (which we haven’t really had since 2007), consist of a five wave pattern that measures accurately to prescribed wavelengths. We’ll get a set of impulsive waves in the A wave down after the top of the market.
Corrective waves are typically in patterns. You’ll see a list of corrective patterns in the sidebar in the Trader’s Gold area. They’re there so you can become familiar with the rules and guidelines for the pattern we’re in.
___________________________
Week at a Glance:
- ES/SPX – After a double top, look for the start of wave E down
- USD Currency pairs – most turning down, USDCAD in a bullish triangle
- USDJPY will continue down
______________________________
Here’s the latest daily chart of ES (emini futures)
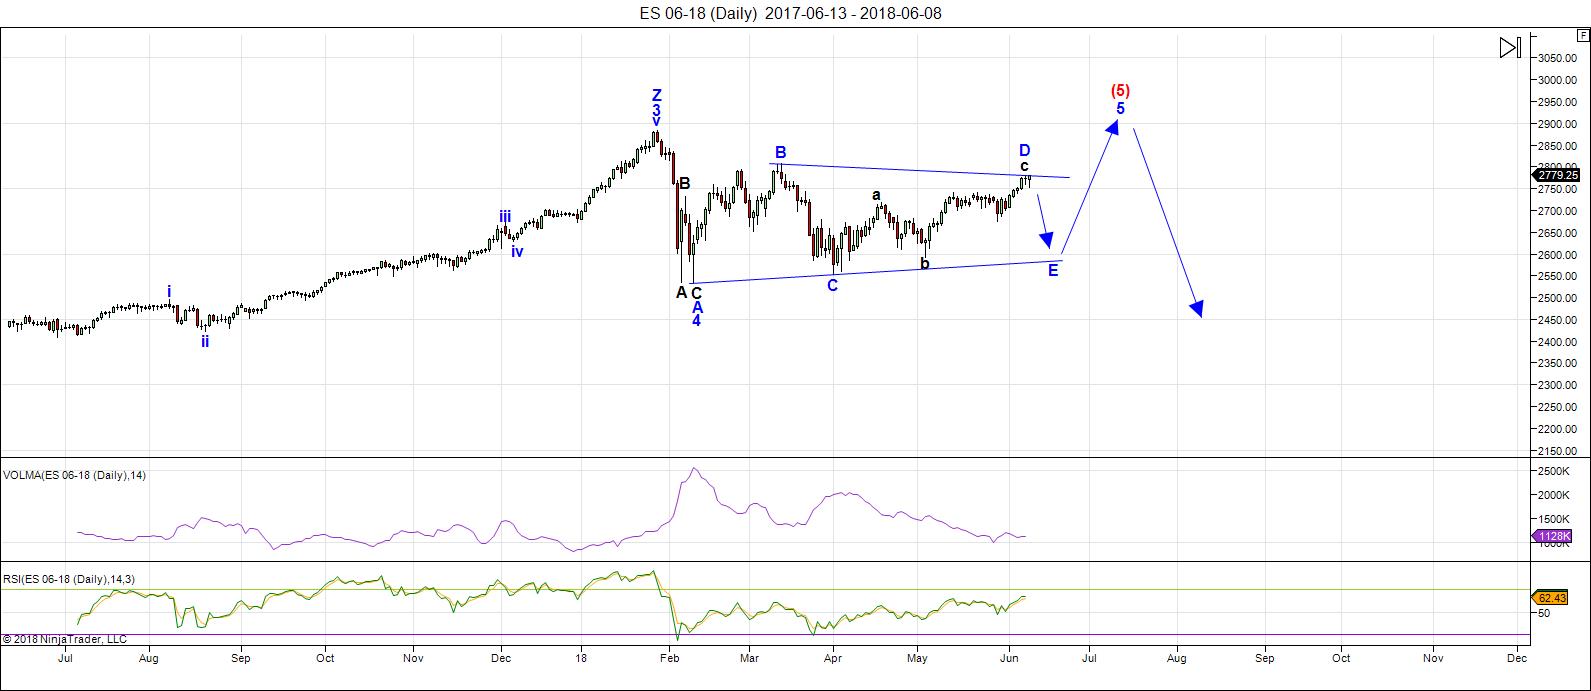
Above is the daily chart of ES (click to enlarge, as with any of my charts).
Last weekend, I complained about the sideways movement in ES for three solid weeks. This past week gave us a very fast resolution, as immediately after I made that statement, the Nasdaq indices (including NQ) decided to rally to create an ending diagonal, sending everything else up with it (see additional NQ daily chart below).
The sideways move has signalled to me that the market is very weak, something I still believe and we may see the E wave come down quite quickly from its perch at the 2780 level.
The 2780 level reached was higher than unexpected, but looking at the resulting contracting triangle, it looks even more “text-book” than it did originally. The D leg top always defines the slope of the upper trendline in a bullish triangle, which this is, so now we should be clear to head down in the E leg.
I don’t have a fibonacci measurement for the 2780 level, which is highly unusual. The highest level I had was 2760. We’ll have to blame this on the Nasdaq.
Volume is exceptionally low, which contributes to the volatility and lack of momentum at times.
After the E wave down is complete, we’ll take off again to the upside in a fifth wave, which will simply finish off the pattern. We’ll get to a new high and probably more, but don’t expect (as I’ve been saying for a very long time) a large fifth wave that travels any great distance. (I think 3000 is possible but at the high end of the probability spectrum)
Summary: We ended Friday at the top of the D leg of the contracting triangle. Topping out will result in a high probability trade to the downside (the E leg of the triangle). Once E leg (down) is complete, expect a final fifth wave to a new high. That fifth wave up to a new high will be the end of the 500 year bull market.
_______________________
Here’s the latest 60 MIN chart of ES (emini futures):
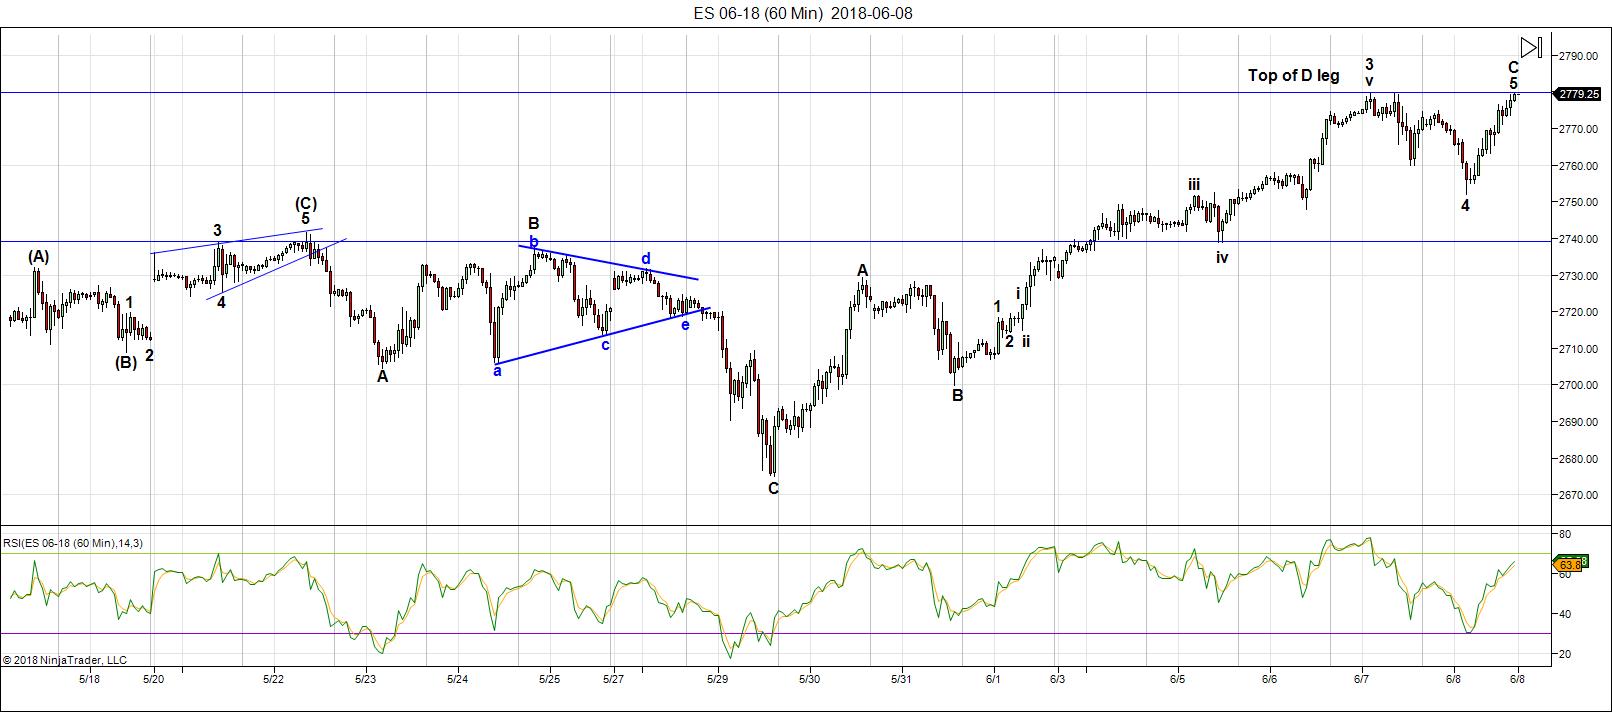
Above is the 60 minute chart of ES (click to enlarge, as with all my charts).
More than three solid weeks of “sideways” resolved itself with a multi-day rally to 2780. At the end of the session on Friday, we were roughly at a double top of a fifth wave of the C wave of a zigzag pattern. I expect a turn down on Monday into the E leg of the triangle. This is a high probability short.
On Thursday night, I’d put out a caution regarding ES, as it hadn’t topped properly that day. It missed the double top by ticks. That’s usually a sign that the index will return to that level at some point. I had also pointed out that the waves down were in three waves. “Waves in three” completely retrace.
The morning rally looked to be filling the gap left by the Friday drop, but by mid session, it became apparent that we were indeed heading back up to a double top.
Summary: I expect an imminent turn down into the E wave of a contracting triangle. The target on the downside should be under 2600.
_____________________________
Some housekeeping:Site navigation: You can find all the specifics on site navigation and elements you might not be aware of by clicking here. Next Federal Reserve Annct: Wednesday, June 13 Andy Pancholi Turn Dates (June, 2018)
* denotes major (bolded, as well) – (for more information on Andy’s turn dates, go here.) New Free Blog Post: From the Crowsnest (I project timing for the top) The CHART SHOW signup is live for Wednesday. You can sign up now in the usual spot: webinars. Problem receiving blog comment emails? Try whitelisting the address. More info. ________________________ |
Market Report for Monday, June 11, 2018
CHART SHOW signup
Market Report for June 11, 2018  |
|
Make sure you zoom the video to full size with frame expander (arrows) in the bottom right hand corner and also set the quality to as high as your web connection allows. This is an HD quality video so the best viewing is at that level. |
_______________________________
Longer Term Charts
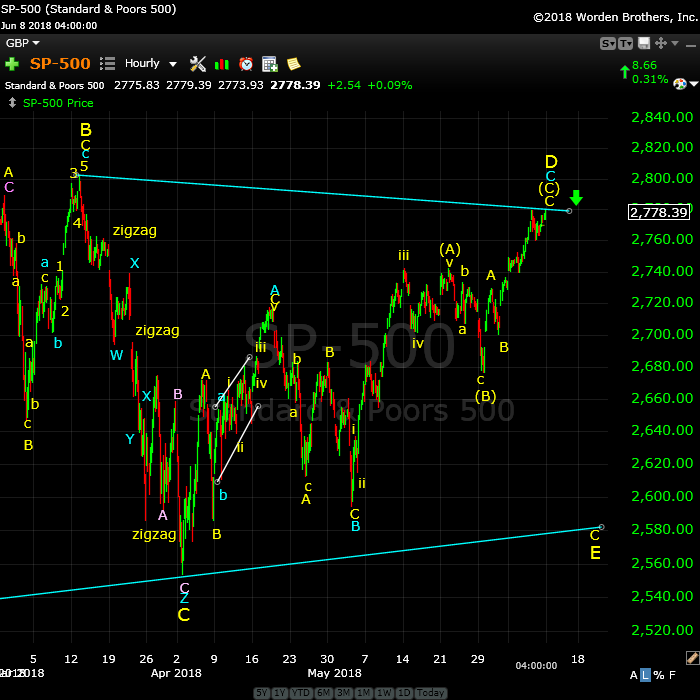 Above is the one hour chart of the SP500.
Virtually the same as ES. At the end of Friday’s session, the rally at the top of the D leg had retraced to about fifty cents below the previous high. That means we’ll need to tag that high on Monday morning (it’s less than a point away from Friday’s high). That should end the D leg (good riddance!) and start a drop in the E leg of the contracting triangle.
I’m calling for a target below 2600, which will depend to some degree on the timing, as the lower trendline is rising. E legs of triangles sometimes drop slightly below the lower trendline and sometimes don’t quite make it to the trendline. I would expect in these conditions that we’re likely to exceed the lower trendline if we don’t stop right on it.
The top of the D leg will be a high probability short to the downside in leg E of the triangle. We should reach the high (finally!) early this week.
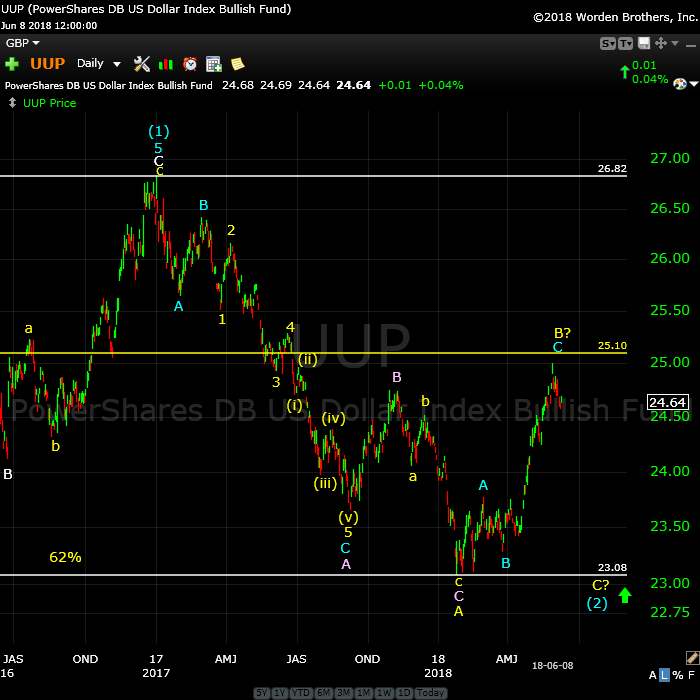
Above is the daily chart of UUP (US Dollar ETF). UUP is representative of the structure of DXY (the US index) and will provide an excellent predictor of the impending top in currency pairs and the US indices.
Short term, the turn down from the high at about $25.00 looks corrective. It also looks like a fourth wave of the C wave is forming. As a result, I’m looking for a final wave up to the 25.10 area, which would support a turn down in the E leg in the US indices.
I’m expecting a new low for the dollar longer-term.
The pattern here is an ABC corrective wave to the upside, which appears to be almost complete. I’ve now labelled the wave up as a B wave, since it’s risen above the previous 4th wave. I’m on the fence as to what patten we might see to the downside.
After a new low, the dollar will turn up to a new high above 104.00 (UUP likewise above 27.00). The dollar will turn with the euro.
Rather than playing a currency pair, you can consider playing a short here knowing that the objective is a new low below 23.00. But I would wait for a small wave down in 5 waves and a lower high to follow that retraces 62% in three waves.
The movement of the dollar strongly influences the movement of just about everything else, so it’s important to pay attention to what it’s doing.
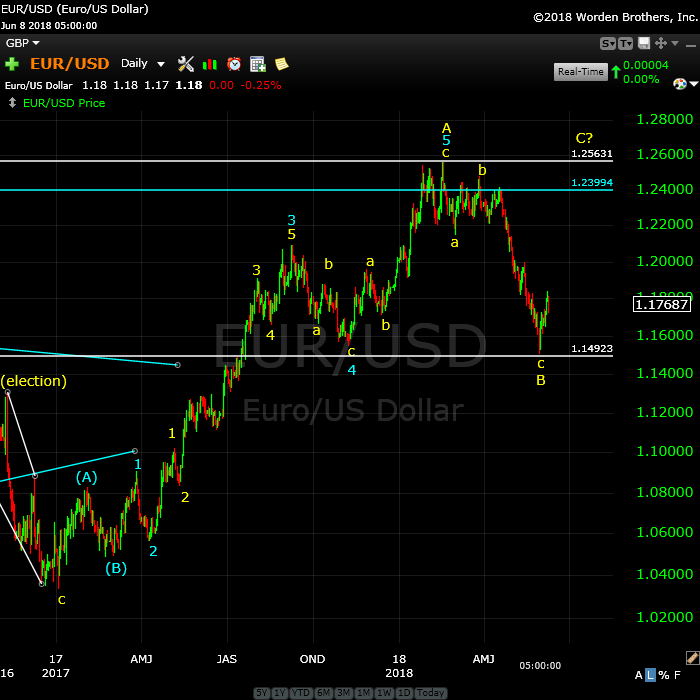
Above is the daily chart of EURUSD.
We appear to have more or less completed a large C wave to the downside, part of an abc corrective pattern. Last week, I stated that I didn’t have another possible inflection point until 1.15, and sure enough, that’s where we landed before a large bounce to the upside.
Currencies have moved up for the past week or so, positioning themselves for a drop down to their previous lows to coincide with the coming drop in wave E in ES/SPX.
The longer term direction is up; we just have to wait for a confirmed bottom. That will lead to a great opportunity to the upside.
In terms of a rally trade, the less risky course of action would be to wait for a wave up in five waves and then a three wave, 62% retrace in a second wave.
Once this final pattern eventually tops (with a new high above 1.256), expect a drop in a higher degree fifth wave to a new low below 1.034.
More on the shorter term in the video, of course.
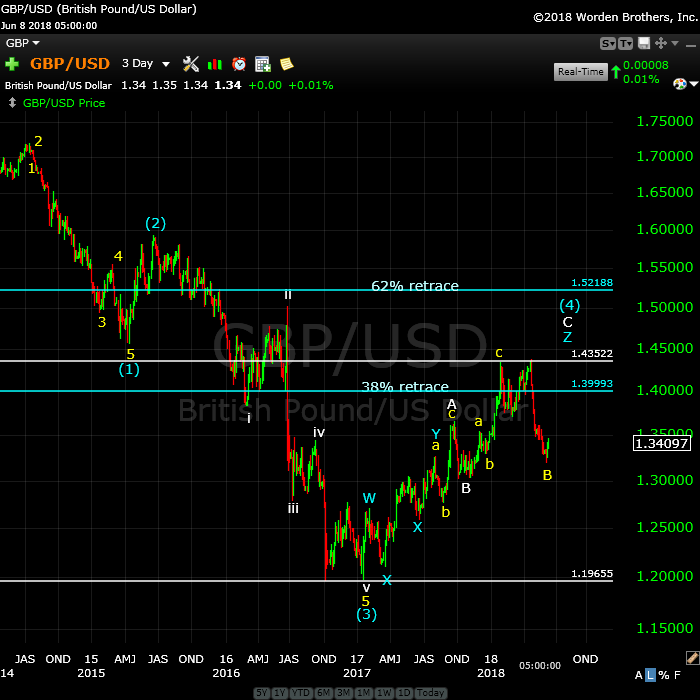
Above is the 3 day chart of GBPUSD. The longer term direction is up.
GBP has a similar pattern to EURUSD. We’re very close to a bottom on this large leg down. The pattern is corrective and requires a rise to a new high.
The drop in the E leg in the SP500 should cause this currency pair to seek a slight new low. The bigger opportunity is to the upside after the drop and a confirmed bottom.
If contemplating a trade, as with the EURUSD, I’d be waiting here for a first wave up and then a second wave in three waves down to the 62% level before a long entry with a target of a new high.
This currency pair warrants caution (as does EURUSD). There are less risky trades setting up in the other currency pairs. However, all the pairs are turning, so as the EURUSD confirms a bottom, GBPUSD should not be far behind.
More information on the short term prognosis in the video.
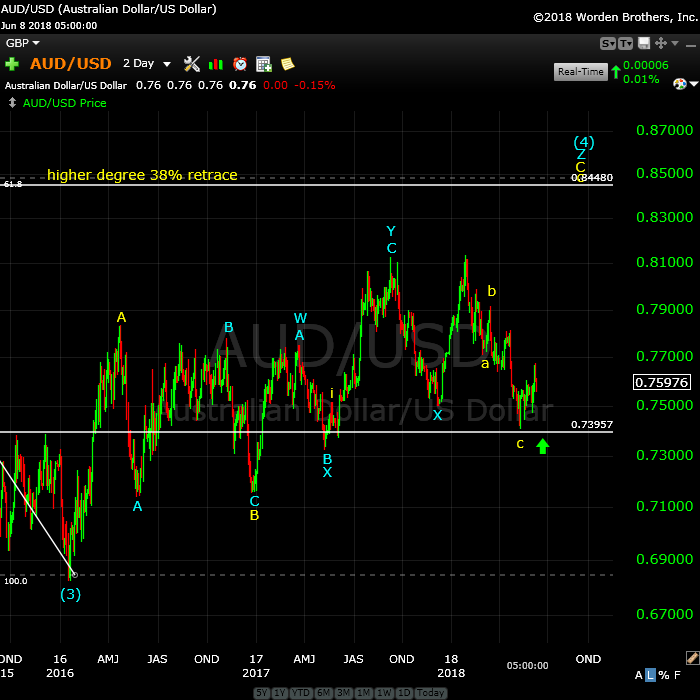
Above is the 2 day chart of the AUDUSD.
On a short-term basis, we’re looking for a bottom here. The waves up from .74124 are “three wavers,” so the direction is still down.
I expect to see a turn down on an hourly chart with the top of the D wave in the US indices (Monday?). The bottom of the E leg in the SP500 will likely see the bottom of the c wave for this pair (at about .74).
The long term target is .84450 and involves a turn to the upside. This is a high probability trade. We wait in the weeds. More in the video.

Above is the 2 day chart of USDCAD. It moves opposite in direction to AUDUSD (due to the orientation of the charts).
We have a high probability trade waiting to set up. It’s straining our patience, for sure.
The short term direction here is up. We seem to be forming a small triangle in a fourth wave position, which would suggest there’s one more wave up before a change in trend. Best to watch nightly videos this week for more information on the movement of this pair.
The high probability trade is a short once we have a top of this corrective wave up in place. The first objective in that trade is a new low below 1.18.
Once this pair hits the final downside target, it should turn up and will eventually rally to a new all time high for USDCAD well above above 1.46254.
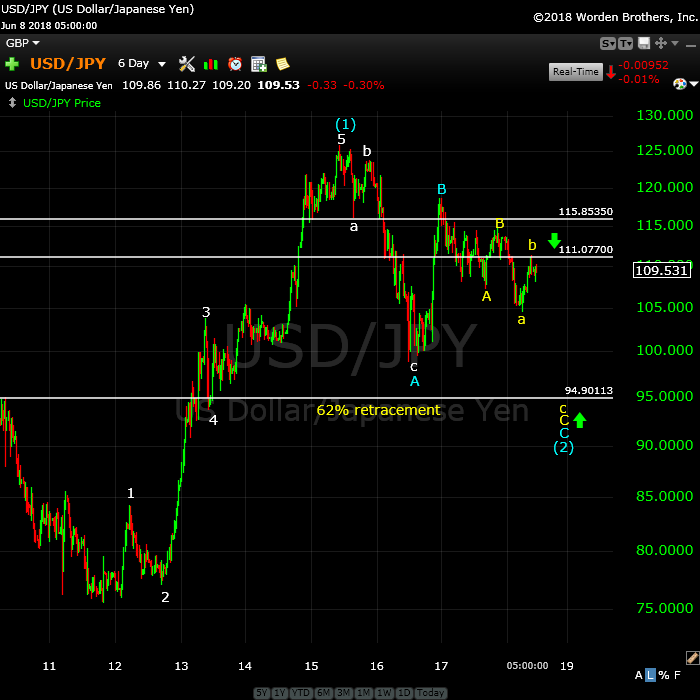
Above is the 6 day chart of USDJPY. For this pair, the longer-term prognosis is for a big drop to the 94.6 area.
We’ve topped here a predicted and are heading down to our target of about $95. See the video for more on this.
After we hit the long-term downside target (~94.6), I expect a turn up in an impulsive third wave far, far above 130.00.
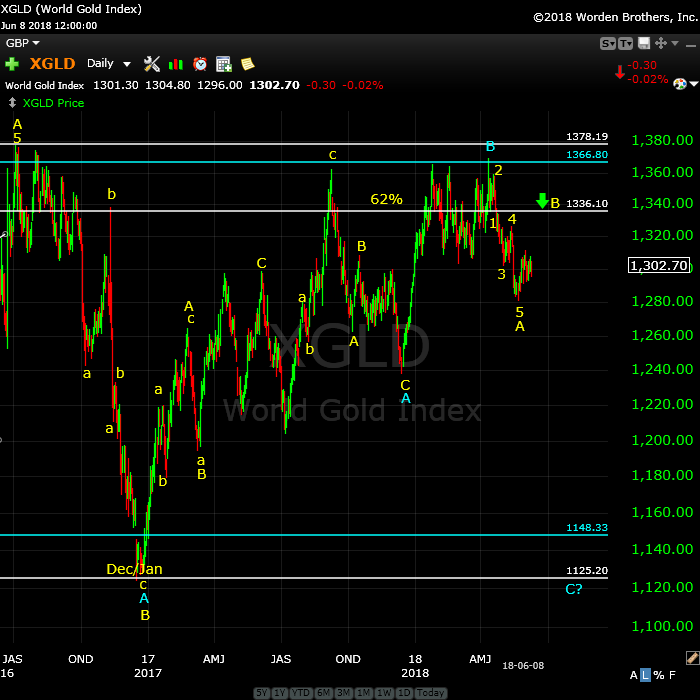
Above is the daily chart of gold. We are starting to set up for an entry in the not too distant future.
We’ve completed 5 waves down and now we’re looking for 62% retrace for a short entry in the 1334-6 area, with a target of 1122.
I will be watching daily and you’ll find updates in the nightly video.
After a bottom at around 1122, look for a wave up in gold to the 1600 area.

Above is the 4 day chart of WTI oil. No change here.
We rallied to a slight new high last week, and then dropped as predicted, but have dropped further than expected in what looks like the fourth wave of an ending diagonal. We seem to be in the process of forming a bottom.
That bottom should lead to a turn up in a fifth and final wave, likely to coincide with the turn up into a fifth wave in the US indices (after the large contracting triangle we’re currently in finishes).
That final wave to the upside could now reach the $79 area before a dramatic reversal (ending diagonals always end in a dramatic reversal).
Longer term (after a top in the 77-80 area), I’m expecting a long wave down in 5 waves to a double bottom at about 26.00. The entire structure going back to 2007 is a corrective wave, with the A wave equal to the C wave in length. This suggests a double bottom at the 26 level rather than a drop below it (but we’ll determine a final target once we see the wave structure of the wave down).
Good trading!


Some questions /observations —
Friday close, I noticed ES’M did an exact double top. SPX missed it by .51.
EUR/USD & AUD/USD both clearly broke 4 hour trendlines on the way down. The retrace at the end of the day stopped exactly at 38.2% for AUD, maybe exceeded for EUR. Any possibility these are 4th waves & we’ll get a 5th or does existing structure suggest it must go all the way back up? That’s a far ride back up considering we think indices are done. If that’s the case, maybe NDX does 62% and SPX ~2804?
I do think we’re done though. 3 stabs at the top is usually it. Let’s hope this doesn’t get dragged out until Wed, the New Moon.
Mike,
Yeah, I considered the currencies options. The wave down in AUD is definitely three waves at the moment, and yes, it could drop down and do a fifth, which would change things slightly. CAD has to drop to finish the E leg of its triangle, so that’s a reason to think AUD will do the same. Also, I wouldn’t really expect AUD to start down without a double top. None of this means that ES has to move much at all.
I don’t understand you NDX comment. 62% of what, in what direction?
I don’t see how it can get stretched out to Wednesday, but then, I’m often surprised in terms of time. It’s also a Fed announcement day on Wednesday, so that could weigh in. We’re eventually heading down, one way or the other.
NDX–up, 7174 or so is 62%
I’m out of AUD and Eur shorts. Made some nice money trading London last few nights. I would actually prefer double tops to repeat the trip and make more on next trip down, otherwise I’ll wait for a fifth and 62% retrace.
Update on the site move: Well, Bluehost (the server company) have completely screwed up the domain transfer and some of the background issues won’t be resolved until Monday. It’s taken me all day to get the website back up again, but my email at worldcycleinstitute.com is not working properly and likely won’t be until Monday.
If you need to get hold of me through email, use peter@petertemple.com in the interim. I’m a tired puppy after today …
Peter,
ES just hit your target of 2780.
Sounds like you’re using Sept futures, which are about 4 points higher.
Peter,
Thank you for pointing that out.
Am I right to say that if I were to be using Sep futures target is 2804 ?
Thanks
Peter,
Sorry I meant 2784 , 4 points higher than your target of 2780
Hmm. Does USD/JPY want a double-top as well? 110.03 / 78.6% another tick or 2 & I’ll bail.
Back to 24/6 babysitting. Can’t leave this stuff alone, or you get stopped out, it turns, & runs without you.
EUR/USD also 78.6%
2780 gone , ah well not to worry theses EW counts will go on to infinity
wonder how the guys at Gann are doing,couldnt be any worse at least
I don’t really have much to add this morning. We’re looking for a top pretty much across the board. Everything I see is down in three waves, so looking for a new high.
USDJPY should reach 110.25, which puts it at the top of a second wave.
ES appears to be in a small ending diagonal now on a 5 minute chart, so we’re likely looking for a new high and maybe a bit of a “throw-over” of the upper trendline.
Just when you thought it couldn’t possibly get any weirder …
I still see currencies that think they have more upside, while futures look really weak …
We may be here for awhile.
Peter,
Does that mean a few more days?
No idea. But if we keep going up, we’ll end up with an ending diagonal in SPX, as well. Maybe that’s the game.
Now the contracting triangle is starting to break on the upside in the SP500. I have a sense we’re going to create an ending diagonal in SPX, as well.
I just don’t like the look of the triangle. The upper trendline’s slope has changed.
2802 is the previous high in the SP500, so we’re not all that far away. We only have to exceed it to have an ending diagonal in place.
I give up lol. Just watching this market now. It all ripping higher with enough force to slay the bears. Today is a Pancholi turn though so maybe we top at the end of the day or so.
Totally confused & on the sidelines. On a 4hr chart it looks like we are doing 5 up, headed to 2838, then pullback, then the top. Please tell me I’m wrong & this scenario is simply not possible. Currencies just twiddling their thumbs. Seems like one is waiting for the other to finish off.
I don’t understand the question, but currencies still have a ways to go, and I’m assuming that ES/SPX is going to do a third wave of an ending diagonal, so another 10 points or so in the Sp500.
A good one to watch is USDJPY, which needs to get to about 110.25. The dollar just seems to be pushing everything up. ES I think has to go a little higher to about 2810 or so to get to a new high. But when USDJPY gets to that target, I would think we’d have a top in place across the board.
The earliest I can see a resolution is end of day, which means probably tomorrow for a turn down. The contracting triangle is broken, imho and the next probable is an ending diagonal.
The good news is that this may shorten the route to the top, both in price and time. The fifth wave of an ending diagonal cannot be longer than the third wave, and a visual check suggests that with an ending diagonal, we’ll eventually just get to a new high and no higher.
Depending upon where we get to today, I’ll go through this in tonight’s video. USDJPY has to get to 110.25 and it seems to me that’s a good marker for everything to turn down.
I’ll be out for most of the rest of the session.
I’ve gone long and intend to stay long till new highs. Pullbacks are an opportunity to add. I think it’s easier to just be long on this grind up rather than trading this terrible market.
In ES, above about 2810 starts to get chancy. But the one to watch is USDJPY, because the dollar is the instigator and when it USDJPY reaches 110.25, we’re probably going go turn over. Other than that, we wait.
great calls from 2730
nailed the jpy
gold as well
unbelievable
It’s a Fed announcement week, with Noon EST on Wednesday as “D-Day” (Down Day, hopefully). Don’t know for sure, but based on what’s happening, that’s a potential turn point that seems reasonable.
I can receive emails at peter@worldcyclesinstitute.com now. I just can’t send them form that address, (although I can send from other addresses). Extremely frustrating. The problem has been escalated with the web hosting company, so I’m hoping they’ll be able to resolve it in the next 24 hours.
The Market Update for Tuesday is live at the top of the post.
I note that the Russell 3000 has now also morphed into an ending diagonal, joining the Russell 2000. So only ones that aren’t in an ending diagonal are the DOW and NYSE. OEX might be morphing into one, as well.
The point is that we have multiple US indices in ending diagonals, included all the Nasdaq related indices.
USDJPY is now about the 110.25 target, so I don’t have a good idea of where it’s going. Best to wait on the sidelines until we see 5 waves down … unless we get some other signal that sheds some light on where it’s going.
Now that we have an ED instead of a triangle, how does it change the downside target after this leg tops out? What about currency targets? EUR still going to a new low, then new high?
I’d be guessing a bit at this point, because I don’t have a top in for wave 3, so I don’t have anything to go by. In SPX, the downside of wave four will now be something like maybe 2630-40. Then the fifth wave up will be in three waves rather than five (ending diagonals are more difficult to trade, which is me saying “unless you don’t mind a lot of being buffeted around, it’s better to stay away).
The final fifth wave in the US indices is likely to only barely reach a new all time high, as it’s going to be limited by the length of wave 3. These EDs look like they’re barely going to create a diagonal.
It won’t change currencies all that much. I’m watching tonight (I’m long AUD) the currencies and they’ll all rise slightly. AUD should get to a double top around .767, for example. I have a fib target for USDJPY of 110.65.
The challenge is nailing the turn down at the top of wave 3 in ES/SPX. I might be tomorrow. I don’t know what’s driving this, the summit, or Fed meeting (I’d be surprised if it’s the latter, actually.
In ES, if we have an ending diagonal in play with the top at 2790, and all we’re getting is this small 4th that seems to be complete, then the upside maximum for ES is 2818, which satisfies the need for a new high. So, that could be tomorrow morning.
Currencies are moving tonight, and they also don’t have far to go (AUD, CAD, and JPY are the easiest to predict). USDJPY has got itself now in sync with this move up in ES, having just completed its fourth wave, as well.
So, I think we’re close to a top … it’s the timing that’s the issue more than anything.
I honestly wish everything was just doing its own thing. This interaction between all the different asset classes is at times a little mind-boggling to figure out.
Very little change this morning. ES needs to get above about 2803 or so (and then some) to top in the third wave of the forming ending diagonal. NQ looks like it’s got to reach 7236 (a double top). They both look like they’re in fourth waves with one more wave to go.
USDJPY is closer to its target, also appearing to be in a fourth wave. I think that target is at about 110.80, based on the the measurement of the subwaves in this final wave up.
After a close look at USDJPY, although I don’t have a reliable measurement, there’s a good possibility that this pair will end up rallying to the previous high at 111.40. The wave structure is corrective to the upside, but the subwaves are just not clear. In any case, the direction here is still up.
The entire market seems to be drifting with no strong direction.
ES has dropped to 2782, the 62% retrace level, so there’s a potential entry here for the very slow rally to the high I mentioned earlier. You don’t want to be below 2782.
ES. Now that we have a first wave in place and a second wave tentatively bottomed at 2782, that puts the third wave target at either 2796 (1.618) or 2805 (2.618). We should be a fourth and fifth after that to the target (not sure what the target is until we have the third wave in place.
ES just failed once again in what is a very long fourth wave (timewise). However the direction is still up. The wave down is corrective. 2778.50 is likely the bottom. There really aren’t any sure trades in this market.
I’m expecting to see a top and turn down in the US indices after the Fed announcement tomorrow (the usual routine would be the day after).
The Market Update for Wednesday is live a the top of the post.
For the Chart Show, I’m going include some stock charts of various assets at the top of third waves of ending diagonals. There are going to be some opportunities in stock along with the drop in the US indices.
ES looks to have one more wave up to go, so It looks to me like the Fed announcement or end of day is likely to give us a top. USDJPY seems to have done an ending diagonal and we may be in a fourth wave, with one more high to go.
Currency pairs pretty much as expected … no real change.
USDJPY is turning up now from 110.40 (a little lower was the turn) and the target should be 110.80.
USDCAD is heading down in the final leg of its triangle, with a target of 1.291 and the turn up will likely be the turn in the market later today, a high probability trade to the upside (no target at the moment, but at least 1.3133.
AUD should head up to a double top at about .768, I think. I has a wave down in three waves on an hourly chart.
So, there are a few opportunities today while we wait for the big turn. ES an NQ will keep heading up through at least the Fed anncment at noon EST.
Welcome to 1929 all over again…
ES is still headed up. I’m short USDJPY. It hit 110.8 and turned down (I’ll add on below the previous fourth under 110.6), because I’m not sure a top is quite in yet. I still think SPX turns down tomorrow morning (or end of today).
If you’re short USDJPY, it looks to be down in three waves, so I’m expecting a double top. More in the chart show.
USDJPY now looks like it’s got a first wave almost in place … more downside expected to 109.90 before a second wave bounce.
The Market Update for Thursday (the Chart Show) is live at the top of the post.
Looking good this morning. USDJPY hit my downside target exactly, so that gives us a first wave in place. The second wave retrace should go up to 110.47 (62%) and that’s our high probability entry for a multi-week trade to the downside.
ES should keep rising this morning. Our target is a new high above about 2805 or so. I’d give it a little more than that, but USDJPY should be a good “marker” for the ES turn, will will take out a lot of the risk.
As less risky strategy for ES is to wait for a first wave down and a second wave up (a lower high).
I just placed a chart of ES at the top of the post with what looks like an expanded ending diagonal tracing out its final wave.
Im short ES now. Looking to add as we move up.
Closed ES short. DAX and FTSE are powering higher so maybe the ES will go back up to 2805 as your chart shows
Euro is getting destroyed. I reckon GBP and Euro have topped and we should get a decent wave 2 up and then go short for the ride down.
The DAX breakout above 13k for me is a major bullish sign and I’m not going to hold my ES short for long if there is no reversal and close below 13k.
I updated the chart of ES at the top of the post, now that we have an A and B wave in place. The fib extension is giving me a target of about 2807.
Looking at where ES is compared to USDJPY, be careful with the later. The wave down in USDJPY could structurally be either motive or corrective, so there’s a chance we may see a double top — I can’t tell. The measurement of the subwaves works for motive and corrective.
USDJPY will either turn around the 110.5 level or head up to a double top. We may not get a turn until end of day or tomorrow morning at the rate we’re moving.
USDCAD: The triangle that I’d flagged in the last few videos looks like it’s morphing into an ending diagonal, which would likely mean the top at 1.31332 that is a potential top may just end up being the turn.
Currencies in general look like they want to bottom, so perhaps we’re going to get a reversal as ES tops, which would certainly be counterintuitive, but technically things seem to be pointing in that direction.
Very odd looking market today overall.
I’ve reversed my USDJPY trade and am now short. I’ve been long ES since 2783 approx.
I’m now on Sept futures, so my numbers reflect that.
I’m out of USDJPY. I think a double top at 110.80 or so is more likely now.
In fact, if USDJPY’s wave down yesterday is corrective, it opens up the door to another leg up to previous high at 111.40
Looking at the hourly chart of USDJPY, I can view the final waves up from 109.2 as yet another ending diagonal. They’re all over the place.
If that’s the case, this wave up is the final wave and could easily make 111.4 on the high side.
I just posted a chart of USDJPY at the top of the post, rather than wait until the end of the day. It’s getting rather obvious that we have an ending diagonal forming there, as well.
I’m out of ES, as well. Imho, best just to let the US indices grind away and pick it up at the top with a short. Triggered my stop. These waves up keep doing 3’s and failing.
Euro seems to be heading for a double bottom you think?
Well, as little lower, as I’ve been saying. More in tonight’s video. I’m working on now.
Emails of comments seem to be working OK … certainly for me signed up as a subscriber (not as an administrator). I urge you to give it a try and let me know if you experience problems.
We may finally get our long awaited turn in the morning. All the currency pairs may also turn.
The Market Update for Friday is live at the top of the post.
USD/CAD hit (exceeded) target way ahead of everything else & others turning up. Maybe CAD not finished yet, or the others are?
Everything looks like it’s only retracing. Would think CAD target needs to be higher, unless it’s ahead of the rest. Sometimes it is.