
Update Oct 12, Late Night (Midnight, EST)
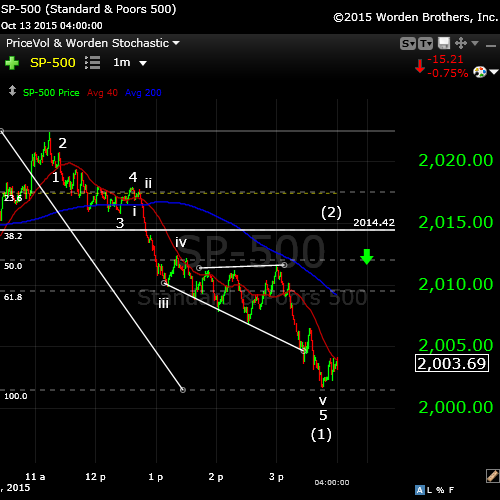
Above is a 1 minute chart of the SP500 at the end of today’s session. I was concerned last night about the futures market and the look of the waves. They look much better this morning and I can now count 5 waves down in cash and futures.
If it is 5 down, we should bounce from here into a second wave that should turn down at the 62% mark (horizontal line) into a third wave. We could also turn down at the 38% level and complete the 5th wave of a longer first wave down.
However, I have reservations as the DOW appears to have overlapping waves and so will need to test the top again. The Nasdaq also may have some issues with its structure, although it appears to be in a very large triangle, so this wave will likely end up as a three. While the SP500 may to have topped, we still need to be vigilante towards watching the market in general.
I’m not tossing in the “all clear” until I see what happens tomorrow (Wednesday). I’m leaning tonight towards one more set of waves up.
_______________________
Update Oct 13 Before the Bell: Futures has a small drop last night and although it’s difficult at the moment to identify 5 waves down, but the wave does look motive and the fact that the ES broke support at the previous fourth suggests this might be it.
Also, NQ and YM did ending diagonals yesterday and ES completed a triangle and a double top.
So let’s see what happens in the first couple of hours. Cash will need to properly top. We’ll see where they open.
But I would be on the alert for a 62% retrace in three waves or a double top here.
Be careful. We still haven’t broken any technical levels, so this could also be a fourth wave and signal we’re going to finish this final wave up. All the cash indices still look like 3’s down so we still could go to a new high … but I don’t think it would be a large new high because of what the future did last night.
__________________________
There are quite a few cyclical indictors pointing to a top on October 13.
- a strong cycles analysis (below) that shows a definitive cycles top
- the Puetz TPD crash window focusing on the October 13 new Moon
- the market itself, which appears to be finishing wave 5 of 5 of a regular flat
- the upward movement of gold, which typically suggests a “flight to safety”
If you have any thoughts from a planetary perspective on the October 13 date, please post them in the comments area.
As we approach the top of this correction, I often get asked where the best place to enter is. Here is a brief explanation of what to expect and the safest point at which to enter a short trade after a first wave down.
In today’s post, I’ll run some high-level charts and provide a short term one for the SP500.
First, let’s look at the medium term Elliott Wave pattern which is tracing out and is near the end of the C wave.
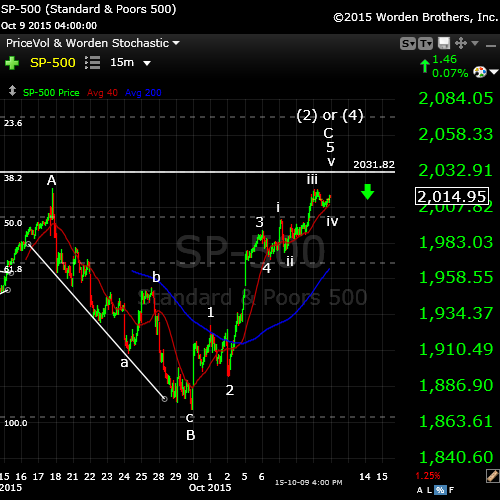
Here is the SP500 above. Based upon my scenario of an ABC down wave from last week and an “ending wave” up, here’s what remains of the path. The wavelengths in this final C leg up are textbook.
Wave 3 is 1.6 times the length of wave 1. In the final 5th wave, wave iii is 1.6 times wave 1. If wave v traces out the typical full length (1.6 x wave i), it should top at 2052. I have placed a line at the 62% line, which is another typical stopping point (2031). So, somewhere in between 2031 and 2052, the market should turn down.
I measure the ES top at 2030.
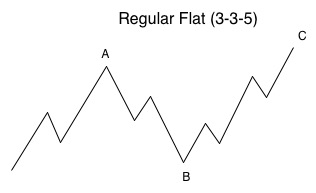
Any flat correction is in a 3-3-5 pattern. In this case, the B wave would have been the ABC wave down from last week. The A wave would be the pattern from Aug 24 up to the high.
In a regular flat correction, “wave B terminates about at the end or about at the level of the beginning of wave A, and wave C terminates a slight bit past the end of wave A.” If we complete a flat that goes to a slight new high, then this would have to be a larger 2nd wave and the downside will be much greater than a 5th wave. For example, the third wave alone would take us down to the low 1600s in the SPX. We would have a 5th wave after that.
___________________________
If it Quacks Like a Duck …
We’ve been looking at the large correction from August 24 (7 weeks now) as wave 4. Because of the extreme length of time this correction has taken compared to the time taken for the second wave in the first leg down, I’m inclined to label this wave as a larger degree wave 2. (The second wave of the first leg down only took about a month to correct, whereas this “fourth wave” has taken twice as long. They typically would be of a similar length.)
On top of this, the fourth wave’s guidance is that it retraces 38% of the preceding wave. We have almost retraced 62%, which is a typical wave two retrace level. You’ll find in most of the charts below, I’ve kept a “2 or 4” labelling. If all the indices reach 62%, I would be inclined to label this correction wave 2, which means the drop in wave 3 to come is very much greater that if this correction was wave four.
Let’s look at the overall market to get a sense of where we’re at in the larger time frame.
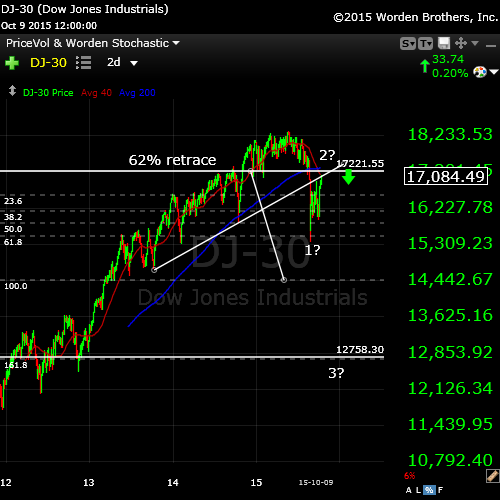
Above is a 2 day chart of the DOW. I’ve drawn in the up sloping trendline for the final fifth topping wave. What often happens before we take a big plunge, is that the market heads up to “kiss” the trendline one last time before turning and moving in the opposite direction. Based on what I’m seeing in the shorter-term charts (the ABC wave down), this seems like the likely scenario to me. Cycles and history repeat.
If this is the second wave, I have overlain a fibonacci retracement tool to give an indication of our target for the third wave. The third wave down is typically at least 1.6 times the length of the first wave, putting the target at approximately 12,758. Following that would be a 4th wave retrace (38% and then a final 5th wave down).
This is the same chart I included in the previous post, just updated.
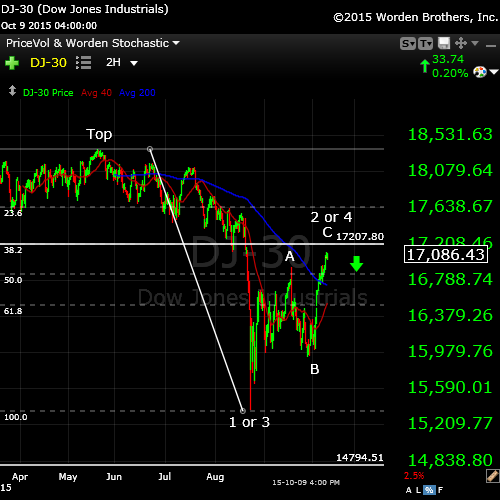
The 2 hour chart of the DOW. This is simply an update of my chart this past week, predicting the rise we’ve experienced in the last few days. This correction has almost reached the 62% level (the horizontal line). It should turn down there or slightly above this level.
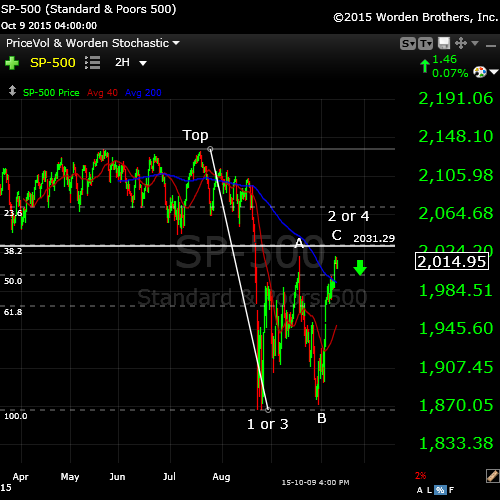
The SP500 (above) sports a similar configuration.
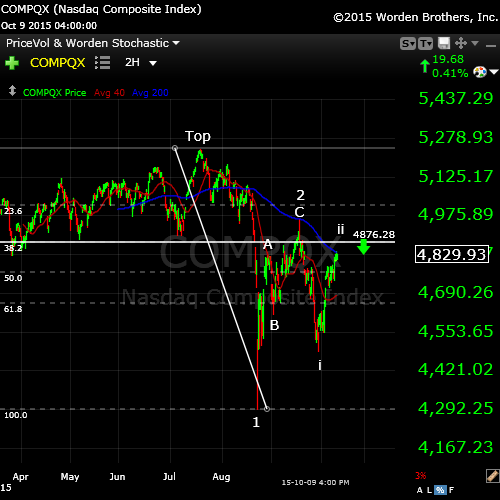
The Nasdaq above is slightly different. It appears to have completed a second wave, although this leg up could extend to reach the previous spike top at 4960.87. This would change the labelling slightly and make the resulting top wave 2. The outcome will be the same—a turn down into a third wave.
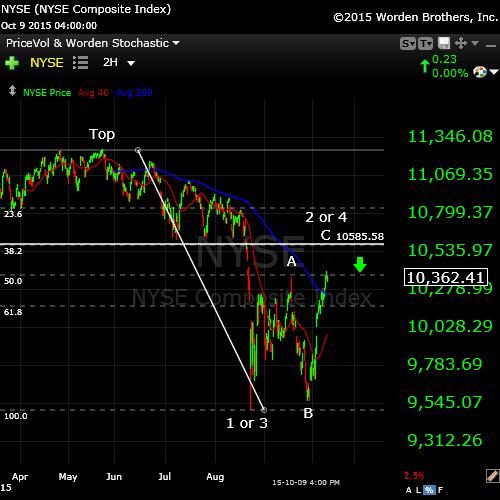
Even the NYSE (above) is stretching itself to make the 62% retracement level (horizontal line).
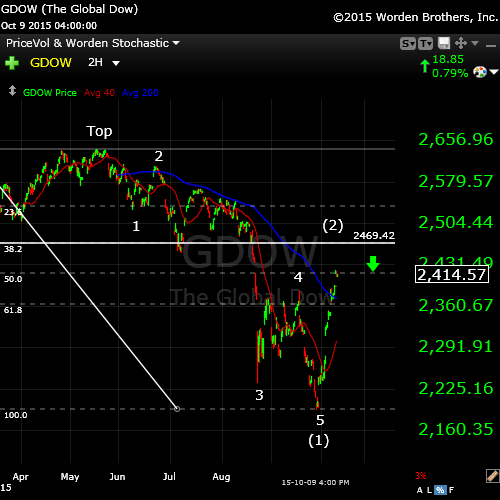
The Global DOW (GDOW) has retraced up beyond the target in my previously posted count. I’m now expecting it to rally to the 62% line to trace out a 2nd wave before a turn down in a 3rd wave. This would fit with the prognosis in the US markets and reinforce my count there as a second wave retrace.
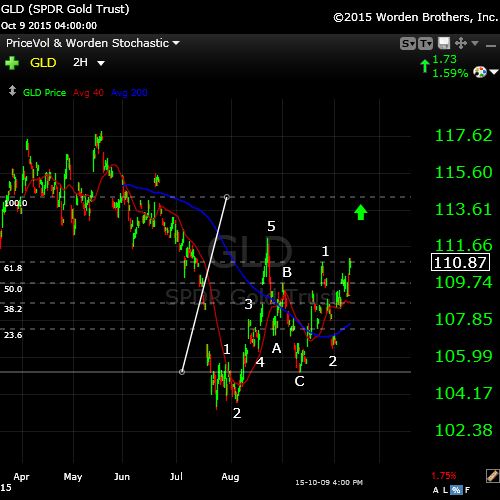
Gold (GLD) above is starting to take off. On a larger scale, I expect GLD to retrace to the 62% level, which is at about 153.00. It has a long way to go. You can see here that we’ve completed a first wave up in 5 waves, have retraced in an ABC pattern and are entering the 3rd of 3rd wave up (after completing waves 1 and 2 of 3).
Another Ominous Signal
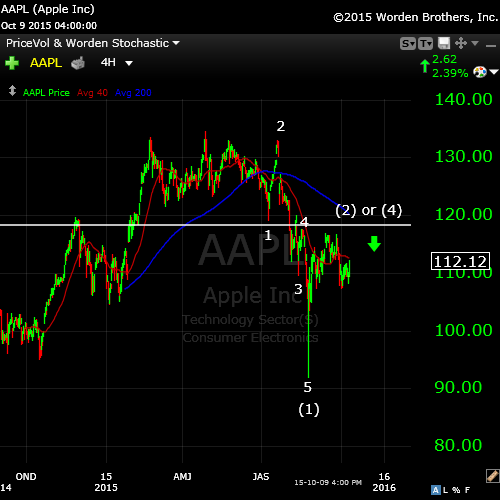
Above is the 4 hour chart for Apple (AAPL). Apple has done 5 waves down and has retraced to the previous 4th wave (not quite 62%, which is the horizontal line). It looks to be completing the second wave of the 5th. If this is the case, the next stop should be $75.00.
All the waves down measure correctly. The 3rd wave is 1.6 x the first, as is the fifth wave.
If this corrective wave is the third wave (alternate), the downside target will be much lower.
_________________________
Cycles Analysis
I ran this chart Friday after the market close (Oct 9). I’m showing a cycle top now on Tuesday, Oct. 13, 2015.
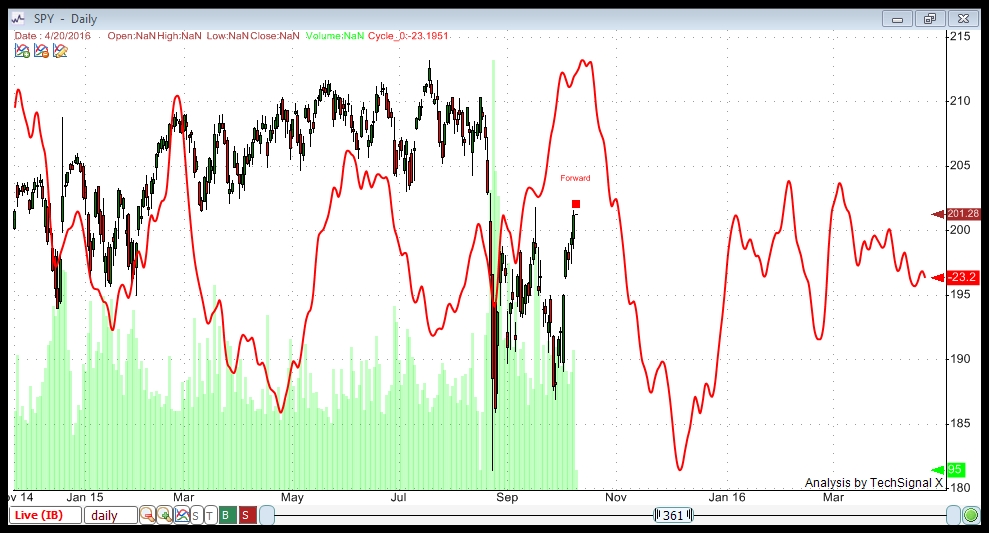
This cycles analysis uses Techsignal X from the Foundation for the Study of Cycles. I’m using data going back to 2002 this analysis of SPY (SPX) and displaying a compilation of all the cycles the software has found over that period. You can see how close-fitting it has been in the recent past. The fit with the current wave is quite stunning and therefore, something to pay attention to.
This analysis suggests a top to the current wave on October 13 (starting down on the 14). Oct 13 is also the new moon.
It shows a bottom to this set of waves down at December 7, 2015.
This particular cycle top (Oct 13) is a strong one. I’ve gone a little deeper into what the analysis is telling me on a separate page. Here’s a more in-depth explanation of what this chart is suggesting.
_______________________________
The Panic Phase and the TPD (Turning Point Distribution) Principle
The TPD Principle describes a period in time of several weeks in which an array of cycles congregate, including gravitational, geomagnetic, and nuclear. It’s around this time that markets have historically topped. I was asked to include a reference to this in today’s blog post, which I’m happy to do. This principle generally refers to market tops (which we’ve already seen on May 20, 2015), but it’s interesting to note how many astro events we have occurring over the weeks surrounding the upcoming major turn in the market.
In his book, “the Universal Cycle Theory,” Stephen Puetz writes, “The TPD principle involves the eclipse cycle as well. The eclipse cycle normally peaks on the first new moon before a solar eclipse. Following that reversal point, it takes six weeks for sentiment to shift from euphoria to panic. Then on the first full moon after a solar eclipse, a panic-phase begins. A panic phase usually last two weeks—ending at the time of the next new moon.”
The dates:
Aug 14 , 2015 – First New Moon before the Eclipse (there is a New Moon happening at the same time as an Eclipse—Sept. 13)
***Aug 29 – Full Moon before the Solar Eclipse (peak of the eclipse cycle)
Sept 13, 2015 – New Moon and Partial Solar Eclipse
Sept 23, 2015 – Fall Equinox
***Sept 28, 2015 – Super Blood Moon Eclipse (start of panic phase)
***Oct 13, 2015 – New Moon (this would mark the end of the panic phase) – six weeks after the Aug. 29 full moon.
So … there’s a lot happening in the area of cycles right around now. Oct 13 starts to look important to a possible major market turn.


Hi Peter
On May 2nd , 2011 we had a high on Jupiter – Mars Conj ( Geo ) . We have another one coming up on Oct 16th . We can always allow up to 2 -3 days Orb around these dates.
I think your latest analyses is correct , since we will end up possibly closing the gap around 2035 ( SP-500).
Regards
AZ
Bradley turn date … 10/09/15 …..Friday [Astro data ]….
Best to you ..Nick..
On Saturday, October 10, Venus will square Saturn, which has tendency to devalue materials and status, not elevate them. The very next day (Sunday, October 11), the Sun ends its translation of the Uranus/Pluto square (October 6-11), with its opposition to Uranus. This cosmic phenomenon has a tendency to correlate with sudden shifts in market trends. If it happens again, this spells trouble for stocks and commodities because both have been rising.
Taken from Merrimans web site
I am personally looking for a low on the Oct 16th, nothing major. Perhaps 1940 – 1955 futures
Friday the VIX fell for the 9th consecutive session, the longest losing streak since October 2011. I do not believe for one minute that the vix is going to continue this streak. We are going to have some kind of rebound. 9th day represents endings. We shall see.
GDX has made a beautiful ending diagonal on the monthly chart. Should I expect a double bottom? I am a very reluctant bull on gold.
Puetz panic window: Sept28 – Oct13.
We are in the strongest in many years short squeeze panic buying rally.
Coincidence?
I measure the ES top at 2030
Hi Peter,
many thanks for your lenghty explanation on my previous question. Appreciated a lot. As cycles and pattern progress can you show with your software what happened last time with the SPX when all cycles are topping as this week? Best, jaze
Jaze,
I “eyeballed” the last date (from the previous analysis). My error. I went back and did the same analysis again and it should have been a week later. Won’t do that again.
Try this Jup-Sat cycle Oct ( 9th )
http://time-price-research-astrofin.blogspot.com/2015/10/spx-vs-jup-sat-cycle.html
In my analysis, last weekend was significant and should have been the formal high. But with Mercury retrograde things get messed up. I could have told you last week that if my timing wouldn’t work, the next strong possibility would be this weekend.
This weekend should be classified as the dark days in the 7th new moon after the vernal equinox. Europe set the high 9/9 in the dark days in the 6th new moon. Wallstreet will do so in the 7h.
Monday we will see the new moon at apogee and heliocentric Venus conjunct Mercury with Mercury at perihelion. And Mercury will end the retrace up in declination when the moon crosses the equator.
So October 13th is not too bad, but October 12 is more likely than 14.
Cheers,
André
P.s.
Gann techniques say that 2033 and 2049 are magnets with 2041 as midpoint. Nice confirmation for the price range above
and… following McWirther theory the lunation at 13 october is opposite uranus and lunation transists coming week natal jupiter. Trend change has higher statistical probability.
Hi Peter
we have a mars Uranus pair as well as a Sat Uranus pair along with a jupiter uranus pair coming up Oct 20:26 . also part of the puetz window is the full moon on Oct 26th . not sure to be honest if that time frame becomes a high or a low . technically it can be either yet so far with the puetz window working opposite of what most expected we may end up with a choppy sideways trend into Oct 26th .that is not what I’d like to see yet you just never know .the new moon is typically the peak in momentum yet the end of the trend is 6 days before to 3 days after the full moon with in 6 weeks of the solar eclipse .from what I’m looking at I’ll sum it up .the puetz window is closing yet the Oct 20-26 time frame in regards to mars Uranus ,sat Uranus as well as Jup Uranus is bullish following that Oct 20-26 time frame . very tough to say one way or the other how to position myself trading wise .also something I have noticed over the years is that the moon flips so to speak from Nov to Feb , if this holds true in this time period a full moon peak in late Oct would give odds to a new moon low in early Nov , statistically Nov 7 is the seasonal low with Jan 16 a seasonal high of sorts . the Nov 7 to Jan 16 bullish period can be easily checked by looking at the history back to the early 1980’s . not saying it’s perfect yet it’s high odds to the potential bullish side .to many variables at this juncture to msje a solid conclusion . the wave count will tell the tail soon enough
Joe
ES looks to be in a triangle this morning and NQ is an ending diagonal. Both suggest a top is very close …
Thanks to all of you who added your thoughts on planetary timing. Very helpful!
If we take out this morning’s lows, there’s a very good chance we’ll just keep going …
Peter,
I think it’s very well possible we have a bigdrop this week rise again and make a new low around november 15.
Peter,
If we start comming down do you have an idee how it will develop
Thanks.
It will start to come down in 5 waves (a motive wave). I will post a diagram tonight as to the safest place to get in. I would expect that the SP500 will need to make a new high above 2020.86. It didn’t quite get there with the last high. After seeing today, I don’t know if it will get much further. We’re tracing out the fifth wave now, but we’re struggling so it may be shorter than normal.
You want to watch for a pattern of five waves down and then three waves up to 62% and then a turn (but I’ll post a diagram tonight). I think Oct 13 is going to be the day …
Thanks,
I m still amazed how E.W. works….never ever thought that we would retrace this high.
So I will be stunned if this will play out the way you described it above..
And so was I when I first got into it. It’s complicated, though. There are 21 different patterns, and most of them are corrective. So it takes some time to understand fully and master.
I’m actually now of a mind that the fifth of fifth wave up will fully extend to the 62% level, making this a second wave of larger degree. We’ll see how well we do overnight.
Today we spent most of our time in a fourth wave (triangle for the SPX).
Emini futures should pull back to 2006 if not lower overnight.
We had a classic “magnet pull” at the close to fibonacci resistance,
See chart.
http://www.screencast.com/t/uTYa8wD12TYx
Peter,
I’ve put together a brief explanation of the safest place to get in and what the first wave down will look like: https://worldcyclesinstitute.com/where-to-get-in/
PALS this week:
Two and two, phase and seasonals strong; declination and distance weak. Post Uranus opposition and end of mercury bull post inferior conjunction planets are not supportive.
So, am day trading, buying morning lows 10:45 am, and selling at or near close.
Rapidly approaching the no short zone October 27th or so until December 15th. So, if a large decline is approaching needs to manifest soon.
When looking at foreign developed market (e.g., EFA), is it starting to look like the correction was ABC?
Paul,
I’m starting to see this pattern (or patterns similar to it) in a number of areas: RUA, GDOW …
The wave that concerns me on EFA is the wave down from Sept 17. It looks to be in 3 waves. That would mean the top of it would be marked with an A, the bottom at 56.00 a B, and the top that’s forming now a C. This would make it an expanded flat. The C wave is in 5 waves, as it should be if it’s an expanded flat.
http://www.elliottwave.com/tutorial/Lesson4/4-2.htm
Peter,
I still believe we just finished a complex wave 4 and the 5 of the big 1 down has just started… November will be hard up after the big decline into the end of October – begin November.
Cheers,
W
Hi Peter
great cycles work on the page where you explained what you were thinking in regards to Oct 13 .
Joe
🙂
Peter,
If we were to continue down from here would it violate any EW rules?
The 5 point spike on the emini at / after the close yesterday along with the unusually strong bond market is telegraphing a move lower now. It is hard to imagine a 15 point move up in the SPX and a high / reversal all on the 13th…
No, I had mentioned that ES had done a triangle (it did a double top right at the end of the day) and that NQ had done an ending diagonal. So had YM, so I was looking at this as a possible top. I can’t count 5 down in the futures, so we’ll have to see what happens. But I would be on the alert for a retrace to 62% in the futures and a top here in cash.
Cash doesn’t look right yet, so we’ll have to see what happens in the first couple of hours.
Be careful. We still haven’t broken any technical levels, so this could also be a fourth wave and signal we’re going to finish this final wave up. All the cash indices still look like 3’s down so we still could go to a new high … but I don’t think it would be a large new high because of what the future did last night.
This looks to me like the final 5th wave of the 5th. I’m expecting double tops … we’ll see.
We appear to be morphing into a more substantial first wave down, which should look like the diagram I posted on “where to get in.” ES should drop to at least 2000, I think.
Gary,
SPX should come down to 2006 before we see a second wave bounce.
Thanks Peter!
Although the movement appears “sluggish”, it really is unfolding as expected.
Have all of the indices topped within your expectations?
Yeah, pretty much. I think they’ve all reached the larger 62% retrace, except NYSE, but I’ll have to go check that at some point. If that’s so, I’m a little up in the air as to whether this was a second wave (my preference) or a fourth.
As far as I’m concerned, though, the top is in (except that I want to see a second wave here that retraces 62% and turns down). I’m short, but with a small footprint so far.
ES has made a marginal new high
Looks more like 2nd
I elected a short after a third “kiss” of the descending trendline.
The blue fib line was within a point of perfection. The arrows confirm a short with the other indicators. So far safe and effective! I wouldn’t be surprised to see a revisit of the morning lows at the pink line.
http://www.screencast.com/t/t3x4qDYTCXB
First waves always top or bottom out at the previous fourth. So yes, that’s why I said we should bounce at SPX 2006. We appear to be in the fourth of the fifth of the first. This wave down looks like it will take the entire session to unfold. Then we likely bounce tonight in a second wave and start the third of the first tomorrow.
This wave down is the first of the first, I would think.
We have to eventually get to a new low (Aug 24) and probably much, much lower.
SPX might be forming an ending diagonal …
Peter,
do you mean the diagonal ending the fifth of the first before the bounce in the second?
Yes, or a running triangle. Either way, the outcome is the same. We should get to SPX 2006.
ES should get to 1997.
My ESZ5 chart shows the diagonal as well!
Will it chase down to the pink Fib line from this morning?
Probably… The green trend in the AO indicator (bottom) shows a rally at that point.
http://www.screencast.com/t/w8N1SEcIKNv
Yeah, I just wrote to Dmitri that the ES target should be 1997. Then the bounce.
ES also looks like it’s forming an ending diagonal.
In any event, we have very nice looking motive waves. I’m not sure what the DOW is doing, but the others look just fine to me.
SPX may have bottomed.
Hope this time there will be the second wave
Should be OK. That was a very strange ending pattern. It wasn’t an ending diagonal as the last wave was in 5. It was some sort of expanding triangle with a final fifth wave. We should bounce now into the second. Not sure about the DOW. It may need to go to a new high.
I did a quick little update to the post.
Market Expectations Of A Stock Market Crash Have Never Been Higher
http://www.zerohedge.com/news/2015-10-13/market-expectations-stock-market-crash-have-never-been-higher
http://www.thestreet.com/story/13320960/1/risk-of-a-stock-market-selloff-is-high-cboe-skew-index-shows.html?utm_content=buffer4a7b2&utm_medium=social&utm_source=twitter.com&utm_campaign=eb
SKEW jumped from 118 to 142 on Sept 14 but market still rallied the next 3 days.
Peter,
Did you read Stan Harley?
I think he is wrong the big decline has to start right here and now.
We should be in the first wave down now..
Cheers.
I did a quick read but he doesn’t substantiate anything so I didn’t pay it a lot of attention.
We’re just finishing the first of the first.
Peter, thank you. Really nice! Your cycle chart in a previous post showing top 10 cycles converging this month is amazing. Does spy still have a chance to do one last try for 203? Regards.
I count five down in SPY so it should just do a second wave. That will be the test as to whether we’ve really topped.
Liz,
I’m going to change my answer to “not sure yet.” After taking a long look at the market, I’m not 100% sure we’ve topped. We haven’t technically dropped through any important support. So, we still could have one more wave up to take us up to 203.00.
Thank you Peter.
Now I’m pretty sure SPY will see 203. It also came down in 3 waves.
I posted an update with a very small degree chart showing the count as I make it.
I updated the update from last night slightly. The futures came down a bit further and look much better now as motive waves, although something about this set up makes me nervous. However, be on guard for a turn down at either 62% of 38% (the latter into the lower half of a first wave).
The futures we unable to put together a sustained rally last night …
Peter,
I recieved 2 days for a low okt 19 but also okt 22
I hope this fits in for a big drop down.
This wave in ES should go down to 1960 at least.
Peter, we just penetrated a trendline to the upside and are at ES 1990. How far up might we go before 1960?
thx
I’m not going to be around much today, so don’t count on me … but we just broke support so this should really only be a test of that support, I think.
Peter, sorry, what support?
In ES, bottom of the first wave.
which is also previous 4th.
Thanks
The support is reintegrated
Hmmm. Yeah, just got back to my desk. Didn’t expect that. NQ has gone right back up to do a double top, so it’s in for a third wave down.
Got caught in that, but the downside will be larger..
All these waves are up in 3 so they’re coming down …
Dmitri,
ES also did a double bottom and I suspect we’re going back up to to the top and maybe further. The NYSE isn’t at 62% and I think it has to get there. I really believe we’re in a larger 2nd wave, not a 4th.
Well Dmitri,
I’m convinced we’re still targeting 2030 SPX, which is the 62% retrace level and makes this entire correction a second wave. That’s not far away. I guess it’s something like ES 2022. We’re already on the way there tonight. We could hit it tomorrow sometime, although a Wednesday top would be unusual. This wave eventually came down in 3 waves so we’re going up. This would have been the fourth wave.
Just in case you’re trading ES tonight.
Peter — what time zone are your posts?
Mountain.
I put SPX still in a first wave down. It should end around the larger previous fourth, between 1971 and 1977. We should get a large second wave bounce at that point.
I can’t quite figure out the Nasdaq but it’s likely in the same position. Tough market.
Hi Peter,
The expected top was done @ 2022 levels. Now that we are on confirmed downtrend, what is that you foresee on how far this will go down in this wave? Thanks
Vetri,
I think I just answered that in a previous post. We may have crossed posts. However, this market is not acting as impulsively as I would expect so I’m being cautious towards it. It hasn’t done anything wrong, but it’s fighting for every tick.
Well, folks …
I do not feel particularly good about this wave down. It’s down to the 62% level from the top to the fourth wave in the SPX. It just doesn’t feel right … and doesn’t look all that great, either.
I also note the DOW missed the larger 62% mark from the very top and I have a feeling that’s important. I’ll take a longer look tonight but I’d be careful with this thing. I’m thinking of getting out as we’re really not getting anywhere.
I also see a little wave of 5 waves up in the DOW on the 1 minute chart.
If the SPX does a double bottom here, that wouldn’t be a good sign.
I think the next move is up in a 3rd wave of the fifth. We’re stopping. This has ended up being a second wave as it’s come down about 62% when you measure from the previous fourth. All the indices seem to be setting up for a wave up.
In my haste to get a comment out, I said we’d go into the 3rd of the fifth. We’ve already done that. This will be the fifth of the fifth and it will likely be shallow, going to a new top but just enough to hit the higher 62% level to the market top. That would confirm the second wave rather than the 4th wave. The downside will be that much larger.
I’ll do up some charts tonight to identify that level in the major indices.
I’ve been staring for the has couple of weeks, wondering if we’d make it!
Peter, so happy for your blog. My comment—The problem I have with SPX going back up from here into a fifth of a fifth is that the timing for the current wave down was just too perfect to be an older wave unfinished. It came at the moment of so many astro signatures—New Moon, Mercury station, a quadruple declination parallel of Sun-Moon-Venus- Mars. You yourself had picked out the 13th for a cycle top and in fact we topped on the 13th! Big pat on the back for you, and don’t second guess it (unless of course it turns out to be right :>))! )
comparing SPX 5 min chart to the Wave 1 template, it could be that the morning low today at 1993 was only the first i of Wave 1 and the next 2006 high was ii-2. If so, wave 1 is just getting started…………..?
That would be nice but the wave structure is already overlapping and once that happens, you can only change it with a very much longer wave. But then that reduces the size of the second wave to almost nothing and creates yet another problem. There are too many EW signs, I’m afraid: Double bottoms, overlapping waves, no momentum, top that’s a spike, and some other more technical issues.
Thanks for this comment, whitemare …
Well, ultimately, I have to follow what the waves are telling me … haha. I was also uncomfortable with this wave right from the start, as you well know if you read the blog. We topped early – I was quite surprised at the time. Plus, there’s a big gaping hole in the charts between where we topped and the 62% retrace level, but I kept thinking, “Well, let’s see where this goes …”
I wasn’t close to the markets mid morning but when I got back, it was obvious things weren’t as expected … and then it got worse as the day progressed. Finally, near the close, the signs were all there. ES is already starting to show signs of bouncing tonight.
When you see the measurements (when I post the charts), I think you’ll agree that it’s obvious where we’re going. I have a mentor who always said to me, “The market will do the most obvious thing in the most un-obvious way.” (and he wasn’t a EW guy) It’s really true.
In terms of the timing, I agree, but cycles aren’t that accurate … they can be a few days out.
We only have one final wave up to do, which will take us maybe two days at most to complete. The turn down should be obvious in the wave structure and momentum. Today wasn’t “it.” The wave structure is not motive. Waves are now overlapping.
Let me correct an earlier post. This is a very deep fourth wave down (“deep” is typical when we’re right near a top). That means we have one more wave up to go. It may or may not be full length. Often, they get shorter as they reach the target (as happened at the top of the market). Ultimately, I think we’re going to the 62% level.
If correct, that means is that waves 3,4,5 will drop several thousand points in the DOW. It will be one heck of a wakeup call!
New post: https://worldcyclesinstitute.com/on-the-hunt/