
The hunt for this elusive top continues! It might seem frustrating at times (I think so!) but the reward at the end will be worth the wait.
I was not feeling comfortable with where we topped and, in fact, was surprised. We’d had a very shallow 4th wave and then a small top, which I thought was a final, somewhat truncated fifth. In retrospect, it wasn’t. It was the end of the third wave of the fifth wave up. Today we had the real fourth wave down and so we have one more wave to go up to the top.
Tonight in the futures, we’re already well on our way. So I would expect to see the top this week.
I had mentioned a number of indictors pointing to a top on October 13.
- a strong cycles analysis (below) that shows a definitive cycles top
- the Puetz TPD crash window focusing on the October 13 new Moon
- the market itself, which appears to be finishing wave 5 of 5 of a regular flat
- the upward movement of gold, which typically suggests a “flight to safety”
They’re all still valid. In fact, cycles aren’t as accurate as a specific day, but they’re usually not more than a few days off. That’s because cycles can slide slightly over time and we’re analyzing 13 years of past data.
In today’s post, I’ll look at what happened today and where the market went wrong. I’ll use the SP500 as an example. And then I want to go through the major indices and show the big picture. Because they’ll all in the same boat; they’ve all done a fourth wave and have a final gap to fill to the 62% line.
As we approach the top of this correction, I often get asked where the best place to enter is. Here is a brief explanation of what to expect and the safest point at which to enter a short trade after a first wave down.
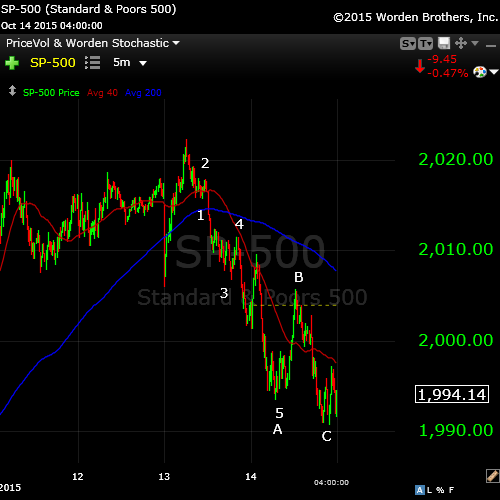
Here’s a 5 minute chart of the SP500 from today. We came down in 5 waves yesterday, except the second wave was somewhat muted and was making me uncomfortable. Then today, we headed up in a B wave (really unexpected) and then headed down in a C wave.
So what looked fairly good yesterday, all came apart today. We’ve ended up with 3 waves down. At the end of the day, we were obviously forming a double bottom and all the momentum was gone. In fact, there wasn’t much momentum at all today, something I commented on about midway through the day. The waves just didn’t “feel right” or “look right.”
So … three waves down means we completely retrace. We head back to the top.

The 2 hour chart of the SP500 (above) shows the big picture. It’s very much like the chart from two days ago, except for the fact that we now have a fourth wave. This fourth is a subwave (the fourth of the fifth of the C wave). I haven’t labelled all the other subwaves due to the lack of space.
I’ve placed the 62% retrace line (from the market top) on the chart. I was surprised when we didn’t hit it. But a mentor of mine once said:
“The market will do the obvious thing in the most un-obvious way.”
It’s one of the truisms of the market that I tend to repeat out loud when days like today happen. It’s obvious to me that we’re going to trace out a large second wave. All the indices are very close. So the target for the SP500 is about 2030, as it was two days ago. We could go a bit higher, but we need to reach that objective.
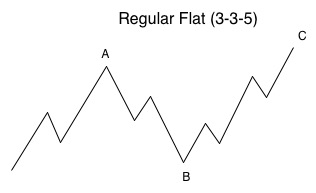
Here’s the explanation of the correction we’re forming on almost all the indices: a regular flat.
Based upon my scenario of an ABC down wave from last week and an “ending wave” up, here’s what remains of the path. The wavelengths in this final C leg up are textbook.
Wave 3 is 1.6 times the length of wave 1. In the final 5th wave, wave iii is 1.6 times wave 1. If wave v traces out the typical full length (1.6 x wave i), it should top at 2052. I have placed a line at the 62% line, which is another typical stopping point (2030). So, somewhere in between 2030 and 2052, the market should turn down.
I measure the ES top at about 2022 (roughly).
Any flat correction is in a 3-3-5 pattern. In this case, the B wave would have been the ABC wave down from last week. The A wave would be the pattern from Aug 24 up to the high.
In a regular flat correction, “wave B terminates about at the end or about at the level of the beginning of wave A, and wave C terminates a slight bit past the end of wave A.” If we complete a flat that goes to a slight new high, then this would have to be a larger 2nd wave and the downside will be much greater than a 5th wave. For example, the third wave alone would take us down to the low 1600s in the SPX. We would have a 5th wave after that.
___________________________
If it Quacks Like a Duck …
If all the indices reach 62%, I would be inclined to label this correction wave 2, which means the drop in wave 3 to come is very much greater that if this correction was wave four.
Let’s look at the overall market to get a sense of where we’re at in the larger time frame.
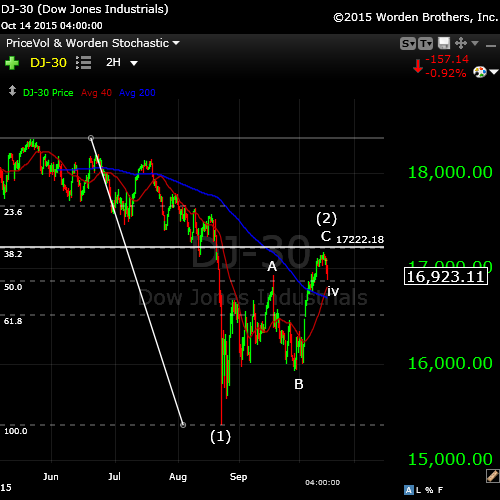
Above is a 2 day chart of the DOW. I’ve overlain a fibonacci retracement tool to give an indication of our target for the final fifth wave. The horizontal line marks the 62% retrace objective.

The Nasdaq now looks the same as the other indices. This final leg up should extend to reach the previous spike top at 4960.87. I haven’t drawn in the 62% retrace line as we’ve already exceeded it. The horizontal line marks the previous top, which I expect we’ll test before turning down.
If we only need to get to the 62% mark, it’s at about 4875.
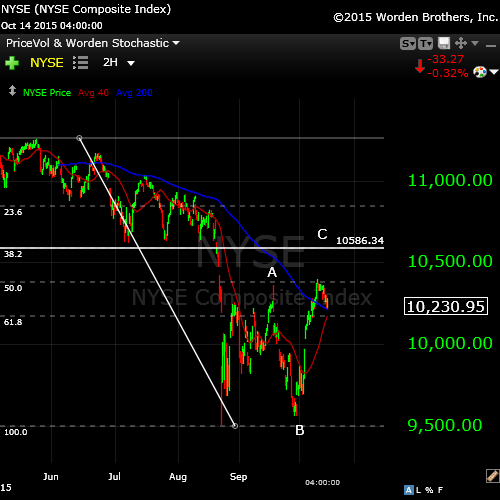
Even the NYSE (above) is stretching itself to make the 62% retracement level (horizontal line).
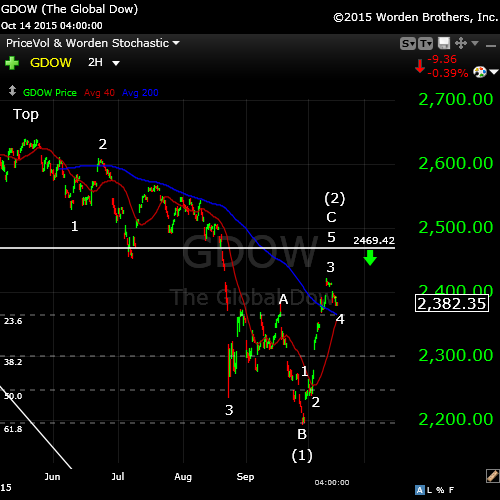
The Global DOW (GDOW) has retraced up to the same relative spot as the US indices. I’m expecting it, too to rally to the 62% line to trace out a 2nd wave before a turn down in a 3rd wave. This would fit with the prognosis in the US markets and reinforce my count there as a second wave retrace.

Gold (GLD) above continues the rally. On a larger scale, I expect GLD to retrace to the 62% level, which is at about 153.00. It has a long way to go. You can see here that we’ve completed a first wave up in 5 waves, have retraced in an ABC pattern and are entering the 3rd of 3rd wave up (after completing waves 1 and 2 of 3).
_________________________
Cycles Analysis
I ran this chart Friday after the market close (Oct 9). I’m showing a cycle top now on Tuesday, Oct. 13, 2015.
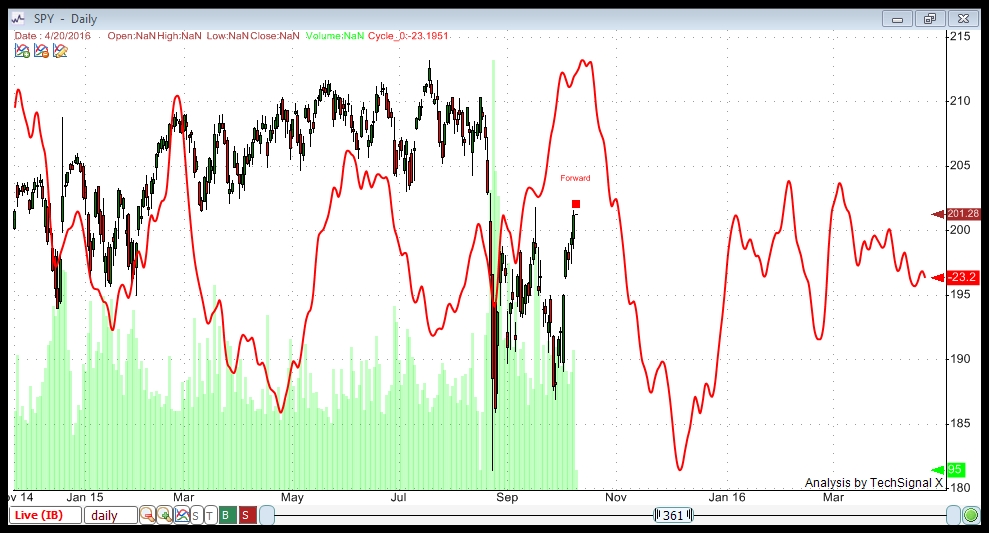
This cycles analysis uses Techsignal X from the Foundation for the Study of Cycles. I’m using data going back to 2002 this analysis of SPY (SPX) and displaying a compilation of all the cycles the software has found over that period. You can see how close-fitting it has been in the recent past. The fit with the current wave is quite stunning and therefore, something to pay attention to.
This analysis suggests a top to the current wave on October 13 (starting down on the 14). Oct 13 is also the new moon.
It shows a bottom to this set of waves down at December 7, 2015.
This particular cycle top (Oct 13) is a strong one. I’ve gone a little deeper into what the analysis is telling me on a separate page. Here’s a more in-depth explanation of what this chart is suggesting.
_______________________________
The Panic Phase and the TPD (Turning Point Distribution) Principle
The TPD Principle describes a period in time of several weeks in which an array of cycles congregate, including gravitational, geomagnetic, and nuclear. It’s around this time that markets have historically topped. I was asked to include a reference to this in today’s blog post, which I’m happy to do. This principle generally refers to market tops (which we’ve already seen on May 20, 2015), but it’s interesting to note how many astro events we have occurring over the weeks surrounding the upcoming major turn in the market.
In his book, “the Universal Cycle Theory,” Stephen Puetz writes, “The TPD principle involves the eclipse cycle as well. The eclipse cycle normally peaks on the first new moon before a solar eclipse. Following that reversal point, it takes six weeks for sentiment to shift from euphoria to panic. Then on the first full moon after a solar eclipse, a panic-phase begins. A panic phase usually last two weeks—ending at the time of the next new moon.”
The dates:
Aug 14 , 2015 – First New Moon before the Eclipse (there is a New Moon happening at the same time as an Eclipse—Sept. 13)
***Aug 29 – Full Moon before the Solar Eclipse (peak of the eclipse cycle)
Sept 13, 2015 – New Moon and Partial Solar Eclipse
Sept 23, 2015 – Fall Equinox
***Sept 28, 2015 – Super Blood Moon Eclipse (start of panic phase)
***Oct 13, 2015 – New Moon (this would mark the end of the panic phase) – six weeks after the Aug. 29 full moon.
So … there’s a lot happening in the area of cycles right around now. The week of Oct 13 looks important to a possible major market turn.


Dear Peter,
Thank you for your great effort and perseverance on the waves.
From my count we will finally end up giving back 62% of the gains from 667 to 1234 which is about ~1200-1300 on S&P.
May I have your comment and this number when the full 5 waves are done?
Vince
Vincent,
I was going projections last night. If wave 3 and 5 are both 1.618 X wave one and 4 retraces 38%, I’m projecting 1074 SPX approximately.
Thanks , that’s clear….n
Peter,
Your analysis is correct. But 10/17 is a powerfull date adn I think the market wants to test it. The decline will start next week; after expiration.
Thanks, André
Very good blog Peter
Sorry for my English, I am spanish. From my perspective astrological beginner, the next Saturday Moon-Saturn square Venus-Júpiter.
Thank you all for your comments Peter, André, whitemare, Nicola, dimitri, John, dave, Gary…
Thanks, Gomi.
Futures completed a full first wave up last night so we’re poised to head into a third wave. We might have a larger second wave drop or what we have now may be good enough. Overall, looks like it will be a very positive day.
Sold out of longs from yesterday. Layering the shorts for a cycle low tomorrow. Good Luck.
Bought UVXY 32.78 at the close. I believe it will be min 30 point down day tomorrow.
Peter,
I like the title of your blog, “On the Hunt”. I’d like to add for “for Red October.”
YES! That’s what I should have called it!!! I think I’ll go change it …. haha. Thanks, Liz!
Nice. 🙂 Strike 200 has the third highest PUT open interest and second highest for the CALL tomorrow. So it’ll be a quite frustrating hunt if spy pins 200.
I have us just finishing wave two of 5 up. We should head into 3 now and it should go more or less straight up. It it completes today, I could see tonight finishing up the 4th and 5th …
Believe it or not I was thinking about the movie last week ..so maybe it will indeed surprise us..
Is this wave 3 now or wave 5???
Wave 3 of 5 of C.
My compliments Peter,
Amazing how you nail those waves..
Today is also a possible mercury turn but it also could be the low yesterday so maybe we go to the next Oktober 20-22 if that’s the case Stan could be right…
What are your thoughts?
Dunno. We may top before the weekend. I think 20/21 is too far away.
This wave is heading up quite quickly. Wave 3 in SPX if it extends to full length should go to 2025. We will likely have a deep retrace after that.
But I can never be sure of wavelength when we get to the last wave. Sometimes they become shorter towards the end.
In conventional charting head and shoulders tops MUST have a distinctive volume pattern. A big volume breakdown from a neckline and then a rally back under deceasing volume. Does this make the current rally a wave two???
Roger,
I don’t consider this a head and shoulders pattern. But I do consider it wave 2, as per my most recent post.
Hi Peter,
Do you say that recent high of 2022 will be taken out and then rally anything upto 2054. An fall expected only post that?
Vetri,
I don’t know what index you’re referring to.
Peter,
Have I ever told you in public you are my hero? Damn yes I did and I will say it again because I think you will be right, you are my hero! 🙂 I am in puts since Friday 9 October (XNL NOV 390 = AEX Index puts). And I will keep them till about the end of October/begin of November.
Cheers Peet,
W
Haha … yeah, I think you already told. Not much further to go …
My Apologize.
I was stating S&P 500.
I’m pretty sure I put the numbers in my post. If they’re not there, let me know and I’ll go look for my notes.
In SPX, the C wave up (wave 3) has now gone past A=C, so this bodes well for it going to 1.6 X wave A, which would bolster the idea that this is wave 3 of 5 and that we have 4 and 5 up still to go.
Just be on guard from here on in for anything that suspiciously looks like a top.
I would think it’s too late today for a top, but I’d give anytime from tomorrow morning on a good chance. I’ll be up early to post a note based on what futures did overnight.
The fourth wave retrace, when it comes, may be deep. That may delay a top until Monday. We’ll just have to watch and see how this thing plays out, but I’m expecting a fourth and fifth wave of this fifth that we’re in.
What are the chances of the dreaded triple top at SPX 2020 which we are just a tick away from?
Not very good. An ending wave must be in five waves and so far in SPX, we’re in three waves, unless we came down in a fourth now and then went up to a top.
But I put 1.6 X wave one at 2025, so we may do a large retrace there. We should certainly do a retrace of some size (wave 4) in order to set up for wave 5 of 5.
This is interesting. The ES is at 2014.
It was here as a high on 9/17, 10/09, 10/13, and right now!
10/15 @ 3:03 EDT
I put the top of 3 in ES at about 2018.
Peter,
The yellow arrow shows where you said we should head straight up from here!
That was the post at 10:03 your time. Great call!
In the attached chart that is in contracts, can you count waves?
http://www.screencast.com/t/Q54WcLUlRg
Thanks. Not sure exactly what you’re asking me.
It looks like the same setup as the market—close to the top of a wave 3 … if that’s what you’re asking …
The chart is set up in contracts traded (top left). Each bar is 5,000 contracts as opposed to a standard chart that is set up in timeframes. I am interested as to whether you can count the waves the same way. If you look along the bottom, you will see the timeframes that tick off as the trading progresses through the day. Sometimes 5,000 contracts trade very fast and other times it takes a while. The way I have it set up, the WCCI, Aroon, and AO all give very reliable indications of a change in trend w/o suffering a drawdown. If the chart is set to 5 minutes, 15 minutes, etc. the indicators are worthless! It took a while to figure out that 5,000 contracts was the magic number. It isn’t as effective on 4,000 or 6,000. It’s an art / science!! Like EW : )
Yup. Can certainly count the waves. That’s why I said it looks the same as the ES (wasn’t sure what you meant): At the top of the third. We should come down to 2006 tonight at least.
Thanks! I have an original edition “Elliott Wave Principle”. I need to dust it off and get busy!! Is there a recommended software package that will paint the waves real time? I’ve seen a few in the past but the wave counts usually change or fail. There needs to be an algorithm that is doing the same kind of on the fly interpretation you are doing. As we all know very few people can decipher the counts reliably like you are doing. I am a decent golfer. Can’t go on tour though ~~~
Yeah, well don’t start talking to me about golf and ruin my day … haha.
I’m impressed with Motive Wave, but I haven’t bought it. I may do. It would help me posting charts.
It’s not perfect, though. I don’t think anything can be. There are lots of times when a count could go either way. There are other times where the problem is so subtle that only a human is going to see it. And there are still other times where I look at other indices or sectors to see what they’re doing for a clue to what’s really going on.
It’s taken a long time and many, many hours of watching charts to get to this level and there are still times where I simply don’t know what’s going on until I see more of what unfolds.
Hi Peter
Great Call of this afternoon … Well Done .
Is there any chance that the TOP is in after this big move of today ?
Or you still feel that we need to have 4 & 5 ?
Regards
AZ
AZ,
We still need 4 and 5. As I said to someone else, three waves is not an ending wave. It has to be in 5.
We’re also so close to 62% and making this a wave two that experience tells me we’re going there …
I was just thinking this through as to timing. I think we’re talking Monday.
Wave 4 has to come down tonight and the bottom has to register in the cash indices. So that means we open tomorrow down and then likely take Friday and Sunday to complete wave 5, making Monday an opening gap reversal … or a continuation in the morning for a bit.
Speculation … but that’s what should happen … timing may change.
China GDP on Sunday evening
Hi Peter
Thank you for your reply
One more question please .
Is it possible for W2 to reach say 2112 level ( around 20 points below May high ) on SPX , or that is not possible .
Regards
AZ
What’s W2?
Peter
Sorry I mean Wave 2 or as you label ( 2 ) or C or 5
Regards
AZ
Oh … wave 2, I just figured it out. Wave 5 is typically 1.6 times wave 1, or the same length as wave 3, so the limit (with a 38% retrace for wave 4) should be 2040, based on what we did today.
OK Thank
Regards
AZ
Let me just add to that number that it’s based on a regular 5th wave. We could also get an ending diagonal, which could extend it. I don’t think we could get to your number, but I’ve seen some fairly weird stuff at the end of 2nd waves … so I certainly can’t guarantee it.
I’ll know more once I can see the structure of the final wave.
Peter great prognosticating… Tomorrow the Sun is at the last degree of Virgo in the sidereal zodiac; the sign change into its debilitation in Libra –Friday night– usually brings weakness so maybe the wave 5 will be done before the weekend.
Peter,could this wave 3 be extending up much further ? ES afterhours had been fluctuating between 2017 and 2019 until 16:32 your time (mountain) , but then in a 7 minute period it shot up as high as 2023 . You analyze the waves excellently ! I figure above ~2019 it is higher than 1.62 x wave 1. Many thanks !
Charlie,
A little disconcerting …
I don’t think it’s going any further. It looks like a small fifth wave of the third. It needs to correct, but I expect it will take all night to do so. It should drop 38% of the distance from 1982.
IMO, the ES will retrace to ~2008
See the link below.
Look at the yellow arrows in the lower pane pointing to the blue spikes.
The AO at the bottom is confirming the RS weakness to follow the rise.
We should drop to the green dashed line (arrow there) representing a 38% decline from the 2023 top.
http://www.screencast.com/t/NiKwYfcVoE6A
You’re right, 2008, or lower, but not into the area of the first wave.
For the ES, there is a gap on Aug. 20 close 2024.75 that is begging to be filled. Aug. 21 high is 2022.25. It is now 2019.5. That is just a few points away.
SPY Aug. 21 high is 203.94. Aug. 20 high is 208. Do we go there? I have no idea but it’s difficult to be long after the weekend.
We need a 4/5 up but they could be any length. They should be the same length as the third wave you just experienced, if they go to full length and that should be easy for you to measure. However, it’s the final wave and could end up short.
Peter,
Do you have an opinion on how the wave structure / behavior acts on an option expiration? There is no doubt the markets act a bit crazy on expiration days. It is strange that we didn’t get much of a pullback overnight.
Tonight isn’t over. We need to at least get to 2012 in ES (fib extension off the first wave down) and it needs to do a fourth and fifth wave in the correction. Plus the cash markets have to come down.
Expiration won’t affect the waves technically. You might get a movement within an overall structure but it won’t actually change it so it doesn’t conform to whatever it taking place anyway.
Look at this chart of the last 7 option expiration’s.
http://www.zerohedge.com/news/2015-10-15/what-happens-next-hint-nothing-good
This is akin to the discussion I have with people on events. Events happen due to human mood and don’t affect the market to any great degree. In other words, the mood was already such that the event happened as a result. Mood also moves the market. So the market gets to points where something could change the direction, but it’s always somewhere like a correction … a 2nd or 4th wave.
The market still goes on and does its EW thing no matter what … because it’s based on human mood, the bigger picture (but I won’t start down the path as to what controls human mood – haha – I have a video, Puppets on a String, that does that).
Gary,
Watch out take a good look July 17 was not a top for example it happend monday July 21.
We still need to see the wave 4 down and last 5 up according Peter.
Nothing happend over night so maybe today what do you think Peter how is your red oktober still full of air or already leaking?
Still on track. You’re right, we need a fourth here in cash.
Hmmm. Let’s see what happens here. SPX didn’t quite hit the target, and DOW might have, but I don’t think we’ve seen a proper fourth …
Fascinating that we are at your previous targets of Dow 17222 and SPX 2031.
Too bad the wave count doesn’t match with the 5 of 5 top!
Trading … the place where you get to practice EXTREME patience …. haha.
It happens way more often than I can count that the market misses a target by a few ticks and then does a deep fourth wave and comes back and hits it. We’ll see what happens here.
And I should have added to that … “and then turns down” (after it hits of slightly exceeds the target).
Here’s something you can do to get a length for a correction. If you take a fib extension tool and you measure the first wave down, you’ll find that entire correction will go to the 1.61 or 2.61 level, which usually corresponds with the previous fourth wave or the 38% retracement of the entire wave up.
So, if you take ES, I measure from 2023.75 (the new top) to 2017.75. The extension at 2.61 comes in at 2008, which is also the measurement of the 38% level measuring from the bottom of the larger full set of waves (from 1982 or so to the same top).
Sorry … if you already knew this. (I use this measurement all the time).
No happy to read this…
I’m seeing fourth wave triangles setting up everywhere, so we likely won’t go any lower. This is forecasting a top not very far away.
Peter,
Remember the graphic of the Sun- Jupiter cycle you placed on this site..
With the first wave down Sept 4.
Looking closer it goes up till half or third week Oktober and drops again in direction half November if it plays out the same way like 2014 the next drop must be bigger than the one we have had on August 24.
And we should be close now…
So we have to be verry carefull at this point.
http://time-price-research-astrofin.blogspot.nl/2015/08/spx-vs-sun-conjunct-jup.html
Peter, not sure how you are getting that latest measurement…..2023.75 to the next little low at 8:25 MT is to 2015.25 not 2017.75. Then doing a 1.61 fib expansion of that leads down to 2001.5 Oh you must be expanding from the top of the little retrace, I see. Gives 2007.7……..
by the way the Sankranti, change of Sun sign to sidereal Lib, which is statistically significant for trend pivots, is not till Sunday morning, so I misspoke and probably its effect won’t come till Monday.
The first low I consider to be after three down and before a second wave retracement. The second wave must be around 62%. That marks a first wave. And then correct … I get something like 2007.97.
Monday is likely, I think, based on the distance left to go. This correction is likely going to take all day. The last wave up may not be very large. We’re very close to the final targets.
Very likely to consolidate today all the day in the 4th. Nobody wants to take a risk before the WE. A lot of important chineese stats (GDP, Ind.prod., Sails etc) Sunday evening. The stats may provoke the last spike of the 5th. Depends on how they’ll be interpreted.
We could also be setting up a final triangle, which means the top is at hand. Triangles in fourth wave positions forecast the end of the wave with one more small wave up.
That would be perfect to make the top today.
That would mean shallow 4th and smaller the 5th.
Is it possible to suppose the target of the 5th based on the triangle?
Yes, but the triangle will likely slowly form and take the rest of today, leaving a fifth wave up for Sunday. I don’t see this thing ending all that quickly.
I just posted a new chart at the top of the post.
So much for the triangle. Looks like that’s not happening … Back to the drawing board. Still a fourth wave, though.
It looks to me like me may still end up with a triangle, just not the one I thought we were going to get. One more leg down would likely finish off the fourth wave.
We must be morphing into the final wave up … However, the correction doesn’t seem complete and yet we’ve headed to a new high. It also could be an expanding triangle. We’ll have to see what happens from here. Very strange formation … so far.
It’s also possible for me to count 5 waves up in this final wave in the SPX. We’d be in the very last small subwave and we’re right near the target of 2030 or so.
Well, you got your wish, although it was really difficult to figure out the ending pattern. ES did a perfect expanding ending diagonal. They’re rare but a valid pattern. NQ and YM did the same thing.
I hate to play the “gut feeling” card. But, it really feels like a weekend to hold a short position over. I rarely hold ANY ES shorts or longs over weekends….
These are all three wave moves, so we have to retrace. We still have a fifth wave up to go. One way or the other, the top has to register in the cash markets on Monday.
I don’t have a reason now why this wouldn’t be the top.
There are three more points on SPX to close the Gap( 2035 – 2035 ) , which I think will be done Sunday / Monday , and then we could have the TOP in.
I agree. I just wrote another comment on that. I think we’re all but done.
Ending diagonals are all in three waves. That’s why this final leg up in futures is a wave in 3. We may see futures come down on Sunday and then up to a double top for Monday morning and then the entire shooting match keel over.
Peter,
If this is in sync with 2014 and the Sun /Jup cycle
Sept 19 ( opex) we had the top and the bottom Okt 15. ( second down Jup..)
So now Okt 16 (opex) bottom mid Nov?
Technically, you’d like have to list the top as Oct 19 because I think we have a few more ticks in SPX to do in the morning. I’ll another cycles run and figure out targets on the weekend for the downside. All the major indices made the 62% mark or just a little higher. NYSE didn’t so I’m not sure how that affects the overall picture. But I’d put us at the top of a second wave. That means a huge drop. I posted some numbers here yesterday, I think that would be fairly accurate.
Looks like everything is putting in double tops at the target and SPX is filling a final gap. Futures look like they’re completing expanding ending diagonals.
Looking forward to Peter’s new cycle run. My system says that from Monday on we start a serious decline. Retraces won’t come near the ath anymore. In November an acceleration down into a first low by the end of January 2016.
Would be nice when the new cycle run shifts the december low it gave before into January.
Cheers,
André
I’ll try to get one done tonight. The prettiest top in the US is the Russell 3000 index. Really nice double top with an ending wave in 5. But yes, we’ve topped. Down on Monday!
New post: https://worldcyclesinstitute.com/the-cycles-turn-down/