
It Won’t Be a Quiet Holiday!
Volatility will continue through the holidays, as we’re tracing out large ending diagonals as the final pattern to the downside in the major the US indices. You can never be certain that we have an ending diagonal until the fourth wave is in place, so we need to have some CAUTION here until we get a fourth wave up in place and a turn down. But the truth is, I have no other options left in the EW Christmas stocking.
So, a fourth wave bounce is in store. Then, bombs away … because I expect a drop in three waves to a final bottom around the 2330 area, which will complete the year-long corrective fourth wave — an unusual Christmas present from Santa!
One more wave up after that to a new high and the end of the 500 year cycle, as I’ve been saying for several years now.
An Update on the NYSE (New York Stock Exchange)
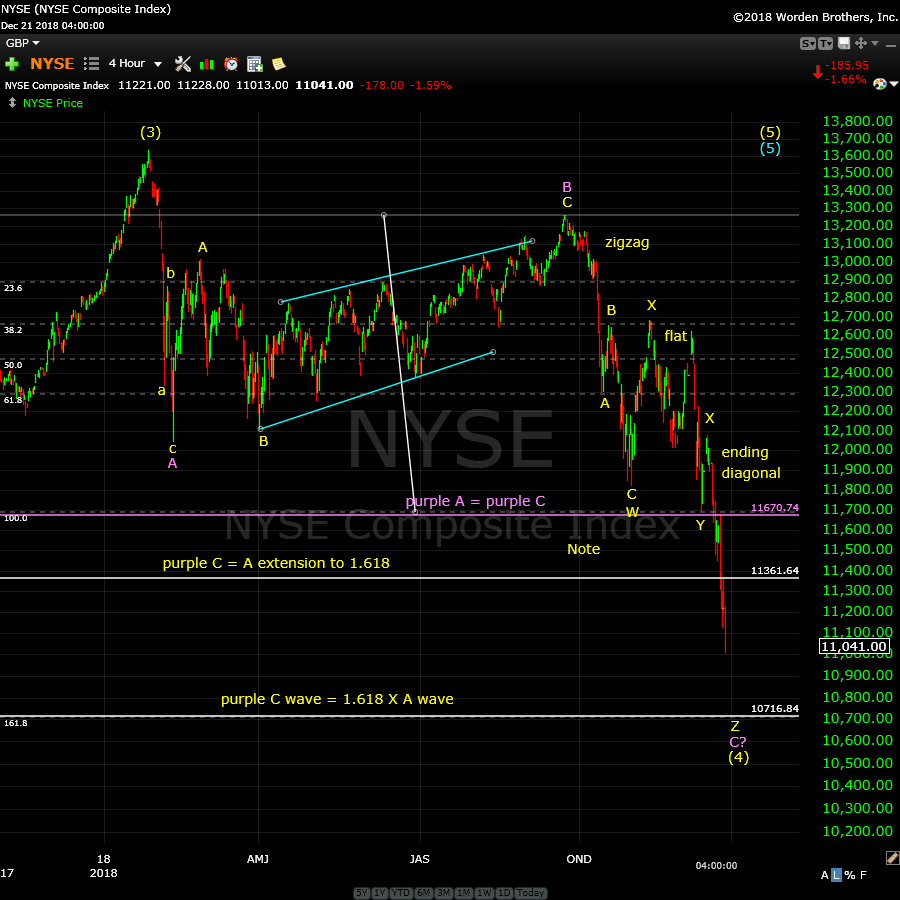
Above is the 4 hour chart of the NYSE (New York Stock Exchange). You can click to enlarge, as with all of my charts. I always look to it for a clear big picture look. It usually provides one, devoid of the animal spirits of traders.
What you’re looking at is an ABC correction off the top of the third wave. If you back out the chart to a weekly, you’ll see what amounts to an extremely large fourth wave plateau at the top of a rally wave from 2009. That’s a corrective formation, which is what I’ve been saying for a number of years now.
The Nasdaq indices are in impulsive patterns, the NYSE sub-indices (SPX, Russells, OES, etc.) are in corrective patterns, which makes them weaker (much more bearish, if you like). That means we’re going to see more downside in them in this fourth wave relative to the Nasdaq.
In any event, they all have one more wave up to a new all-time high once we complete this fourth wave.
The target for the bottom of the fourth wave appears to be ~10,716, which would mean we’d have a C wave down that is 1.618 X the A wave down, a typical fibonacci relationship in an ABC fourth wave.
I’ve labelled the sub-patterns of the combination pattern that’s played out in the normal WXYZ manner, which simply delineates the different sub-patterns. We have first of all, an ABC rally to the area slightly below 13,300. Then I count a zigzag down, then a regular flat, and now an ending diagonal.
The ending diagonal is not complete, but should be before the end of the year. Then expect a trend change to a very large fifth wave to a new high. We’re very likely to see this trend change across all asset classes internationally.
An Update on the US Dollar Index
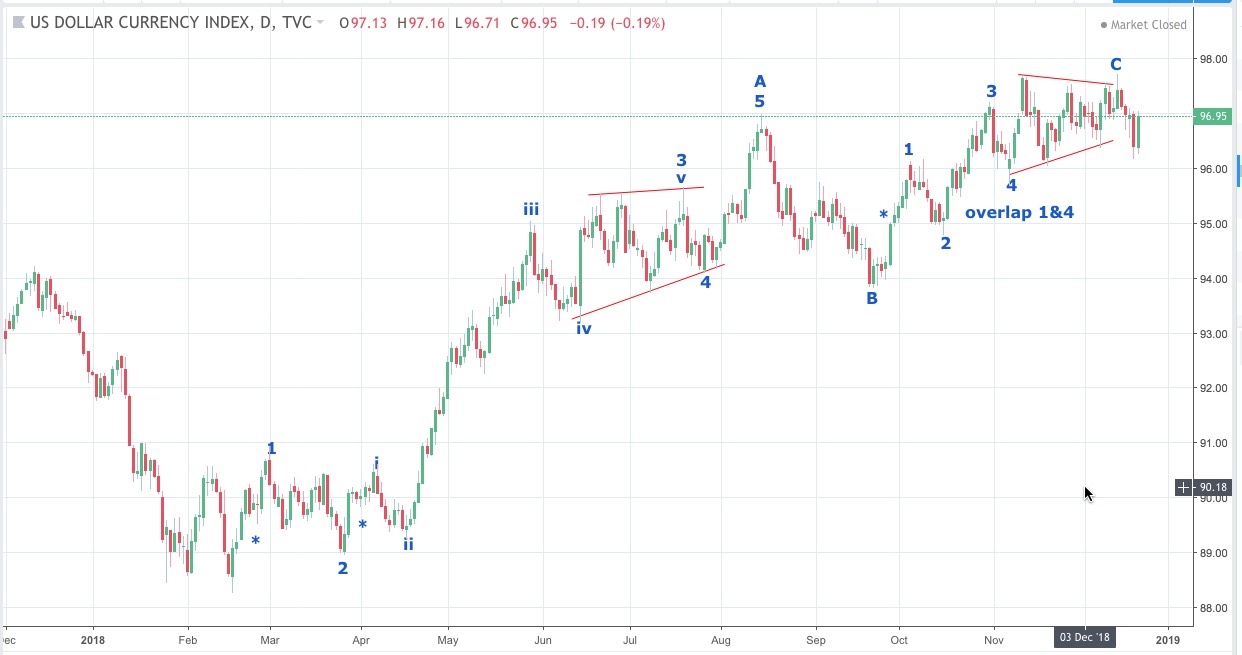
Above is the daily chart of the US Dollar Index. I usually use the chart of UUP (for ease of access) to do my dollar index analysis, but there are subtle differences, so I thought I’d summarize “the real thing” this weekend.
The US dollar index has all but topped. We’ve recently completed a small ending diagonal and it looks like we’re going to test the top one more time during the next couple of weeks.
The wave up is corrective (and there are a couple of ways to count it). I’ve chosen what seem the most likely, a zigzag pattern. In any event, the pattern is corrective. There are additional clues, which are denoted by the asterisks, which identify 3-wave patters within the larger wave.
The bottom line is that I’m expecting a complete retrace of the dollar right back down to the 89.50 area. I expect this wave will trace out as the US indices finish up the fifth wave to a new high and end the 500 year rally.
It’s all falling into place rather well, even though I’ve certainly had my share of detractors, along the way.
____________________________
It Takes a Village to Make an Idiot
We’ll blame it on this cycle top, which tends to make everyone a bit whacko. I get my share of idiotic emails, mostly due to the work of Bob Prechter’s group and other EW analysts who haven’t done their homework. They’ve sullied the reputation of Mr. Elliott.
While The Elliott Wave Principle book is a great starting education into EW Theory, it’s rife with errors. As a result, the barrier to really terrible analysis is very low. I realize I have an uphill battle.
On Friday, I got a rather ignorant email from someone who’s been trying to bait me for a long time. He tried again, but picked the wrong day and the wrong guy. He seems to be harbouring a deep animosity towards Prechter’s group, which he hoped to transfer to me.
It had to do with last week’s “Caution to the Bears” free blog post. He thought it should have been “Caution to the Bulls.” He criticized me for being wrong, and having a similar response to Prechter (he obviously meant his group, cause Bob himself doesn’t analyze the market).
My reply:
Firstly, if you’re a bull, you shouldn’t even be in this market! What’s that about? The caution to the bulls was in mid September as the SP500 reached the top of the B wave. It’s been down, as I predicted, since then.
Last Friday, we were sitting with a corrective wave to the downside, a wave in three waves. The most basic concept of the Elliott Wave principle is that corrective waves retrace. Waves in 5 waves also retrace, but they retrace partially. The wave we were in was “advanced” in length and so either way (and with the Federal Reserve meeting on Wednesday), I was expecting a retrace, partial at the least.
Therefore, EW methodology requires caution and since the market is extremely bearish, an expected retrace would be a caution to the bears … duh!
The wave eventually traced out a zigzag, which is corrective, but also partially retraces. So, I was right in my call: Caution if you’re bearish that week. But, of course the larger direction is down, as it has been since September. So, you could call me wrong on the size of the bounce I cautioned about … but not the structure of the wave that was the basis of the call.
Trade what you see, not what you think.
If you were a member of the Trader’s Gold group, you’d know that I was also expecting a drop within hours of the Federal Reserve announcement on Wednesday (and I said we could possibly see one immediately after the announcement, which we got). ES/SP500 had retraced to the minimum level that I’d identified (38%).
Then there was the email this week from someone thinking I would be interested in viewing the work of Glenn Neely of Neowave (who doesn’t even practice Elliott Wave – he’s developed his own unintelligible (imho) system). The underlying message was obviously that I don’t know what I’m talking about.
So, for all the wonderfully idiotic recent emails (there were more) and comments of the pre-Christmas season, here are some thoughts:
- The daily chart in the free blog is not for trading – you’re crazy if you think so. It’s a snapshot of the market and predicts market direction. I’m now titling it, “Snapshot”
- The daily chart I provide in the free blog is a tiny example of the work I do daily across several asset classes, lifted from the larger work (you’d get a full sense of what I really do with a $19 investment in the weekly Chart Show)
- I don’t look at other people’s charts or commentary. Doing EW analysis requires that I remain totally objective, and keep the noise to an absolute minimum (also why I don’t read many comments in the free blog).
- I don’t need other people’s opinions on the market. I’m happy with my own, thanks.
- If you’re going to criticize me for my counts, my work, or anything else, you’d better have done your homework and know at least as much as I do. I have no time for baseless opinion, and will react accordingly.
- I welcome articles sent to me on all the other aspects of the coming collapse (real estate, climate, pandemics, etc.)
If you don’t like my work, I’d suggest you use only your mouse (not your keyboard and email), and go elsewhere. You’ll be happier for it (and I’d have less “noise” … lol).
My New Year’s hope is for fewer idiotic emails, but I’m not naive. Happy Holidays!
_________________________
Elliott Wave Basics
There are two types of Elliott wave patterns:
- Motive (or impulsive waves) which are “trend” waves.
- Corrective waves, which are “counter trend” waves.
Motive (impulsive) waves contain five distinct waves that move the market forward in a trend. Countertrend waves are in 3 waves and simply correct the trend.
All these patterns move at what we call multiple degrees of trend (in other words, the market is fractal, meaning there are smaller series of waves that move in the same patterns within the larger patterns). The keys to analyzing Elliott waves is being able to recognize the patterns and the “degree” of trend (or countertrend) that you’re working within.
Impulsive (motive) waves move in very distinct and reliable patterns of five waves. Subwaves of motive waves measure out to specific lengths (fibonacci ratios) very accurately. Motive waves are the easiest waves to trade. You find them in a trending market.
Waves 1, 3, and 5 of a motive wave pattern each contain 5 impulsive subwaves. Waves 2 and 4 are countertrend waves and move in 3 waves.
Countertrend waves move in 3 waves and always retrace to their start eventually. Countertrend (corrective waves) are typically in patterns — for example, a triangle, flat, or zigzag. Waves within those patterns can be difficult to predict, but the patterns themselves are very predictable.
Trend waves move in 5 waves and partially retrace. The difference in these waves is not covered in “The Elliott Wave Principle” book. There are two types:
- Simple 5 wavers are found in zigzags, flats, and other nondescript corrective patterns. They have 5 waves, and sometimes the third wave has a recognizable 5 wave pattern, but most of the time, they don’t.
- Impulsive waves require each of waves 1, 3, and 5 to have recognizable 5 wave patterns in their subwaves
Fibonacci ratios run all through the market. They determine the lengths of waves and provide entry and exit points. These measurements are really accurate in trending markets, but more difficult to identify in corrective markets (we’ve been in a corrective market in all the asset classes I cover since 2009).
To use Elliott wave analysis accurately, you must be able to recognize the difference between a trend wave (motive) and a countertrend wave (corrective). There’s very much more to proper Elliott wave analysis, but this gives you the basics.
____________________________
Registration for Commenting
Want to comment? You need to be logged in to comment. You can register here.
If you register, it protects your information. It also allows you to comment without filling in your information each time. Once you’re registered, simply go to the home page and click on the login link top right in order to log yourself in. Usually, you’ll be logged in for several days before needing to be logged in again.
______________________________
Problem receiving blog comment emails? Try whitelisting the address. More info.
______________________________
Couldn’t be happier … KK 2
Couldn’t be happier …The analysis and insight you provide is simply amazing! I’ve been trading the futures and equity markets for well over thirty years and usually average around 5% monthly. Since joining your Traders Gold Service two months ago, that number has better than doubled. I couldn’t be happier.—KK |
Get an upper hand … JC 2
Get an upper hand in trading …Seeing all the different currency pairs and the wave structures and hearing you explain why this has to do that on a nightly bases gives one a upper hand when trading. Elliott Wave applies to all stock and indices and can be applied to any candlestick chart. If someone ask what you want for Christmas – Tell them a membership to Peter’s “Traders Gold!”—JC |
Have not had a losing week RW 2
Have not had a losing week …I have been with Peter almost a year. The only thing that matters is have I made money with his service. I think I have finally turned the corner using Peter’s EW. I have not had a losing week in the last 5 months. Thanks Peter, for your amazing amount of hard work. —RW |
Rise above the rest … SM 2
Rise above the rest …I have only ever met a few people who, in their chosen fields (astrology, medicine, music, martial arts, technical analysis), rise above all the rest and you are one of them…you have ‘the gift’…and that’s why I’m a Trader’s Gold member. —SM |
the real deal SM 2
The real deal …‘Educational, insightful and thorough market analysis for all levels of traders. It’s Elliott Wave at its best….Peter Temple is the real deal’ —SM |
A true expert in Elliott Wave FL 2
A true expert in Elliott Wave …You are a true expert in EW analysis. What you provide is not available anywhere and is priceless. Subscription on your services is the best thing I have ever done. Many thanks for your effort to make me a better investor. I now have more trust in my investment decisions. I hope you will continue the excellent work! —FL |
The best of them JL 2
The best of them …Last couple of years, I subscribed to several ‘market traders’. You are by far the best of them and the personal contact is awesome. Daily and daily updates are very well written! Besides your expertise in EW, I also like your cycles analysis. Best investment I ever made! —JL |
Tops in your field DZ 2
Tops in your field …You are tops in your field. Tried to follow Elliot Wave international for years. They were always behind the market. After discovering you, I perceive that you are an expert in reading the waves, which puts you way ahead of the rest of your peers. And you can read the Waves like you are reading tomorrow’s financial section. I pray you stay healthy. —DZ |
US Market Snapshot (based on end of week wave structure)
Here's the latest daily chart of ES (emini futures)
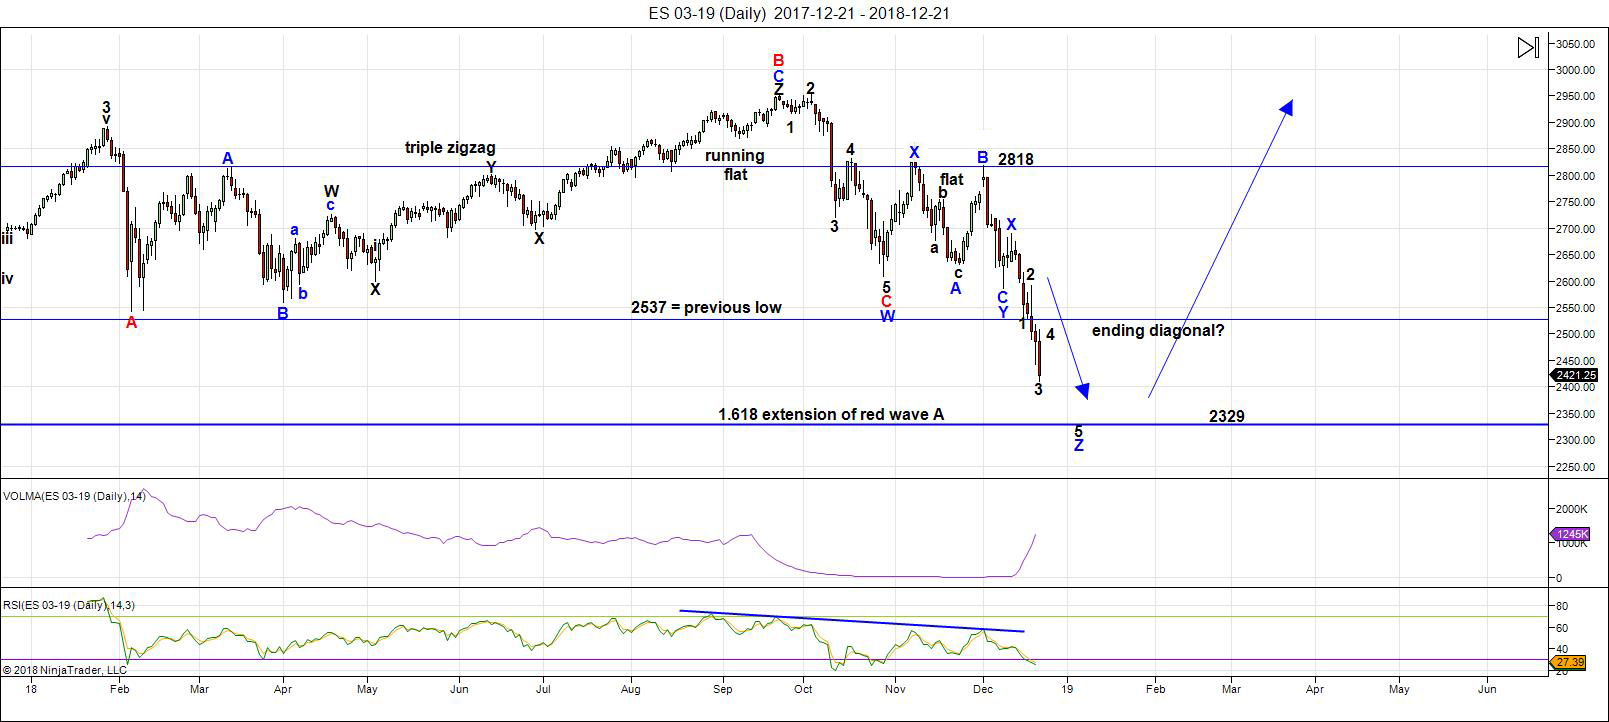
Above is the daily chart of ES (click to enlarge, as with any of my charts).
Last weekend, I called for caution for anyone bearish because we had a corrective wave to the downside which was fairly advanced in length. Corrective waves (3 wavers) fully retrace. If a corrective wave continues to unfold and becomes 5 waves, it only partially retraces. Coupled with the upcoming Federal Reserve meeting and announcement on Wednesday, we were certainly going to have a retrace. We got that retrace on Tuesday and Wednesday.
Before the Wednesday announcement, I warned about a possible dramatic drop right after the announcement, contrary to what usually happens (a subsequent rally for the remainder of the announcement day and a turn the following morning). We got the instant turn down.
That sent us into an ending diagonal as the final pattern of three patterns in the SP500 (a running flat, a regular flat, an ending diagonal). However the final pattern wasn’t obvious until Friday afternoon. You can’t absolutely determine an ending diagonal until the fourth wave is in place, so I’m even a little early now in my prediction. But, through the process of elimination, at this point, there’s no other option.
Ending diagonals have a limited limited fifth wave (limited by the length of the third wave — the fifth cannot be longer than the third).
Over the next week, expect a fourth wave bounce in the ending diagonal to somewhere shy of 2500 and then a sharp turn down the the long-term target, around 2330.
Summary: I’m looking for a comparatively smallish rally this weekend that will lead to a further dramatic drop to end an ending diagonal. The call has long been for a drop below 2400. We’re likely to see a bottom of the fourth wave in the 2330 area (somewhat speculative until the ED fourth wave is in place).
Once we bottom in this large fourth wave, we’ll be looking for one more final wave up to a new high. That fifth wave up to a new high will be the end of the 500 year bull market.
___________________________
Trader's Gold Subscribers get a comprehensive view of the market, including hourly (and even smaller timeframes, when appropriate) on a daily basis. They also receive updates through the comments area. I provide only the daily timeframe for the free blog, as a "snapshot" of where the market currently trades and the next move on a weekly basis.
______________________________________
Sign up for: The Chart Show
Next Date: Wednesday, January 9 at 5:00 pm EST (US market time)

The Chart Show is a one hour webinar in which Peter Temple provides the Elliott Wave analysis in real time for the US market, gold, silver, oil, major USD currency pairs, and more. You won't find a more accurate or comprehensive market prediction anywhere for this price.
Get caught up on the market from an Elliott Wave perspective. You’ll also get Andy Pancholi cycle turn dates for the SP500 for the balance of the current month. There’ll be a Q&A session during and at the end of the webinar and the possibility (depending on time) of taking requests.
For more information and to sign up, click here.
| "I think you are the only Elliot Wave technician on the planet who knows what he's doing.” |
| m.d. (professional trader) |
All registrants will receive the video playback of the webinar, so even if you miss it, you’ll be sent the full video replay within about an hour of its conclusion.


Depressing to be on internet. Everyone e talking depression coming. Targets 1500. 1800etx. Thanks Peter. But to go to 3000 some good news is needed. . Or FED RES to start cutting again
Rose,
I’ve been talking about the depression coming for ten years. But this isn’t just going to be a depression; it will be complete financial meltdown, much worse, I’m afraid to say, than that 30s.. Over Xmas, I’ll start promoting my upcoming webinar on how to prepare.
Some positive news will come from the final rise, not the other way around. The market registers the ups and downs of the human psyche, which turns events negative or positive, as the case may be.
My! It must be the full moon! lol!
No matter, we will just continue to rack up profitable trades while the naysayers engage in clue-less criticism.
Some of these people have no business being in the market. They cannot even get the current market trend correct.
Thanks Peter, my dates for december based on astrology are december 4,12,18,25,27 and 29.
So I expect a rally from december 29 till januari 8.
Good luck to all.
Peter, I admire your courage. Thanks for putting your work out there for us to see. The world is full of morons. As a Texan, I love Western Canada. Everyone should take the Rocky Mountaineer ar least once in their lives. And those who point fingers should realize that three others are always pointing back at them. Merry Christmas! P.S. – my birthdate is 8/13/55!
Hi Randy,
Thanks … well you’re at an age, like me, where you realize the importance of time. That’s what “gets” me. With all the problems we have and a life-changing situation coming straight at us, many seem to have too much time for all this pettiness (and it affects my time greatly). After all, my motive to help … How much have I learned about the power of herding! My mission is stronger, though, so not to fear.
“If you want a vision of the future, imagine a boot stamping on a human face — forever.” — George Orwell
So … lol … now, you’re making me realize I have a perfectly good set of skis downstairs that I haven’t used in probably five years! I might have to work on my legs a bit!! But, in my defence, I’ve done the Calgary to Vancouver trip by motorcycle a couple of times now … The power of nature is highly underrated, but that’s about to change.
Thanks Peter. Your insights are always helpful and your wisdom is greatly appreciated. Than you for caring enough to give of your time and talents.
Peter T
Thank you for the update .
I am in complete agreement to each of doing our homework.
as a believer in Elliott wave theory I also must admit something I do
use in addition to : That is valuations
ill note though that buying based on valuations alone in a bear market is extremely foolish and will not work .
having dug through several thousand stocks over the past several days I will note
that it is very hard to find anything of ” value ”
I narrowed down to only 16 stocks ( out of several thousand )
I had a rough count of 42 for further research
it looks to me like this selling has been across the board and the patterns for the most part all the same .
As Robert prechter once said ( ewi anyways ) : you have a choice to manage your money or to let the market manage it for you . If you choose to let the market manage it for you , you most likely wont like your results .
I did look into glen neely’s work several years ago and I also found it something I couldn’t use . The rumor I heard was he once was working with prechter and Co and went out on his own .
Everyone is a genius in a bull market ! it is the bear markets that test your skills
Chris Carolan : Pay Attention or Pay the Offer !
Thank You for all of your work !
Joe
I placed several buy orders today yet overlooked the early close .
Ill be filled when the market opens on Wednesday .
The 21560 price on the cash dow will be both the pivot and key support .
if its broken it becomes the pivot , if this level holds we get a gap up yet
the cycle low remains Jan 4-6th .
there is a top to top to bottom count which hits in 3 trade days from today
so ill say Dec 28-jan 4-6th as a cycle degree low .
Dec 28 being a Friday – Jan 4 also a Friday Jan 6 a sunday .
Monday Jan 7th the market must begin to turn up or I am dead wrong on timing .
About a week to go as I see it yet price is very near its projected objective
NYA close At for the most part its projected level.
$tick closed at minus 784
10 day Trin closed at 1.22 which is still not the reading I was looking for
yet the 5 day trin closed at 1.44 .
5 day advance decline line is beginning to turn up despite a down day which is a bullish signal once price confirms.
10 day advance decline line is near an extreme at minus 1073 .
Everything im looking at says we are at the very least putting in a momentum low .
momentum lows are like 3rd wave lows , divergence lows show lesser extremes in the indicators yet price breaks and makes new lows .
Bottom line: The bottom of this move does not appear to be in yet we should see
many stocks which make there momentum lows at this time .
A high approx 1 month prior to the solar eclipse projects a low into the solar eclipse , dec 6 to jan 6 was the dates . from the jan 6th date ( my view of puetz cycle ) you look for a rally into the lunar eclipse and then a drop / crash into the
following new moon . the cycle ends in mid Feb. under this scenario .
ill look at oscillators later yet as of a few days ago there were coming into their respective extremes .
Same as my take. I can’t make this low work as the fifth of an ending diagonal; it has to be an elongated third, which means one more bounce and then a large wave well below the target. That makes the most sense to me looking at and measuring the pattern. If this is the fifth wave, the ED broke. The market will tell us.
Yes indeed!
Clearly an extended, subdividing third, with more carnage to come! Wow!
This is what happens to artificially inflated markets by central banks and fools on leverage. Here comes Q.E
infinity. Where price seems headed almost gurantees it!
Peter T
Something to consider is the weekly cash dow close only chart .
I use excel spread sheets for my oscillators and a lot of what I do is
based on closing numbers .
It is most definitely worth looking at the cash dow weekly close only chart
a simple line showing closing numbers only .
it to me just opened my eyes to what may be going on with the wave count
this decline appears to be in wave 3 of 3 of wave C.
If this is correct and we get a full 5 waves down in wave C then the next bounce
would be wave 4 of 3 then wave 5 of 3 the wave ( 4 ) then wave (5) to complete wave C .
The entire drop from the Jan highs would be a massive 3 3 5.
I only just noticed this so food for thought .
This is what im seeing.
Not saying its correct, just food for thought
https://imgur.com/6fsSh5y
Hello all. I’ve been away for a while as I got bored of the markets refusing to play ball but seems like the market controllers have finally lost power which is great to see. I always knew the forecast was for this down leg and then a rally to new highs so I look forward to getting onto the long trade! Personally I expect a blow off 5th wave that could carry to 3300+ on S&P but either way from here to a new high is a great trade opportunity. Merry Christmas everyone!
Dear Mr Tump
We are ready to start winning now : )
I have long contended that what has been going on with volatility related instruments and particular VIX, has been nothing less than outright FRAUD. That fraud is starting to become startlingly blatant. Can anyone explain to me why VIX 30 strike call options for Jan 16 are bid only at 1.80 with an ask of only 1.85 when VIX is trading at 36?
WTF???!!!
Verne
Just place a buy order for 1000 contracts at 2 and see what happens .
Id say no market for them yet I agree they are not priced correctly
Joe I have been trading vol for a long time and I have never seen anything like that.
At liquidation they have to pay intrinsic value so that bid/ask is suggesting that market makers are supremely confident VIX will trade under 32 from its current 36 on Jan 16. Even nearer dated call options are strangely skewed and not bid at intrinsic value. This is beyond backwardation and is market fraud, plain and simple!
Ill be buying the open
id had rather have bought the close the other day yet missed it by 4 minutes and wasn’t paying attention to the early close
spx/vix is worth looking at .
The old rule of thumb many many years ago was to go long when
that hit 20 . I gave up on that years ago yet maybe a new metric to it
https://www.msn.com/en-us/money/markets/why-decembers-ugly-stock-market-is-very-bad-news-for-californias-finances/ar-BBRqaBI?ocid=spartanntp
More taxes for Californians ?? move out while you can
I love that statement , less dependent on high income earners
in other words not taxing the rich but taxing everyone more
The downturn in the stock market comes as outgoing Gov. Jerry Brown is about to leave the state with a surplus, but it may not be enough to weather a major downturn. Gov.-elect Gavin Newsom has expressed interest in overhauling the state’s tax system to make it less dependent on high-income earners.
70 % isn’t enough I guess .maybe 125 % , those state pensions need funding
A forecast by the state estimates personal income tax collections in fiscal 2018-19 will account for nearly 70 percent of the state’s total general fund revenues and transfers. Sales taxes are expected to represent roughly 20 percent and corporate taxes another 8 percent, with the rest coming from other taxes.
Hey Peter T, the 2330 mark in the S&P you referenced, is that a close at or below 2330? I know the futures hit 2326 this am, do futures count in your EW calculations?
My calculations are based on futures. We’re still in this potential ending diagonal, so I’m expecting one more wave to the downside … a big one.
Peter G – any comments on the TRIN indicator. Both VIX and TRIN look like they are showing panic. We are close to Peter T’s level and we are close on the approximate bottoming date of Joe. I covered my shorts way too early, but thats water down the bridge. Seems like we are setting up for a bottom. I will buy the first day this market can hold onto a 1.5% gain. Seems like we bounce 1-1.5% just to fall right back down day after day.
Feels and looks more like the 4th of that Ending Diagonal than the beginning of the 5th.
Question about ending diagonals. Is it a requirement that wave 5 has to hit the trend line projected by joining the extremes of 1 and 3 ?
I bought the open after having failed to get in on the close Christmas eve.
Feeling very good today yet 1 day is not a trend .
Nice bump to the upside though and market was showing oversold readings .
Increased my longs from 45 % to 75 % .
No plans to add to this anyti9me soon and will hold into sept at this time .
market will now have to prove itself bearish from here on out .
Great call Joe. I got long after the market was already up 1.75% (I have no choise but to follow my own system – and that does not allow me to buy an extreme) – so not as great an entry as yours. Did buy a lot of call spreads. Hopefully that will be enough to take me to reasonably long.
Now I get those laughable bids on VIX options. The market makers obviously knew what was coming today.
I will have to keep that signal in mind….
Thoughts on martin Armstrong
Just my opinion yet even though I have followed him for the past 12 years or
so im beginning to think he is a bit of a carnival barker .
I say that because at times I feel he does his own questions and answers .
another thing I notice is he will write something one day and then change it another .
I don’t mind a change of mind yet I hate it when I see what appears to be a bit of fake gratification.
The hey martin you nailed it again yet I don’t think he actually did .
if we saw a true bottom the market will need to extend yesterdays gains and not just chop around . the jan 4-6th date for a low stands
my issue and I may be very wrong here is the puetz cycle and the typical pattern with in a crash cycle .
something is not lining up correctly .
The bounce feels good and I added to my long positions yet the cash dow still needs to get above 23075.15 on a closing basis before I have any somewhat confirmation .
the spx would need to get above 2477.78 on a closing basis .
when you get a true bottom stocks tend to run strongly for several days on end .
Bottom line: 1 day does not make a trend .
So far looking like a poor follow up. I give the Dow maximum space to 23200 before the wave 5 plunge down towards 20,000 area. And then we should be in for one hell of a rally potentially to the 30,000 area. I reckon the final leg will drag onto Q2 2019 but i expect it to be parabolic. Some are calling the final wave 5 of the market done based on the rally from early 2018 to Sep 2018 but it was too weak a rally imo hence my preference we are still in wave 4..
There is a kind of insanity infecting a lot of market observers. If what we saw yesterday did not alert folk to the fact that we are staring down a GSC bear, either very close or already here, I don’t know what possibly can.
I think all HELL is about to break loose. Yesterday’s historic reversal and rise eclipses anything we have ever seen even at the very height of any previous bull market frenzy. The implications are that what is on deck to the dowwnside will be equally historic. Dangerous times…!
I follow Martin as well..he did not call that last low a bottom so todays post was confusing..his opinion the bottom will be Jan/Feb
The market has hit all his bear markers and has not hit any of his bull reversals so he too thinks this market has further downside before skyrocketing up.
It also has missed his recent daily bullish reversal which means the market has more downside. Until it passes a bullish reversal.
Marie
thanks for the post
I have to agree the market is not doing anything outside the norm
for this current bounce/drop .
that said I have a top to top to bottom count which hits tomorrow
and a cycle low due jan 4 and the solar eclipse due jan 6.
it is jan 7th ( a Monday that matters to me )
the oversold readings is what got me to buy into several individual stocks .
Yesterdays bounce was a larger bounce than we have seen so it does give a hint
that people are at least dipping their toes .
that does not make it bullish but …… it was good to see .
21560 still matters to me and after looking at this mornings market action
I see another level at 21530 on the cash dow .
so ill keep my eyes on the 21560-21530 range .
I will also note Peter T and his targets on the ES , he posted those targets a long time ago .
ill say Peter T nailed it !
Joe – I have to tip my hat to both you and Peter. Your inputs and Peter’s target (around 2330 in ES) gave me confidence to get long. I added to my longs around 2400 on ES (as I did not buy enough yesterday). 2295-2305 is a huge support that can be extrapolated as support trendline all the way from 2009 bottom. I was planning on waiting for that region, but decided to start buying a little early as things looked close enough. A close above 2500 will give me a lot of confidence in this bounce. It is still not clear if all of the decline from 2940 is done or not. Using my methods, I will play for a rally to 2700 with a stop around 2265.
Cash dow closed above 23075.17 and spx closed above 2477.78
Next upside objectives become : cash dow, 23679.62 and spx next upside objective becomes 2569.78 .
Ignoring any potential wave count at this point in time .
just playing it by the numbers only .
Silver is worth a look at .
Hui and Xau need to test 184 and 86 respectively .
im not saying were out of the woods at this point yet in regards to the spx and cash dow as well as the nya the downside targets were met , the market was showing oversold readings and the mkt is moving higher .
So far its all coming together .
Dec 28 , tomorrow is a top to top to bottom count day , jan 4 is the cycle low in regards to mars Uranus , the solar eclipse on jan 6th should ideally be a low if
this is going to correlate with the puetz cycle .
a failure would imply an inversion is taking shape ( to soon to call it .
if an inversion is taking place the the lunar eclipse surrounding jan 20th ( going by memory here and a lot of things on my mind ) the jan 20th is date would become an important swing low ( a higher low ) and the market would rocket higher into feb 13th 19th and then stall .
keep this all as a grain of salt and do your own research .
back to building my green house .
im a casual trader at heart .
Vivek
thank you for the hat tipping.
: )
my thoughts above is what I was thinking before reading your message .
No comments from me for about a week .
These bottoms when they are true bottoms require faith more so then logic .
it may sound strange but its how I see it .
I spent my day away from my computer other than to do a couple checks .
enjoy your weekend
Remarkable intrigue in this treacherous market!
It waited until close to the end of the session yesterday to rocket skyward in the steepest part of the A portion of the wave up.
It then tanked in futures overnight and headed back down in a deep B wave today and stayed down for most of the session, trapping anyone that jumped in on the long side toward the close yesterday.
After an initial failure to close the gap this morning with reversal to lower lows, it once again waited until just before the close to complete the possible B wave and once again rocket higher in what looks to be the C wave of the current upward correction. It sure does look like we have a shooting star in ES.
I was able to trade the wave down, and then the ramp higher into the close.
I am glad index options trade for 15 minutes past the close and I exited all my long option calls for some nice gains on that final ramp. There was even nice pop in option premiums after the close. I got the hell out of Dodge!
There is no way I am remaining long this market over-night. That ain’t happening…! 🙂
Futures suggesting we had only 1 of C up yesterday.
Global futures markets were down huge last night and then VOILA!
Everything is green as leprechauns.
The banksters clearly had a big confab. Today should be a big up day as US indices join the party!
idn..i see a possible bear pennant shaping up after last nigh on spx mini lets see what the open brings..
I tend to play for 5-10% moves. I got the first leg of the rally that I was expecting. Its still not clear if the bottom is in for the current wave. The reason for late day surges has been Pension Fund rebalance that tends to happen right before close. We are likely to get more of that today, but this phenomenon goes away next week. Even if wave 4 is over, we can go down to 2400 just as a partial retrace (or go to 2300-2315 to tap the long term trendline) in early Jan. At this point, a lot of options are still open. I will be monetizing my longs later today towards the close. If the set up is right, I will try flipping to short with a 2% stop.
Hello Peter,
First, Merry Christmas and a Happy New Year!
Thanks for your work on this site…I recommend it to many.
I’ve attended a couple of your recent Wednesday reviews and am wondering…by your measurements, are we still in the ending diagonal you plotted with a near term final low dropping below 2330? In one of your comments you said that it appearred the final fifth wave down had not yet occurred.
Are the bullish spikes of this week still matching your previous expectations?
Thanks
Hi Lon,
I’ll have a new blog post out tomorrow. The big picture is the same. The ending diagonal looks more like a rare triple zigzag. The waves up are corrective, so still looking for a new low.
Sold out of my longs as planned. Looking like a shooting star on the daily chart. Will wait to see if there is any follow through selling on Monday to get short.
It does look like we have a break from a bearish rising wedge…
Or, in this case, an ending diagonal, which will be part of my report tomorrow. (spoiler: it’s not quite done).
(the report AND the ending diagonal, that is)
Should both be a great read…! :-))
A new weekend post is live at: https://worldcyclesinstitute.com/a-finish-with-a-flourish/