
Uupdate Friday morning, Oct 30 (before the bell)
Futures acted much as I expected overnight. They completed what looks like a small 5th wave and then retreated and are sitting, waiting. The euro continued up and should get to the previous 4th at 1,1090 before turning down in a second wave. usdcad hardly budged but it set to head down.
We seem to be set up for the possible turn.
___________________________
Update Thursday night after the bell (Oct 29)
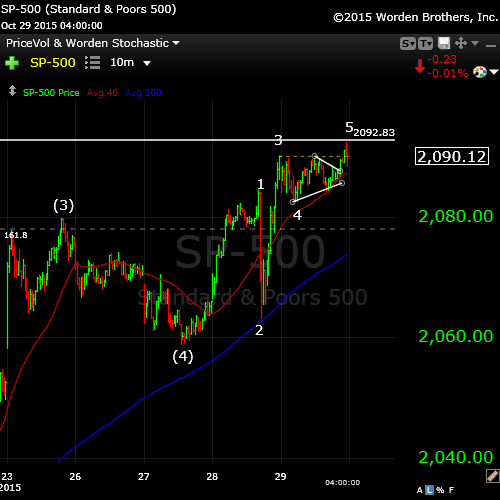
Above is the SP500 (10 minute chart showing the final wave up). I count the wave complete, other than a probably double top. You can see the triangle traced out during the day and the fifth wave up from there. You can see how the waves just keep getting shorter and shorter.
The futures still have to top but will likely do that overnight and the Nasdaq is still lagging. The NYSE has traced out a triangle, which denotes an end wave. We should be set up for a reversal to the downside. The eur/usd appears to have reversed with a set of first waves up (in 5 waves) as has usd/cad.
_____________________
Update Thursday, Oct 29: All eyes on currencies this morning as they’re starting to move. CAD, for example is reversing and will need to retrace the 62% (a second wave) from the highs. Euro should head up and the dollar down.
I have been saying for some time that the euro moves inversely to equities. That’s still appears to be the case. It’s a countertrend move, but the euro has to at least retrace 38% of the wave down (I expect 62%) and it hasn’t done that yet.
In equities, we came down overnight in three waves. I would expect a retrace. Watch for the double top.
NOTE: If we continue up past this top, I would have to seriously consider the stance and my prognosis for a turn down now. So I think we have an inflection point here. I count a fully set of waves up and the NYSE is reaching its target. We have to keep this in mind. I have to keep objective and although I don’t see support for a continued move up, it is what it is.
________________________
Original Post: If you’re a bull, this sums up what I project the near future to hold. Fed Chairman Janet Yellen puts out the monthly FOMC announcement at noon EST today and I expect an outcome similar to that of Sept 17. We will likely rally during the morning and turn down sharply either with the announcement of shortly thereafter. The rest of the week should be bearish.
In Elliott wave lingo, we’re heading down into a third wave, which should be a sharp drop to at least 1.618 X wave 1 down (to Aug. 24). A long consolidation in wave 4 should follow (a couple of months likely) and a final drop into wave 5, which should be of a similar length to wave 3. I’ll be able to get more specific on all these targets once we’ve completed wave 1 of 3.
Let’s look at where we’re sitting in futures this morning:
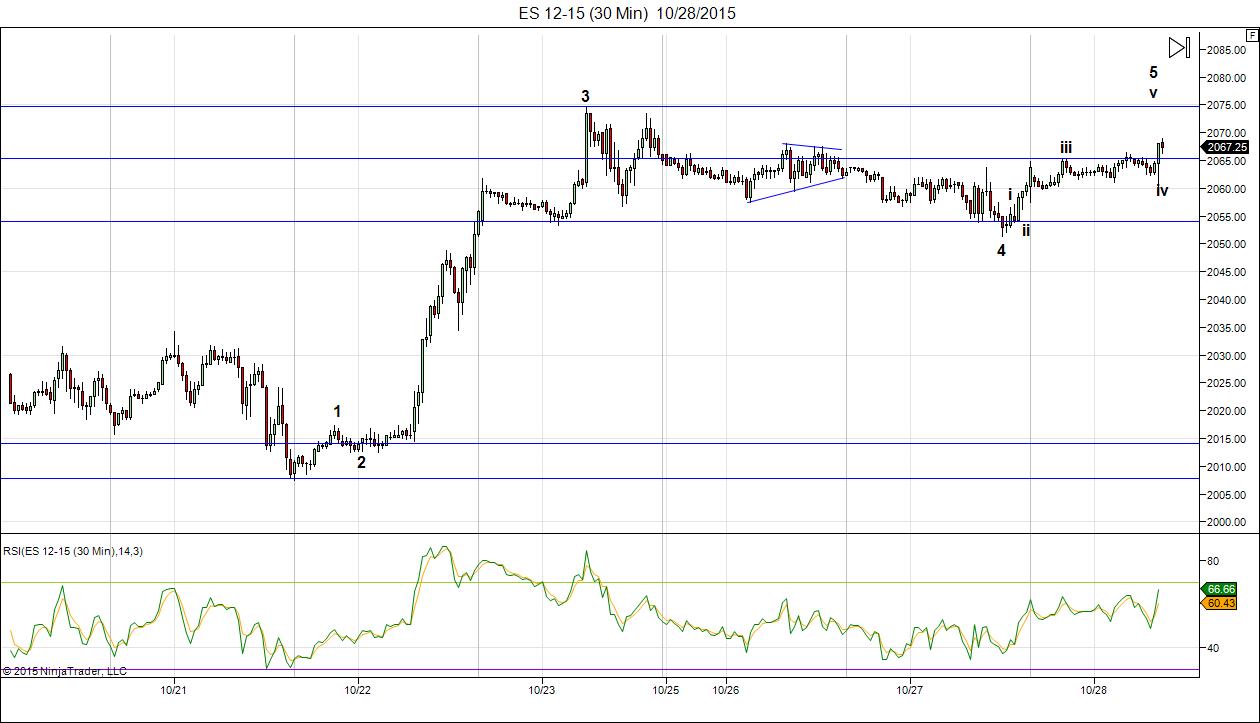
Above is the ES (SPX futures) showing the rather flat fifth wave. I put us in the final small wave up. There are a couple of ways to label this and the waves are so small, that’s it’s possible we could rise to the original target of 2038, but the market is so weak, I’m not counting on it. My preference is for a double top. The NQ (Nasdaq futures) looks to have already completed an ending diagonal and is poised to complete a double top. So we are literally waiting for the announcement.
Here are a couple of other great candidates for shorts.
___________________
In today’s post, I’ll update all the indices to this morning (Wednesday, Oct 28)
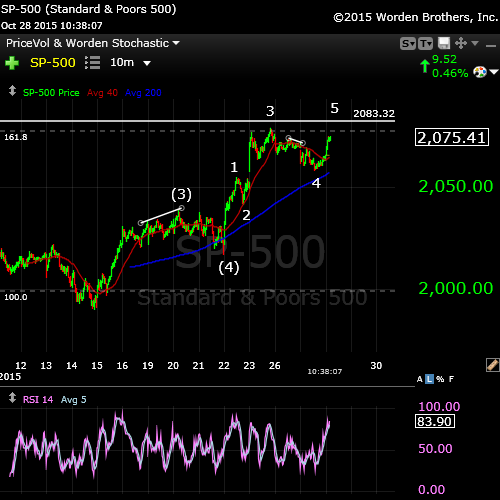
The 10 minute chart of the SP500 (above) shows a breakdown of the C wave with 5 waves up, almost at an end.
I’ve placed a line at what might be the final target for this last wave. We may not make it that far.
At the time of the FOMC meeting, we might have a spike up, but the spike should not last that long. I would expect a turn down before the end of the day and it will likely be sharp.
As we approach the top of this correction, I often get asked where the best place to enter is. Here is a brief explanation of what to expect and the safest point at which to enter a short trade after a first wave down.
___________________________
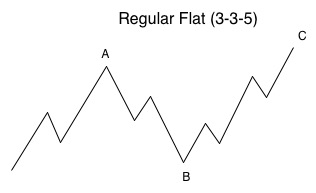
Here’s the explanation of the correction we’ve formed on almost all the indices: a regular flat.
 Currently in the SP500, wave 3 is 1.6 times the length of wave 1. In the final 5th wave, wave iii is 1.6 times wave 1. If wave v traces out the typical full length (1.6 x wave i), it would top at 2052. Based upon what ES did on Friday (an ending diagonal), I find it less likely that wave 5 will extend to its full length.
Any flat correction is in a 3-3-5 pattern. This final wave C has now traced out a complete, or almost complete set of 5 waves. Five waves up marks the end of a sequence and demands a trend change.
In a regular flat correction, “wave B terminates about at the end or about at the level of the beginning of wave A, and wave C terminates a slight bit past the end of wave A.” If we complete a flat that goes to a slight new high, then this would have to be a larger 2nd wave and the downside will be much greater than a 5th wave. For example, the third wave alone would take us down to the low 1600s in the SPX. We would have a 5th wave after that.
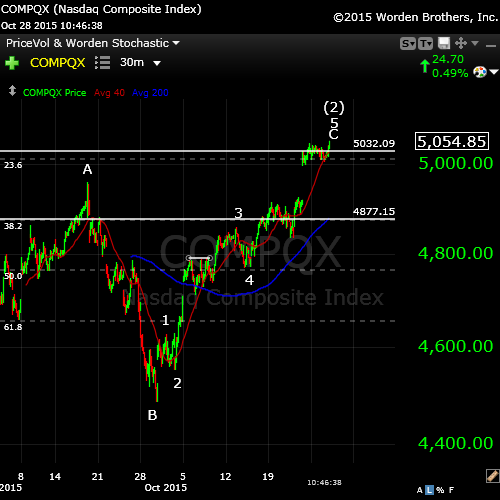
The Nasdaq (above) now looks the same as the other indices. We’re very close to the end of the fifth and final wave, which will require a turn down.
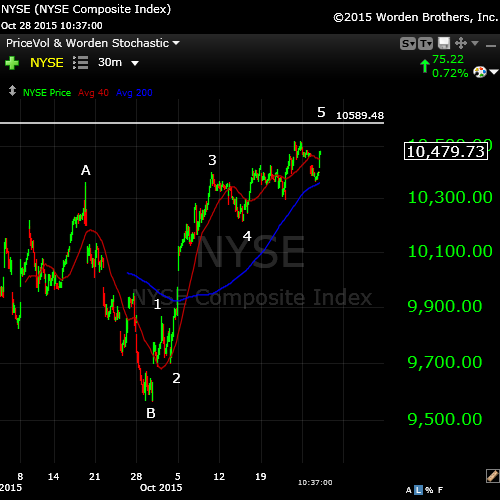
The NYSE (above) has not met the 62% retracement level (horizontal line). This is the index that’s lagging all the rest and I would expect it would make the 62% line before turning down. We’re so close that it might simply make the previous high.
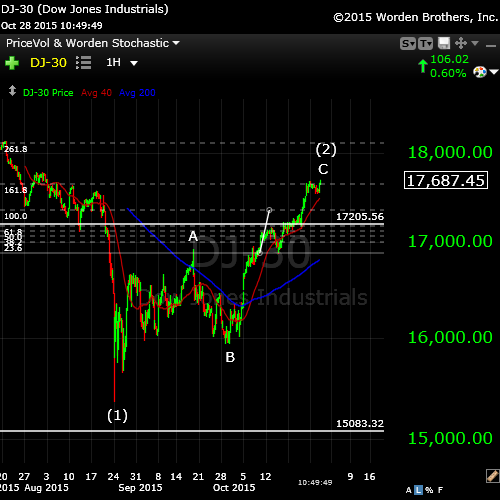
The DOW (above) is also just about at the end of the final 5th wave.
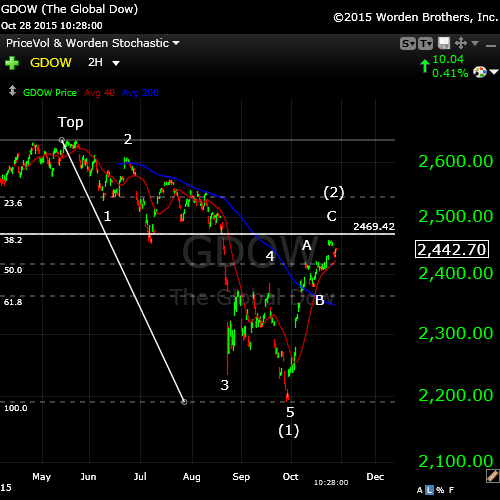
The Global DOW (GDOW) has retraced up to to almost the 62% level (horizontal line) but is still short. This is the only other index (besides the NYSE) that has not reached the wave 2 expected target of 62%. This may be good enough, however. It’s just about there. This also creates the second wave scenario in the GDOW with a long 3rd wave down to come.
_________________________
Cycles Analysis
I ran this chart this morning, Wednesday, Oct 28. Not much has changed from the cycles analysis from a week ago. You can click on it to expand.
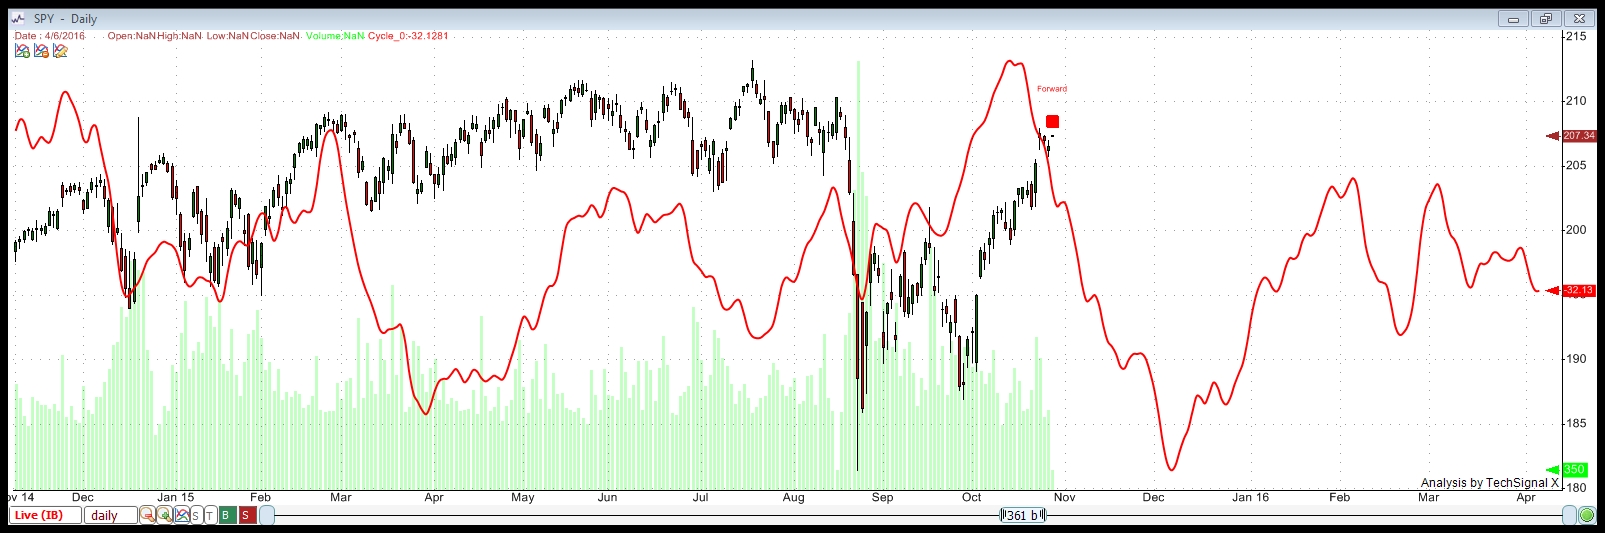
This cycles analysis uses Techsignal X from the Foundation for the Study of Cycles. I’m using data going back to 2002 this analysis of SPY (SPX) and displaying a compilation of all the cycles the software has found over that period. You can see how close-fitting it has been in the recent past. The fit with the current wave is quite stunning and therefore, something to pay attention to.
This analysis suggests a cycle top of October 13, so we are overdue for a turn down.
It shows a bottom to this set of waves down at December 7, 2015.
This particular cycle top (Oct 13) is a strong one. I’ve gone a little deeper into what the analysis is telling me on a separate page. Here’s a more in-depth explanation of what this chart is suggesting.
_______________________________
The Panic Phase and the TPD (Turning Point Distribution) Principle
The TPD Principle describes a period in time of several weeks in which an array of cycles congregate, including gravitational, geomagnetic, and nuclear. It’s around this time that markets have historically topped. I was asked to include a reference to this in today’s blog post, which I’m happy to do. This principle generally refers to market tops (which we’ve already seen on May 20, 2015), but it’s interesting to note how many astro events we have occurring over the weeks surrounding the upcoming major turn in the market.
In his book, “the Universal Cycle Theory,” Stephen Puetz writes, “The TPD principle involves the eclipse cycle as well. The eclipse cycle normally peaks on the first new moon before a solar eclipse. Following that reversal point, it takes six weeks for sentiment to shift from euphoria to panic. Then on the first full moon after a solar eclipse, a panic-phase begins. A panic phase usually last two weeks—ending at the time of the next new moon.”
The dates:
Aug 14 , 2015 – First New Moon before the Eclipse (there is a New Moon happening at the same time as an Eclipse—Sept. 13)
***Aug 29 – Full Moon before the Solar Eclipse (peak of the eclipse cycle)
Sept 13, 2015 – New Moon and Partial Solar Eclipse
Sept 23, 2015 – Fall Equinox
***Sept 28, 2015 – Super Blood Moon Eclipse (start of panic phase)
***Oct 13, 2015 – New Moon (this would mark the end of the panic phase) – six weeks after the Aug. 29 full moon.
So … we are also due for a turndown based on the Puetz crash cycle.


The McClelland Osillator and Sumation has given a sell signal that is good in my experience. It will typically rally the next day before a sharp reversal. Just like you expectation.
Man do I need an edit function have for has index your
I see 5 waves up now in ES to a double top.
Double top indeed…
See link. Look at that crazy action the Stochastics have been doing all morning (bottom right).
This is what the market looked like on September 17th (double top on the blue fib line). The BIG difference is Yellen spoke and the market surged and collapsed. Now we have the surge first in the morning when the market is usually very tame on a FED day.
What are the chances she says something wildly bullish and we surge up?
Remember, most always the market goes in the opposite direction of the initial FEDSPEAK.
If we spike down at 2:00pm EDT, we are likely to end up on the day…
http://www.screencast.com/t/4j4cYNdE1r
Hi Gary,
what parameters do you use building your chart?
I don’t see such volatility or anything unusual with RSI on mine
Stochastic 21,8,13
It remains erratic!
Gary are you implying that since there has already been the surge up we can take that as the initial Fed speak and go with a move down if there is one right after the announcement? Or that still despite the early unusual volatility either way after the announcement still is a fade?
Not sure! This market has been acting really crazy as far as I am concerned. It shows resilience in the face of stuff that used to be a crash maker. Take oil. Used to be a move up in oil sent the Stocks down. The crude inventories this morning sent crude up $2.50 and the stocks love it. The argument is that that will keep the energy companies earnings strong!
It wasn’t looked at that way in the past.
If that’s a first wave down, I want to see a 62% retrace and a turn.
Looks good so far. I can see 5 waves down. Very small waves so can’t be 100% sure.
So we are on the same page.
Are we looking at an ESZ5 high of 2079 and a low of 2055 followed by a retrace to 2070 and then turn? (rounded to nearest point)
Yup.
Could go a little higher than 62% – first set typically does, but not past 76%.
Where does this entire wave count from September 17th until now leave you in basic terms? That is, do you think this is the beginning of a wave structure down to August lows or is there a possibility of another test of the highs… ?
thx.
We should be all out of “up.” We completed a full set of 5 waves up. These waves should take us way below the Aug 24 lows.
Wave 3 here in ES should take us down to 2009.
We’re not in it yet, but when it turns. This is wave b of 3 waves up.
We could also do one of those double first waves here … so if we go to a new low, that would be the clue, but I think we’ll complete this second.
That a wave up is all overlapping waves, which is what we should see.
Am I correct in assuming that from your experience once this top (previous count to the high 5/5/5 completing today) that predicting the structure of the decline is easier? Or less likely to be fraught with erroneous or misleading counts?
It seems this previous move to the high in the past two weeks was confounding because it was in the final stages. Right?
This will be the first of the first. I’d like to see one full set of waves down. I think the 3rd of 1st will be 2.6 X the first and want that one in the bag first. But the full set of first waves would give a better count. I’m already assuming we’re going to the mid 1300s in SPX so it’s a case of trying to confirm it a little closer.
The move up was confounding because it’s a countertrend wave and when they get close to the end, the waves start to get a little shorter, so it throws off the count until the end. Countertrend is a lot harder to figure out than trend by a long shot. Trend waves should be pretty close to target.
The buying pressure looks incredible. Somebody puts a lot of money in.
The carry trade in JPY and EUR now means everything.
They don’t care about the EPS any more.
This bizarre resiliency continues! Amazing, going for a complete retracement.
Well, that wave down looked pretty good, although obviously it was in 3 waves. The second wave looked dubious, but it’s such a shear drop, it’s hard to see.
Seriously!
Where to now?
We just made a 100% retracement.
The thing that sits in the background is the NYSE. It’s not at 62% yet and it’s weird to top without that. That’s what I expect is happening, because wave 5 is extending. Everything else has hit the appropriate targets. NYSE is in the final wave, but still has about 60 points to go.
The day after, we typically head in the opposite direction, so this might only last until tomorrow.
The top of this wave in ES should be 2089.
Peter,
I still have the gut feeling SP goes to a new High… They just want a new high that is how I see the american people the have to win and are very determined the bradley has room till friday next week..
The problem I have with that is the EW doesn’t have guts and this is a countertrend wave in 3 waves. I measure the fifth wave in DOW right to here, so we’ll see what happens. I’ll do some more measurements tonight, but I’m focussed on NYSE at the moment. It’s always what I come back to and it hasn’t quite met the target.
I can’t find anything at the moment that support a new top.
John,
if it goes to the new high it will be not simply a new high before going down.
It should change all the count and the market will go much higher
It is just my idee to put everybody on the wrong foot just like Okt 2007.
haha. I measure the NQ to top out right here. I would count this NQ wave as a final micro wave 5. I can now see the first, second, third, and fourth in NQ rather than the ending diagonal.
NYSE is now just 50 point away from the 62% line. I think we look at what happens tomorrow morning. I think there’s a good chance we turn over there.
Or October 2014
I put the previous for NQ (very top of that market) at 4077 … which we just hit. That creates a large double top.
Dmitri,
This wave down today appears to be a final 4th wave and the wave up counts in five and measures correctly. I put us at the top or a few points away. The wild card for me is the NYSE and whether it needs to reach the 62% target. I think we could see a turn tomorrow as we usually go in the opposite direction the day after the Fed meeting. I keep looking at this market and it looks complete in so many areas … plus a lot of divergence.
Well Peter you are very determined too I hope you are right…
I still have my November puts..
So maybe we are lucky and we go straight down next week and take out the SP low..
The bradley has a lot of hits this year and is also very determined after Nov 5
There are a lot of other indicators that also project a top but not as strongly as the count, imho. I may be a reading from EWI tonight in their report on underlying strength. I wish I could find something that supported a new top, because that would make it easy.
John,
any way this rally is blowing out the mind when you look at its economic background.
They just cann’t keep going with this pace stretching the PERs.
Even if they want to continue to ATH the market should retrace before.
As far as I’m concerned, we’ve been in that situation for 8 years now 🙂
Not exactly, Peter,
the previous years the divergence between the earnings and the stock prices was not so impressive.
Now the earnings and the macro are deteriorating since the beginning of the year but the prices are up ytd.
I just realized what I said earlier (below) actually happened. Yellen didn’t say anything particularly bullish. However, we were at TOP TICK at 2:00PM EDT. Just as has happened so many times in the past we reversed from a down spike to go above the high.
“Double top indeed…
See link. Look at that crazy action the Stochastics have been doing all morning (bottom right).
This is what the market looked like on September 17th (double top on the blue fib line). The BIG difference is Yellen spoke and the market surged and collapsed. Now we have the surge first in the morning when the market is usually very tame on a FED day.
What are the chances she says something wildly bullish and we surge up?
Remember, most always the market goes in the opposite direction of the initial FEDSPEAK.
==> If we spike down at 2:00pm EDT, we are likely to end up on the day…”
http://www.screencast.com/t/4j4cYNdE1r
Well, let’s see what happens tomorrow morning.
So Gary,
it just confirms that the market goes where it wants to go in spite of whatever whoever says.
Personally I cann’t explain why the oil has jumped today 6% on building inventories of crude and strong USD when the storage capacities are at many years low
I don’t know if it matters but Russell 2000 Index /TF hasn’t reached its Sept. 17 high of 1190. Perhaps we should wait for this double top?
Yeah, I’ve been watching that, too. Good question. I would think it will test that previous high. It also shows how the small caps are really lagging the overall market. And transports are down today in a way that looks motive after doing a double top (hourly chart).
According the EWI tonight the number of stocks reaching 52 week highs is still contracting. All the underlying data suggests an end of the rally is very near.
If one should reckon that all the major indices reach the .62% target, the NYSE is still ~.46% short ,but the GDOW is upon the close still ~1.02% shy of its ideal goal. So if ES should go up another 1% , it would top out at ~2105.50 . It sure is an extremely illogical and highly manipulated market !!
I can’t figure out the wave structure in GDOW – too many gaps. I was looking at it tonight. Both of them are SO close, and they may not have to get there exactly, but they should be close.
http://www.safehaven.com/article/39338/confused-about-the-stock-market-well-2015-is-looking-a-lot-like-20072008#.Vi4edsMHL_8.twitter
And that’s exactly the way I feel. It’s interesting the comment about the Obama and Bush.
Thanks, John
Take a look at the technical charts on northmantrader.com . He does excellent work on a technical analysis basis !
This move up will not be over before we hit 2016 on ES .
This will happen by Thursday / Friday this week.
Regards
AZ
AZ , you could be right on in projecting that insanely high level being reached by this Friday, if the Bank of Japan announces even more QE on Friday afternoon their time.
I’m gonna guess you all have been calling for a selloff since Oct 2nd…..
Central Banks are the sole driver, and in control. I’m asking the website author for an honest reply: At what price in the month of October and what date have you been calling for a retrace down or sell off? Be honest.
From an Elliott wave perspective, date doesn’t have a lot of bearing. I don’t personally pay attention to it. EW is mainly about price. From a cycles perspective, sometime after October 14.
Central banks are not in control as we’re about to find out.
October 2? I just looked at the charts. I called for the C wave up on September 29. That was too obvious. You can go back and check the posts on that one.
Peter hasbeen calling for a rally in anew bear mkt. The market seemed very bearish near the lows and he warned about what has happened. You can read the archives.
Vinniesj,
for a market to turn decisively it takes time , more of like autumn into winter.And it is not on the same day for all countries on planet earth minus the equatorial countries.
I take that you are a seasoned investor and that you know this, I am not sure what is your intent of your comment, but are you saying that we are at the beginning of a bull market?
Peter is trying to time the exact date of when winter begins, it is not exact science but an art.
Pls appreciate his blog.
Be honest.
Vinniesj,
Btw , if the CB are in control, what happened to the last crashes in the last decades?
Or is it that the CB happened to take vacations only during crashes and that is the reason why they could not save the market?
Pls explain your stand.
Be honest.
This vinniesj sounds like Nicholas. Maybe the CB in control thesis s so pervasive that even Nicholas knows about it, similar to peak oil
Hey, the more bulls the better. The money has to come from somewhere!
I remember Nicholas …
btw, I am classifying yesterday’s wave up as wave 3 of the final wave and today we’re in four trying to do a tiny five, which might just create a double top …. eventually. The headwinds, I think, from currencies are strong and they seem to be reversing … interesting day.
Vince,
Thanks for the kind support. You know, I’m so used to the skepticism that it bothers me very little, but I appreciate greatly the support. You’re right on the money with your comments. The central banks are scared to death right now, with good reason.
Currencies are starting to reverse today, which is not good for equities. We’re in the final stages of this bear market rally.
Peter,
is it a new post ?
Sorry, Dmitri, is what a new post? This is a new post – the one today.
Sorry, just wake up and missed something
Any way it might be going to be the biggest ever market monthly gain this October
Consider—-many financial planners trade mutual funds based on moves above/below the 200 day average. They got a buy signal a few days ago. Hence the price surge. But, it looks like the money is all going into big names in the averages. Might take averages to a new high for an Edwards & McGee broadening top. Would make August the bottom of a wave 4. BUT— would also make next move down far worse with all money going into averages.
You’re right. I made the comment a few days ago somewhere that breadth is very small. This is a big cap lead rally with very low volume and simply won’t last.
Also, currencies are now on the move. CAD is reversing, for example. Eur will head up, dollar down. Not good for equities. I’m be watching today very closely.
Quick little update in the post this morning re: currencies. They’re on the move finally. CAD is reversing, for example. This is not good news for equities.
Peter, by Euro retracing 62% do you mean retracing the wave down since Aug 24? That would take the Euro back up to about 1.138?
Whitemare,
the 38% retrace level is 1.183 approx. I can’t see that usdeur not make it to at least that area. The 62% level is way up at 1.265 (which would be a second wave down). Based on the euro continuing to trade inversely, I would see this happen when the equities head down. Gold would keep heading up.
Sorry eurusd. I’ve been watching usdcad this morning … haha.
usdcad, for example, would have to retrace 62% in a second wave that would take it to 1.100. That would be a major reversal.
Peter,
friendly speaking I don’t see how Euro can go up far away with ECB ready to do “whatever it takes” and FED talking about the rate hike except something very extraordinary
Sorry, you’re talking to a technical analyst, not a fundamentals guy.
Fundamentally, I can’t possibly see how the SPX could retrace this high based on the shape of the US economy, but … it is. So I stay away from fundamentals when trading (or try to).
I know, Peter. That was not a question.
I told that just to express myself.
By the way the FOREX is much less manipulated than equities and more correlate with the fundamentals because of its enormous volume
And I’m certainly not coming down on you. I just like to keep my mind on what I see in the market and discount fundamentals cause fundamentals mess up my mind. It’s the old “trade what you see, not what you think idea” … and it’s really hard to do, in practice. That’s why I’m thrilled that this blog in not really about discussing who said what about what, it’s more on cycles and the planets, timing, and of course, EW.
You’re right about the forex. And we have to remember that it’s really all about the buck. The dollar gets what the dollar wants, because it’s still the reserve currency.
On your past note, remember that the FED really can’t do anything. It’s between a rock and a very bad, hard place. It can’t lower rates (obviously) and it can’t raise rates cause that’s a very bad place and they know it. They’re stuck. And Draghi … well … so far it’s talk and it’s been going on for a very long time …
Anyway, we’re eventually going to the very bad place … lol.
So, getting back to eurusd. I count five waves up on a ten minute chart to the 38% retrace line, which is normal and then a second wave down that has retraced about 62%. That puts us in a third wave up if it follows through. CAD is in exactly the same technical position.
It also seems to be creating major headwinds for the equities, as I’d thought it might. We’ll see …
/TF doesn’t look good. I don’t think Sept. 17 high 1190 will get hit.
What’s /TF?
Russell 2000 Index Mini Futures. On a 60 min. chart it has topping tails.
Oh, I didn’t know about that. Thanks!
I think we’re at a major inflection point. Currencies are turning and really creating headwinds for equities. Second indexes are lagging, no volume, no breadth, pumpkins everywhere … lol.
Just looking at IWM, Liz.
I think I was wrong suggesting it would have to double top at the top of wave 4. If it’s in the middle of the first wave down now, this wave we’re in is likely the second wave of the fifth. That makes the wave that topped at 118.89, wave 4. So this wave only has to do 62% or more of a retrace (wave 2 of 5) before it heads down.
Peter, I was waiting to see if TF will hit 1190 but like I said earlier, it doesn’t look good. So yes we’ll probably have a rug pull soon.
A “rug pull!” haha. That’s sound like a heck of a lot of fun! Best laugh of the day for me.
Well, I think we’re in the process of topping out. Looking all over the market, at the wave structure in cash and futures, and what the currencies are doing, I think it’s only a matter of hours …
This Guy never gives up lol..
http://www.safehaven.com/article/39349/fed-set-to-spook-the-markets-once-again
I know the feeling 🙂
We have triangles forming just about everywhere – this time for sure. Triangles warn of an ending of a larger wave. Not much more will happen today. But tomorrow … perhaps. I’ll post a chart showing the triangle tonight in the SPX. At the moment, I show the final leg (e) still to go and then up into a top (which will likely either go to a double top or a slight new high.
OK … maybe not for sure. We just broke to the top through the upper trendline in SPX. So I guess we’re just going to top. Sure looked good.
In fact, if I were to take the time to draw it properly (sigh … too many distractions today), it is in fact, a triangle in DOW and SPX.
We still have a little more work tonight to do in futures. All our soldiers need to get to new highs and there’s a wave 4/5 subwave still to complete in the DOW, but we’re looking good for a turn tomorrow. The Nasdaq is lagging …
Currencies still appear poised to resume their reversal. GLD looks to have finished a 3 wave corrective wave …
That 4/5 subwave is actually in YM (DOW futures). Both the DOW and SPX I count as complete but will likely need double tops. And then there’s the Nasdaq, which is still lagging a bit …
I posted the chart for the SP500 at the top of the post (end day).
The Venus Mars conjunction does not finalize till Mon eve. That’s the brightest thing in the sky right now. There is a sign pointing to a high tomorrow but maybe it means a double top or slight new high Mon at the close. Monday or Tues should be volatile because Moon will be contra-parallel Sun.
IMO it appears that this entire spring/summer has been an A-B-C down and now an A-B-C up. “IF” so, when this thing rolls over it would be heading into a huge “C” wave down. Are there any measurements for just how low “C” could go???
Roger,
In a situation like this, it would likely be either 1 or 1.618 X wave A.
Gann considered 12 to be a special number (masternumber).
Assuming 12/29/14 was a major top we add 12 squared. That gives us 5/22. The NYSE gave the high 5/21.
Adding one more 12 squared to 5/22 we get 10/13. Mmmm, where did I see that date before?
Peter is right; 10/13 should have been a significant high (as 12/29 and 5/20 also were highs). Instead the market jumped up to seek alignment with square of 9 timing.
Adding one octave on 12 squared (18) to 10/13 gives us 10/31. As this is tomorrow, the turn will likely come this afternoon.
Cheers,
André
Thanks André,
Futures did as expected last night. Currencies, as well. We seem to be set up for a turn. We’ll see what happens.
For s&p, 2080 is 90 degrees from 10/24. This is what Gann called squaring price with time. This makes 2080 an equilibrium price. When s&p closes beneath this level it will cause a significant decline.
André
I posted a very short update at the top of the post, based upon the action overnight.
This 1st wave down from 2095ES this morning looks motive
So far, so good. SPX doing a tiny little wave 5 up. Should be just about done.
I will celebrate with SPX under 2017 (previous larger 4th). Under 2082 is the first hurdle.
Peter,
do you mean that you cann’t confirm that we are heading down in the 3rd wave before we don’t cross down 2017 ?
Yes, in EW that’s the test … as soon as you plow through the previous 4th of one lesser degree. Actually, I just zoomed out the chart. There’s also the top of the B wave at 2020.86. That will be a great marker, as well. We’ll have a good feeling before then but technically, that’s those are the tests.
I’m actually not too concerned, based on my count and looking at these waves down 🙂
From a “short” trader’s perspective I would think ES 2084 is an important protective stop. If this is “it” and we are on the way down to the August lows, we shouldn’t go back above yesterday’s high ( overnight 2094). The first Fibonacci retracement below that is 2084. That is where I will add shorts if we bounce back up there. If we go to 2086, I’ll have to bail and see if we double top at 2094.
This is a really important week. Below is a re-post from Martin Armstrong.
http://www.armstrongeconomics.com/archives/37832
“In gold, there is nothing to get excited about until you see a weekly closing above 1210. In the Dow, that is 17762. Initial resistance in gold stands at 1188, whereas in the Dow it is 17340. We still see the markets focused on the first week of November. It is interesting that the debt ceiling was kicked down the road to December, but the Treasury warns they will run out of money by early November. So interesting times still await us.”
MA’s methods have stood the test of time going back decades. DOW 17762 is huge today. If we CLOSE above 17762 we can (probably will!!) continue up. His upside number is 23,000. Back in 2011 his call for the DOW was 18,000 in 2015. If we don’t close above 17762 (this is a weekly close number) then the August lows are in the future. Note what he says above about the first week of November…
I don’t really have a good number to give you for a stop other than the top at the moment. The wave is still unfolding. I think we’re going to see a much longer first wave down, based on the structure I see, but it’s a bit early. The first wave should get to the previous 4th in ES, which is around 2051.
Armstrong comes from the Foundation for the Study of Cycles, where I was exec. director for a short time. I don’t know if his methods have changed, but I suspect he’s using their cycles as a base, which is fine. So do I. Other than that, can’t comment on his numbers as I don’t know where they come from.
We could consider ES to have done 1 small wave down here. The third and fifth are 1.6 X the length of the first. If that’s the case, it may retrace to 2988.
You mean 2088 ?
Cash indices are all 3 wavers at this point. I’m now on the fence re: futures. I’m now out of ES, but if I weren’t, stop would be at 2088, of course.
Currencies still looking good and if they keep going, should continue to put more pressure on equities.
If this is to me, yes, I meant 2088.
Dmitri,
NQ looks like it’s going to complete a first wave down on its own schedule. DJ-20 doing a second wave. I get the sense everything’s a little bit out of sync as we try to put in this top. usdcad, though is taking off. Just a matter of a bit more time before everything gets on the same page, I think.
Looks like SPX is going for a double top here.
still think the heavy conjunction is going to drag this back up till Monday. SPX has a couple of gaps at 2096.92 and 2103.86. sucks, but…..
Futures would suggest not. Can’t say that about SPX at the moment.
Did you take the eurusd trade? It’s doing nicely. Should keep going.
Nope! I am focused on the ES on the short side for now. My best win % is actually in the bonds. I sincerely hope to open a March 16 ES short and just leave it overnight / week, maybe even month!!. Go look at a monthly chart of the SPX. If one “woulda” gone long the ES futures at 666 in 2009, they would just now be looking at getting out or reversing. If we actually go to August lows ONE ES contract will be worth over $30,000. The same thing happened in the fall of 2007. Waterfall down from 1600 to 666. Had you been short at 1600, no stop outs or margin calls. Set it and forget it. One contract = $50k
Once top is in, you can’t get stopped out and you won’t get a margin call. The trick is staying patient and keeping your losses small as you are trying to do the deadly “picking a top”. Once you are 20 or 30 points “in the money”, you might put a GTC stop there to protect a huge profit.
For those that really like to daytrade, you can short a March 16 contract and just leave it. That way you can go short and long December separately.
This isn’t for the faint of heart! But… if you look closely at monthly charts, you will see that once a trend develops and you have a position at the top, you are in a long term trend that makes life changing returns…
Sort of like buying Priceline at $20 and now it is at $1400!!
Or Chipotle. When McDonalds spun it off in ~2005? it was like $30. $650 now….
Long term legacy trades are the best!! If I get lucky and pull this off, I’ll transfer some of the funds into MORE silver. I bought silver at $5.00 years ago and probably won’t ever sell… Silver will be a life changer in the next 20 years….
Sorry, I digress! We have all been waiting patiently for this turn for weeks. We should be here now. If not, and we close above DOW 17762, the move to 23,000 will be epic!!
I see I had an error in my ES number. I meant 2088. Not sure if you were replying to that or not.
whitemare,
I’m leaning towards your view now. Ambiguous on futures.
thanks, Peter. just can’t ignore those shining planets. They will join at the end of a sign, been a long time coming, symbolism strong.
Gary, thanks for the great post about trading the ES future into the future. Had no idea the return was so big for just one. Do you roll at the quarterly turnovers if you are in excellent position like that?
🙂 I will also be concentrating on futures as they provide the largest return, other than options. But you want to be a seasoned trader. AS Gary says not for the feint of heart.
You only have to roll over the charts. It doesn’t affect your actual position in the market.
Another note … depending on the speed of this drop, I plan to play both sides of second waves, so I should be able to provide some warning on that, as second waves can be quite sharp and retrace 62% of the previous drop.
ES = SPY on steroids … haha.
Yes!
Although the volume is pretty thin, March16 ES futures are active right now.
Be careful, losses are also bigger
DOW and SPX are now looking like the last wave of an ending diagonal. In that case, the final wave will be in 3 waves.
Dmitri,
I’m still focussed on ES 2088 …
My preference is for this being the top. NYSE there or just about so. Everything else at possible tops.
Got short again at ES 2087.50
It’s good point ES 2088. It’s exactly 62% retracement of this morning 1st wave down in ES.
I’ll wait the close to see. I don’t like how they push the crude into the close. They’ve done the same with Europe markets today.
I’m already in. So, I’ll see if I add or not at the end of the day
I want to see below 2082 to feel good about this and then much lower before end of day.
That’s SPX 2082.
I suspect ES is headed for 2050 … the fifth of the first wave to go. Then we’ll bounce on Sunday before going into the third. All of these waves are still part of the larger first wave, folks.
I will be surprised if they go so low today.
I expect them to keep market floating until the end of the session and fall after through Monday
OK, good. We can scratch SPX 2082 off our list. I needed ES to break to a new low so that it can finish this wave down over the weekend and we’ll likely bounce back up here on Monday, which would be a second wave. Otherwise, we create a gap above a 62% retrace. So we did well. The probability is high that the top is in.
Thanks, Peter,
great job.
today’s 2094 (es) is ojn the cardinal of the sq. of 9. Also today is the anniversary of the october high in 2007. So,……..maybe……..
But people are only human and they need a trigger to do something, so where is the trigger ? …….. 🙂
Short term gravity is up into the weekend, supported by last square Tuesday. Lunar declination is also up into 10/31. Not strong enough to push up the market, but enough to keep it from crashing. This weekend everything should changes.
Crashes Always happen after the weekend when people have time to think things over.
Besides; last day of the month. Next week will be different.
André
Can’t disagree. We seem to be on hold in equities. Also NYSE is so close to 62%, has traced out a triangle, but hasn’t been able to follow through on a final 5th wave up. I would expect at least a test of the previous spike top there at 10,536.43.
OK, André …haha.
Let’s see how good you are. I think this is the top right now. I need you to give me a projected time this afternoon for your top.
Well, congrats, you nailed it. Even though you didn’t provide the hour and minutes, I’ll still give it you ….. lol. Good job! 🙂
It’s a zombie rally. It seems appropriate.
This wave up in SPX, whether or not it creates a double top or goes slightly above, should be in 5 waves.
Final push up toward 2106 ( ES ) started …hopefully will reach that level today .
AZ
AZ,
Where are you getting 2106 from? Depending on how you measure ES, I can get a possible 2100 or 2111, but not that number.
Peter
That was my target from my last week post by using Andrew’s Fork if you remember . Price could go higher few points from 2106 and reach your level but not more than that . All stops below 2106 are short lived , at least this is what I think.
AZ
AZ,
I don’t know anything about Andrew’s fork. I will read up on it over the weekend. Thanks!
Peter
Do you think the TOP might be in , and my target will be wrong
Regards
AZ
AZ,
If we drop below SPX 2082, yup.
THANKS
Well done Peter you were right …
Regards
AZ
haha … a dead guy named Mr. Elliott was right.
Last minute selling was impressive
The wave structure puts us about midway through the first of the first wave down.
hi Peter
food for thought ,
with this year being a somewhat inverted crash year
my thinking is this . Nov 7 is the seasonal date where we typically see a rally in to Jan 16 . since we have already rallied maybe we see the opposite of the norm ( it fits what has already been going on)
Nov 7 high to a Jan 16 low ? it’s possible .
I’m not the big bear like many here mind you just pointing out my thoughts .I’d say we test the high at 18351 on the Dow but we won’t make a new high ,maybe just 18100 or so then back down to complete a bullish pattern or chop sideways in a larger pattern as yet to be determined
then run much higher .
that said the Nov 7 high to Jan 16 low still fits
I promised I would explain where my 10/26 came from. This is a Gann timing technique.
Dow jones made a high 4/12/2000 at 11425,45. From this price we calculate the square root : 106.9. Adding this to 4/12/2000 gives 7/27/2000; our first date. Next step is to take the square root from 106,9, add 1 and resquare. This gives 128,6. Adding to 4/12/2000 gives 8/18/2000. Our second date! This last step (square root, add 1, resquare) is eay to implement in a spreadsheet and can be repeated into eternity.
As adding 1 stands for 180 degrees in the square of nine, every second step represents a full circle. In the 66th step you get 10/26.
This technique also works great on S&P. As the square root of a small number gives a smaller result than from a large number, DJ timing is better suited for long term cycles and S&P for shorter cycles. Doing this calculation on the S&P 20/5 high we get 10/30 as a date.
And this alone – I can give other reasons- explains the markets behavior last week. DJ2000 gave a major cit, but S&P wanted 10/30. They both were active, bringing a consolidating market. But it confirms 10/30 was the top.
Two major Gann rules must be accepted : 1) price=time and time = price, 2) the square of nine is not proof of what the market did, it is the cause. The square of nine represents the law of vibration.
I hope this is clear and that you can do your own analysis now.
For now : 10/23 was the formal high. But the market was caught between two strong dates. This is over now and we can prepare for a decline into 12/12 before we get some retrace – santa rally- into Christmas.
Cheers,
André
André,
It strikes me that the mathematical relationship you cite (square root, add 1, resquare) is very similar to the relationship between consecutive fibonacci numbers. I’ll have to pull out my fib book and see what the difference is. Can’t remember off-hand? Do you know?
Peter,
The relationship between consecutive fibo numbers is always 1,618, as far as I know. 987/610 = 377/233. In the square of nine I don’t see that relationship. But I have analysed Gann much more than Elliot. So I really can’t say for certain.
Yes, but there are lots of mathematical relationships within the number sequence involving squares. It has nothing to do with Elliott. It’s the manipulation of the raw fib numbers themselves. I find it fascinating that Gann and Fibonacci have those kinds of similar relationships. You can Google fibonacci numbers and find a list of mathematical “tricks” you can do with them. I have a whole book (or two or three) on it.
Here it is, I guess: “The product of two alternating Fibonacci numbers is 1 more or less than the square of the Fibonacci number between them.” So there are relationship similarities perhaps between Gann and the Fibonacci sequence. And maybe Lucas numbers. I’ll have to play around with this when I get some time.
I have a low of Dec 7 as my cycles date.
Peter,
I had noticed the confluence in your cycle timing and my 12/12. I can assure you I have different sources, so the confirmation is remarkable.
My date is purely an analysis of historical cycles in SPY. I had Oct 13 as a top in this cycle, so we’ll see if that lag relationship holds for the bottom.
André,
What I find really eerie is the possible alignment with the 1929 stock market crash. If you take a look at the second chart on this page, you can see timing. The pattern should end up being the same. http://projectsmrj.pbworks.com/w/page/45618748/Stock%20Market%20Crash%201929-%20Quiana
Peter,
Gann said we had to study the past as history will repeat. If this will be like 1929 I can’t say, but it is always usefull to have a look at it. McHugh sees a repetition of 2007. Either way; things could get interesting. For now I keep my target on spring 2018. When we get closer there is time enough for adjustments.
My whole site, of course, is based on the history rhymes principle. In EW, a bear market always unfolds in a similar manner. We thought 2007/8 was the big drop, but central banks launched the credit bubble at the bottom. Now, they’re simply out of ammunition, so I expect a drop similar to 1929. I think it starts now, but I don’t know if this is the big drop or a smaller one before it. My sense is that we’re starting the big drop. You just have to look at GDOW, which is now poised for a huge third wave down. It’s the elephant in the room, along with NYSE.
IMHO, 2018 is the final bottom. That too, would fit the 1929 repeat scenario.
Peter,
Are you saying that right now (10/30/15) we are in alignment with the far LEFT side of the PINK shaded area? Then the low should be at the far RIGHT of the PINK shaded area (where green starts) on December 7, 2015?
thx…
http://projectsmrj.pbworks.com/w/page/45618748/Stock%20Market%20Crash%201929-%20Quiana
Well, yes. It’s becoming more and more obvious to me as I look through charts (I’ll spend tomorrow morning putting together a post on this), that if this is the big drop, the timing appears freakingly similar to 1929 and present chart dynamics seem to support the idea.
So, if we look at the DOW, and we’re going into a third wave, 2.618 times the first wave takes us to 10,400, which is the exact start of the previous final fifth wave up, which is the appropriate place for the wave to stop.
For a few reasons, this bear drop should be a countertrend move (as in 1929, as humans are basically optimistic—which means the market will always, through human presence on Earth, go up). It will be a wave in 3 down. Now waves in 3 are always really waves in 5, except that one countertrend move is much larger and so the entire thing “looks” like a 3, as in 1929 – the perfect example.
So, we should have a third wave down now (a vertical drop) and then a big retrace in wave 4, finishing up with the final wave down, which will likely stair-step until it hits somewhere around the previous 4th wave of one lesser degree, which was in 1974 at under DOW $1K.
In terms of the timing, I always thought it would be much longer, but I’m starting to come around to the idea that the timing may be similar, due to the fact that all central banks have done is to make the problem that much larger, so it will adjust faster.
You just have to look at the count on GDOW so see where we’re going. We’re clearly headed into a third wave, which will be at least 1.618 times the first wave, and in these situations, it is more likely to be 2.618 times the length of the first wave.
We’ll have a good idea where we stand as this wave starts to come down, re speed and whether it’s motive or corrective. I’ll let you mull that over for a while … haha. Quite a scenario, but not entirely unexpected. It’s the timing I’m wrestling with, not the wave structure, or the eventual outcome.
We certainly agree on 2018. As described above 10/26 was a major date. Armstrong’s ecm gives 10/7; pretty close. 250 times PI bings us to the end of 2017 so that should be the first possibillity for a major low. But spring 2018 (April-June) is what my systems says.
Will the big drop come in 2015? I don’t know. The feds may do one more QE to postpone the inevitable. or go the negative interest rates. But down we will go. For now I’ll say : at least into 2018. If it doesn;t stop there it may be 2020 before the low is in. There is so much debt in the world; it’s hard to imagine they can fix that in 2 years.
We’ll see. 2018 at least!
The QE, if it happens, will take place at the next bottom. It always does. It can’t happen in the middle of a third wave. Well, it will be an interesting balance of the year.
Peter, This has been a tough few months, but i must say you handled this in a very
professional way ,so nice to be with your group,and the cooperation with Andre and
the rest of us , is terrific. Thank you so much, and all others also.
🙂 Thanks, Nick. I think we may just be getting started …
Awesome duo P + A! 🙂 Thanks for the info guys, let’s make it rain (RED RED RED) now. ^^
@André, I will see tomorrow if I can get the Gann dates you are getting. 😉 I have done the math for price levels (worked), but didn’t know how to do it for time. 🙂
Cheers,
W
This fits perfectly with that big spike down (smart money exit?) at the close on Friday!
Absolute perfect timing !!
http://www.zerohedge.com/news/2015-10-31/fed-admits-somethings-going-here-we-maybe-dont-understand
“In a somewhat shocking admission of its own un-omnipotence, or perhaps more of a C.Y.A. moment for the inevitable mean-reversion to reality, Reuters reports that San Francisco Fed President John Williams said Friday that low neutral interest rates are a warning sign of possible changes in the U.S. economy that the central bank does not fully understand. With Japan having been there for decades, and the rest of the developed world there for 6 years…”
More at link ~~~
Gary,
And then there’s the admission by Draghi …
http://www.zerohedge.com/news/2015-10-31/mario-draghi-admits-global-qe-has-failed-slowdown-probably-not-temporary
After some more research I need to adjust my timing. No worries; down into 12/12 is still valid. Only now I would like to add that 1/22/16 is a very powerful date and will act as a magnet. So the first real retrace won’t come before that.
Cheers,
André
The alternative is that we will retrace into this date before we go down again. Either way; this 1/22/16 is a MAJOR date and will do something; you can count on that. Down into 12/12 is certain.
André,
That fits the scenario I’m looking at. I suspect 12/12 is the bottom of of the third wave and 1/22 the bottom of the fifth. Then we bounce for several months.
Best guess now : May 12-22, 2016 for the bounce.
May 18th moon at apogee; likely date for a top
Peter,
you told “trade what you see, not what you think”.
So, does it matter to think about the dates two month in advance?
Dmitri,
Great question! Let me see if I can explain this properly (keep in mind, this is just my opinion).
First off, we haven’t even done a first wave down yet. And then we need a second wave up to 62% to confirm the trend has changed. That’s part of the “trade what you see” part. The market has to show me where it’s going before anything else happens.
It was like dealing with the fourth wave we had on Oct 26/27. I thought it was the start of a move down much further but then there was a point on the 27th with overlapping waves that it became apparent we were going back up to the top. That takes precedence over anything else you might have in mind.
That being said, the bigger picture is that we appear to have done one motive wave down from May 20 and a huge corrective wave up reminiscent of 1929 and 2007. If that’s the case and we prove it by the unfolding wave structure, then I want to be able to take maximum advantage of it.
So … to some extent I agree that it’s early to talk about the date for the bottom (it will be much more important in a couple of weeks), but it’s good to have those dates on the table, as it helps me think about where we’re likely going.
There are some that think we’re going down into a C wave. Both a third and a C wave have to go to new lows (lower than Aug 24). The structure of the wave down should confirm relatively early on which one of those scenarios is going to play out (GDOW says it will be wave 3, so my preference is in that direction). Once we have confirmation, then the dates start to become more important.
Talking about May dates—well, I agree it’s too early for that. I’m more focused on December.
Does this answer your question?
For completeness : the January low must come between 1/22 and 2/2. The full moon, +/- 3 days is 1/24.
I am really beginning to think this whole global debt thing is infinitely more serious than anyone is willing to acknowledge on an MSM broadcast. ANY increase in interest rates would create a debt burden (aside from the original principal) that generations could never repay. We often hear the term “Global Reset”. I believe this may actually happen some time soon. What will the reset entail?
http://www.zerohedge.com/news/2015-11-01/20-trillion-government-bonds-yield-under-1-stunning-facts-how-we-got-there
It’s going to be a total collapse of the international financial system, a social revolution, coupled with a worldwide pandemic, wars, and all the other lovely elements that happen in tandem over and over again with regularity every 172 years.