
… the Farther They’ll Fall
Update, Tuesday, Oct 27: We seem to be waiting for the FOMC meeting and subsequent announcement (at noon on Wednesday). I suspect we’ll have similar action to the September 17 announcement. It should mark the top of this second wave.
So far today, the SP500 has come down in 3 overlapping waves to complete a fourth wave. It’s clearly corrective. That means we need to head back to the most recent top.
Over the next 24 hours, I suspect we’ll see a small, fifth of fifth of fifth wave up to an eventual top in both the cash indices and futures. From there, we should head down into a third wave. The chart of the SP500 from Saturday remains valid.
_____________________________
Update: Oct 24, Saturday
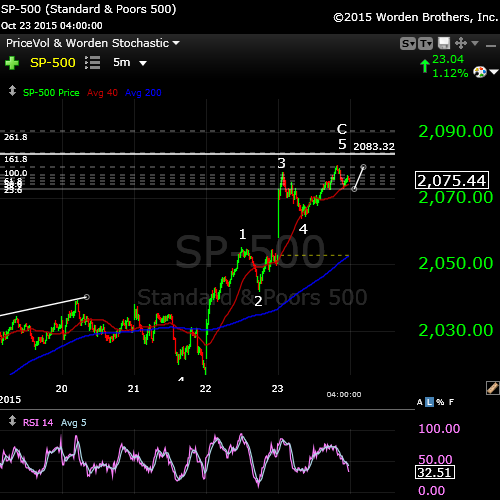
Above is the breakdown of the final wave today of the SP500. This is a 5 minute chart, so it’s only showing the final 5th of the 5th of the C wave. I’ve updated labelling based on the waves on Friday and it’s now clear that the wave 1 on the chart (on the ECB announcement on Thursday morning, Oct 23) is much longer than the ensuing waves. It should be the opposite, of course. So the waves appear to be getting shorter and shorter.
Wave 3 on the chart should be 1.6 times the length of wave 1, but it’s actually shorter than wave 1. That’s very bearish. We’re struggling.
2083 is the projection if the fifth wave is 1.618 X the length of the first wave of the fifth (the usual length), but based on the wavelengths so far, it’s likely we won’t make it that far.
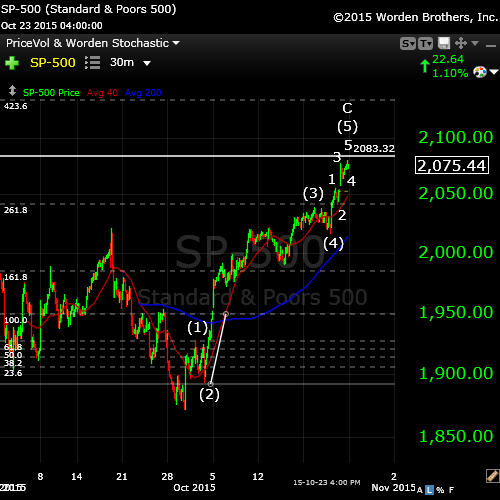
Backing out the chart of the SP500 to show the entire 5th wave of C (3o minute chart), you can see how the 5th of the 5th is getting much shorter than it should be. Based on the length of wave (1), wave (5) should extend 1.6 times the length of it. That would give a top of 2116. But the 5th of 5th is only 1 times the length and coming to an end.
Note that wave (3) is 2.618 X the length of wave (1), which is a proper ratio. So it’s the final 5th of fifth that’s struggling, and each wave within it is getting shorter, as the top chart shows.
One more really interesting chart for today, from a cycles perspective:
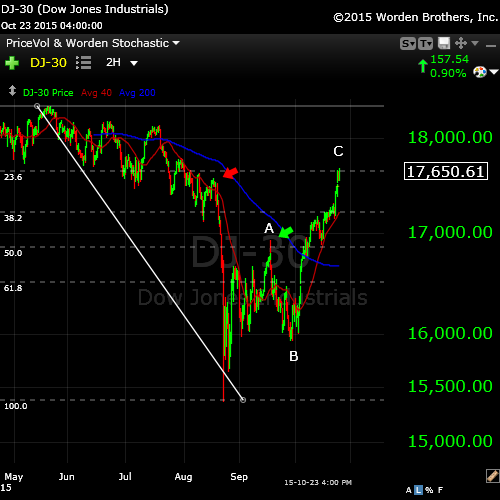
Above is a 2 hour chart of the Dow. Notice the top on August 18 just before the big drop (red arrow). Now notice the Sept 17 spike top (FED announcement and the turn down). That was 30 days after Aug. 18. Now we’re at Oct 25. We are exactly 31
Here are a couple of other great candidates for shorts.
One more kind of interesting chart of the DOW (from a cycles perspective):

The chart above is of the DOW (2 hour chart). I’ve marked a spike on August 10 just before the start of the big drop. I count that point as the start of the fifth wave of the first down (red arrow). It was 37 days later that we saw the top of the September 17 spike (green arrow). It is now exactly 37 days to where we are now at C.
___________________
Update ALERT: Friday, Oct 23, before the bell
Be on the alert for an opening gap reversal this morning. That’s when the futures have risen overnight and as a result, the cash indices open and immediately reverse to the downside.
We had a big rise in future overnight and the setup is such that there’s a high possibility this is the top and will quickly reverse. I now count 5 full waves up in the fifth of fifth wave of C and it looks like we’ve gone up high enough that the NYSE and GDOW may have hit the 62% mark (won’t know until the open, of course). This is the perfect setup for a reversal, so we’ll see what happens.
The safest way to enter is to look for 5 waves down and then 3 waves up to 62% and if we top here, I’ll be on the lookout for that and put an alert in the comments.
_______________________
Original Post – Thursday, Oct 22
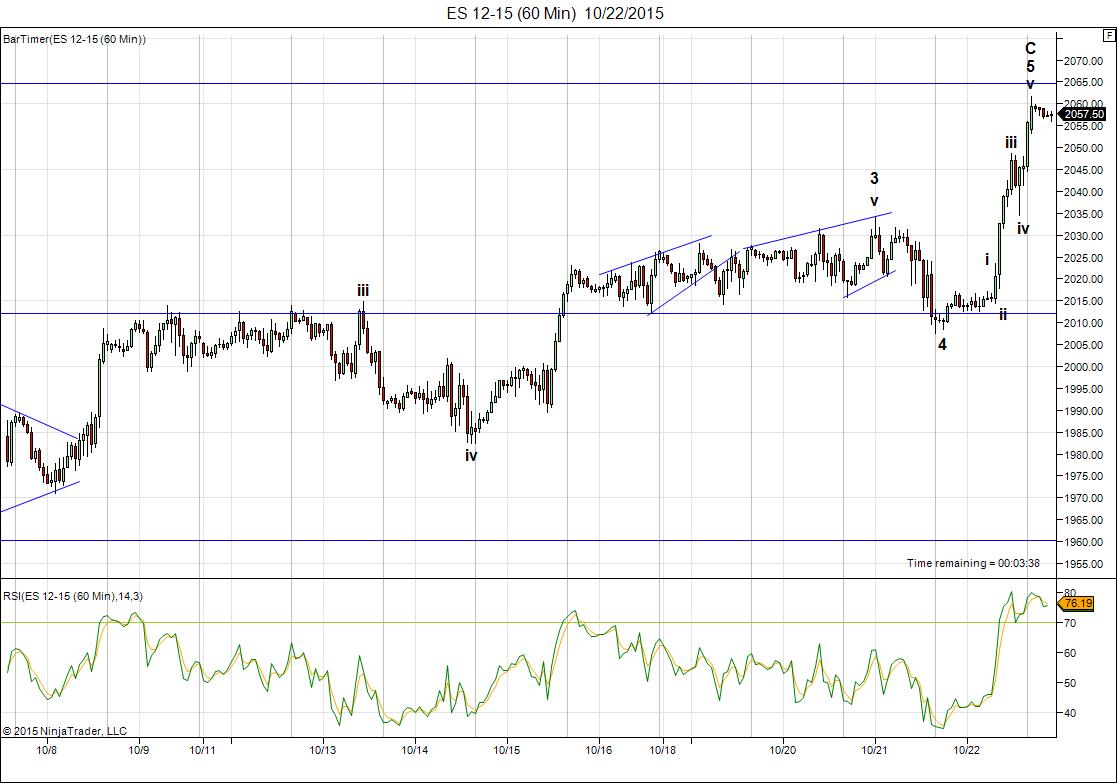
Above is the chart of ES (SPX futures) with a full ending diagonal marked from Tuesday of this week. On Tuesday night, we made a new high, which changed the structure of the diagonal and in fact, the next day, a final leg failed and we headed down.
I was out on Wednesday evening and did not get a chance to do a full analysis of the market. If I had, it would have been apparent that we had a wave 4 staring us in the face with overlapping waves down. I’d thought we were looking at a 5th wave top, but in fact, it was only the top of the third wave. I have relabelled the chart, as a result.
We’ve rolled into the fifth and final wave up rather quickly today and it’s almost at an end. You can click on the chart to expand it for a better look.
___________________________
In today’s post, I’ll look at all the indices and how they’re all in a similar position.
Bottom line: We have a pending top in place. I expect a turn down imminently. All the indices are now above the 62% retracement level, except for the NYSE and GDOW, which are both very close.
Wave 2 or 4? There is a question as to whether the very large correction we’ve been experiencing since August 24 is wave 2 or 4. Because the NYSE all the indices are above the 62% level (except for two), I’m switching back to calling this wave “wave 2,” which means a very much bigger drop to come than we would have had with wave 4. Also this wave is just too long in terms of time for me to consider that it’s wave 4.
As we approach the top of this correction, I often get asked where the best place to enter is. Here is a brief explanation of what to expect and the safest point at which to enter a short trade after a first wave down.
Let’s get on to the cash indices:
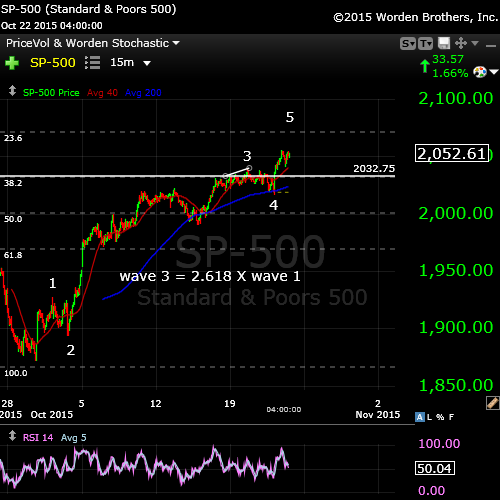
The 15 minute chart of the SP500 (above) shows a breakdown of the C wave with 5 waves up, almost at an end. Futures tonight have risen quite a bit, so we’ll need to see the open in the morning to figure out where we are and whether we’ve completed our five waves up.
I’ve placed the 62% retrace line (from the market top) on the chart. This is the target I’ve been suggesting we would eventually test. On Friday, we slightly exceeded it.
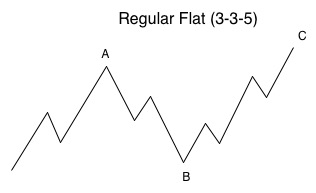
Here’s the explanation of the correction we’ve formed on almost all the indices: a regular flat.
 Currently in the SP500, wave 3 is 1.6 times the length of wave 1. In the final 5th wave, wave iii is 1.6 times wave 1. If wave v traces out the typical full length (1.6 x wave i), it would top at 2052. Based upon what ES did on Friday (an ending diagonal), I find it less likely that wave 5 will extend to its full length.
Any flat correction is in a 3-3-5 pattern. This final wave C has now traced out a complete, or almost complete set of 5 waves. Five waves up marks the end of a sequence and demands a trend change.
In a regular flat correction, “wave B terminates about at the end or about at the level of the beginning of wave A, and wave C terminates a slight bit past the end of wave A.” If we complete a flat that goes to a slight new high, then this would have to be a larger 2nd wave and the downside will be much greater than a 5th wave. For example, the third wave alone would take us down to the low 1600s in the SPX. We would have a 5th wave after that.
___________________________
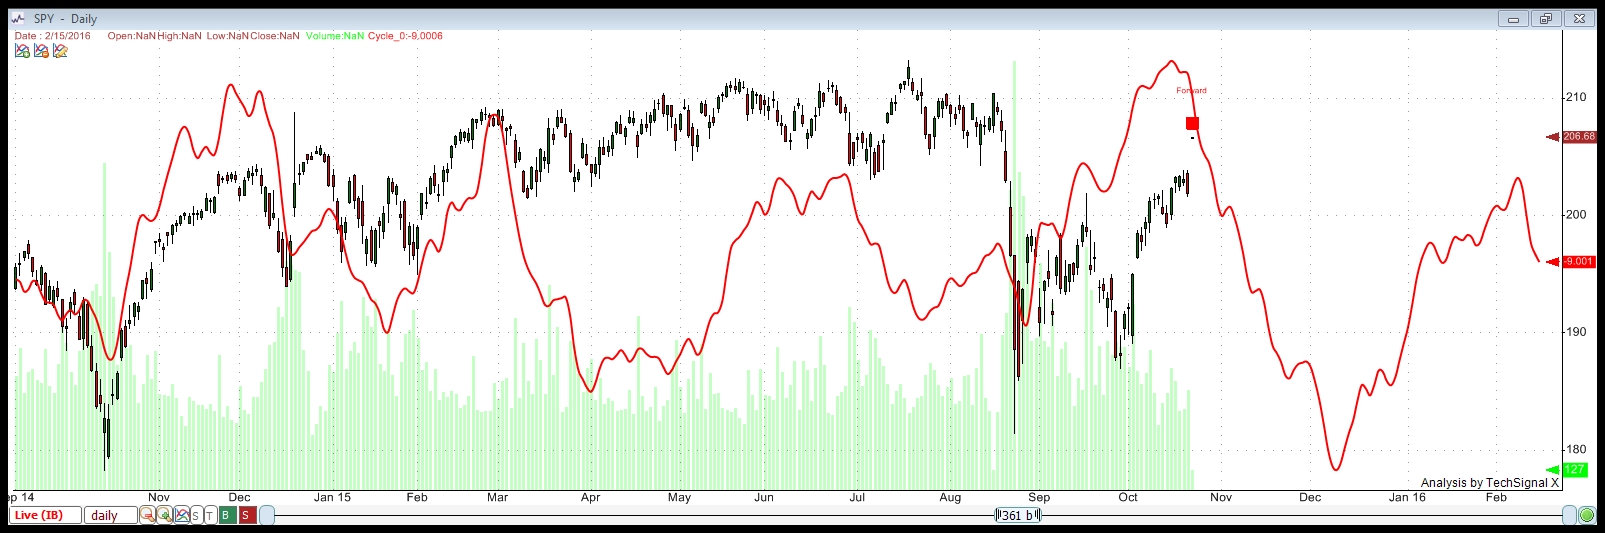
Let’s look at the bigger picture to get a sense of where we’re possibly going longer term.
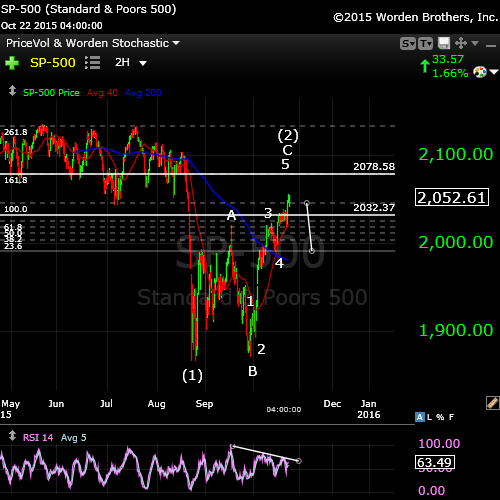
Above is a 2 hour chart of the SP500. I’ve overlain a fibonacci retracement tool to give an indication of our target if this 5th wave traces out its full length (which it often does not do at the tail end of a correction). The full length of the fifth wave is typically 1.618 X the length of the first wave. This would give a top of about 2078. However, it’s more likely it will end before that figure.
The lower horizontal line marks the 62% retracement level.
** On all the charts, I’ve included the RSI reading and in some, provided a line showing the divergence.
Once we’ve seen the first wave down, it should give us an idea of the magnitude of the balance of the descending waves.
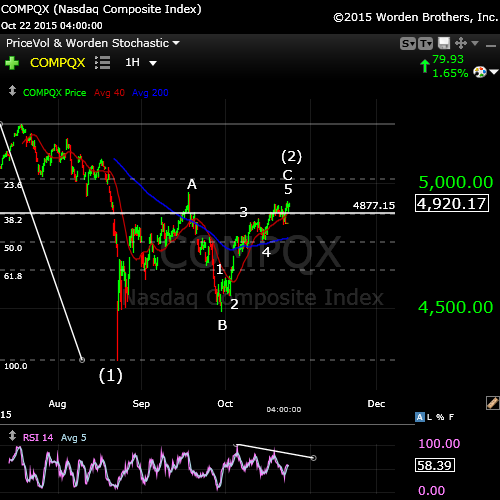
The Nasdaq now looks the same as the other indices. This final leg up reached the 62% retrace line (the horizontal line) on Friday and slightly exceeded it. We’ve almost traced out a complete set of 5 waves up, and tonight, futures rose substantially and may have surpassed the previous spike high at A.
As a regular diagonal, the C wave should exceed the top of the A wave.
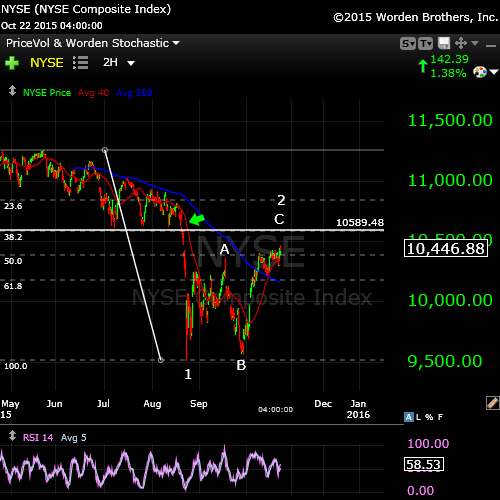
The NYSE (above) has not met the 62% retracement level (horizontal line). This is the index that’s lagging all the rest and I would expect it would make the 62% line before turning down.
I’ve also marked a small gap that exists just about the 62% retrace line, but I don’t know that it will get filled.
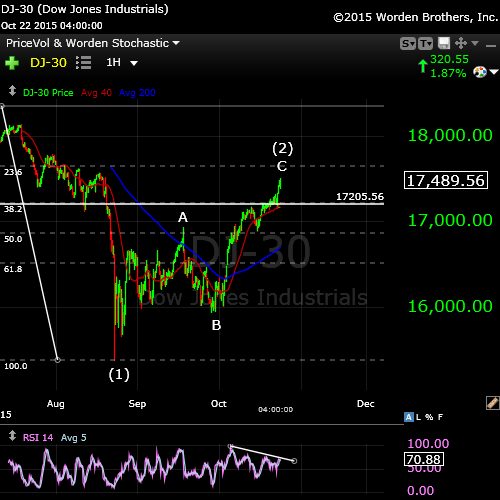
The DOW (above) tagged the 62% level exactly on Friday afternoon and is now well above it.
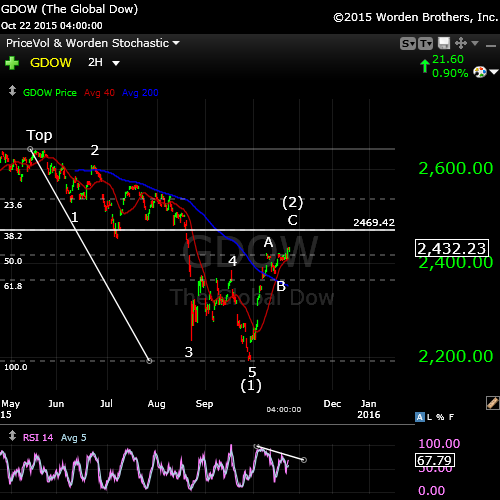
The Global DOW (GDOW) has retraced up to to almost the 62% level (horizontal line) but is still short. This is the only other index (besides the NYSE) that has not reached the wave 2 expected target of 62%.
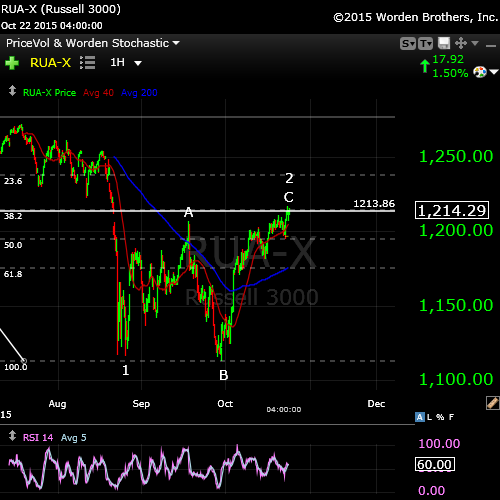
The Russell 3000 (RUA) on Friday had not quite reached the 62% retrace level, but it’s there now. It’s a slightly different pattern than the other indices in that it’s done an ABC correction to a new low (the B wave hit a new low, and was also in 3 waves down). This C was is in 5 waves up, which is an ending wave, of course. So this index lines up with all the others above.
_________________________
Cycles Analysis
I ran this chart tonight, Thursday, Oct 22 after the market close. Not much has changed from the cycles analysis from a week ago. You can click on it to expand.
This cycles analysis uses Techsignal X from the Foundation for the Study of Cycles. I’m using data going back to 2002 this analysis of SPY (SPX) and displaying a compilation of all the cycles the software has found over that period. You can see how close-fitting it has been in the recent past. The fit with the current wave is quite stunning and therefore, something to pay attention to.
This analysis suggests a cycle top of October 13 (starting down on the 14). Oct 13 was also the new moon.
It shows a bottom to this set of waves down at December 7, 2015.
This particular cycle top (Oct 13) is a strong one. I’ve gone a little deeper into what the analysis is telling me on a separate page. Here’s a more in-depth explanation of what this chart is suggesting.
_______________________________
The Panic Phase and the TPD (Turning Point Distribution) Principle
The TPD Principle describes a period in time of several weeks in which an array of cycles congregate, including gravitational, geomagnetic, and nuclear. It’s around this time that markets have historically topped. I was asked to include a reference to this in today’s blog post, which I’m happy to do. This principle generally refers to market tops (which we’ve already seen on May 20, 2015), but it’s interesting to note how many astro events we have occurring over the weeks surrounding the upcoming major turn in the market.
In his book, “the Universal Cycle Theory,” Stephen Puetz writes, “The TPD principle involves the eclipse cycle as well. The eclipse cycle normally peaks on the first new moon before a solar eclipse. Following that reversal point, it takes six weeks for sentiment to shift from euphoria to panic. Then on the first full moon after a solar eclipse, a panic-phase begins. A panic phase usually last two weeks—ending at the time of the next new moon.”
The dates:
Aug 14 , 2015 – First New Moon before the Eclipse (there is a New Moon happening at the same time as an Eclipse—Sept. 13)
***Aug 29 – Full Moon before the Solar Eclipse (peak of the eclipse cycle)
Sept 13, 2015 – New Moon and Partial Solar Eclipse
Sept 23, 2015 – Fall Equinox
***Sept 28, 2015 – Super Blood Moon Eclipse (start of panic phase)
***Oct 13, 2015 – New Moon (this would mark the end of the panic phase) – six weeks after the Aug. 29 full moon.
So … there’s a lot happening in the area of cycles right around now.


Dear Peter,
thank you for your relentless update.
I am sure you will be proven right and when that day comes ( very soon), you will have proven your credibility.
Along with it ,many followers /subscribes will come and I will be one of them too.
One thing for sure, all excess will be normalized in due time and always revert back to mean , the higher it is ,the more it will undershoot before reverting back to mean.
Patience always pay but have to ensure to stay liquid longer than the market behaving irrational.My 2cents.
Vince
Vince,
You’re welcome. Good thoughts everyone needs to keep in mind. Patience is the key.
Hi Peter
I see your wave labels for wave ( 1 ) down on the gdow which I have mixed thoughts of yet I don’t see any labels for the other indices ,just a simple 1 at the low . the reason I bring this up as a question has to do with whether this is a wave 2 or a wave 4 .? I would think that the fact the wave count is being questioned implies we only have a 3 wave decline and it is now looking like the initial wave I is being tested. I can’t tell if it’s been touched just yet though it is sure looking close .
would an overlap of the initial wave I negate a wave 4 labeling ?
at what point eoukd would price negate a wave 2 labeling ?
Joe
If wave 4 goes into wave 1, it gets negated. Wave 2 is negated at a new market high.
Peter,
I wanted also to ask you :
The fact that we are finishing the big 2nd now means that all the previous decline from the very top was the big 1st wave. It should be in 5 waves. You’ve subdivided it only in 3 waves at your charts up to now.
So, how the current big wave might be motive if its 1st wave down is in 3 ?
The first wave marked now was all bunched up at the top. And then it came straight down. If you look at my typical first wave down, you’ll see that’s the basic configuration. The 5th wave is always the longest.
That wave down was hard to decipher at the top, but once it got going, there were clearly five waves within what we thought was the third. Motive waves are always five wave fractals, so it was really the top part of the wave that was the issue. It was simply mis-read as it’s a really difficult configuration to analyse.
I’ve been looking at it for a long time wondering which one it was – could have been either. It’s only after you get 5 full waves down a high degree that you set the new trend.
3 waves down so far …
We might have 5 down now.
We are already higher than the open in cash
Sorry, that’s in futures.
Futures have a 62% retrace. We’ll see if it turns.
Futures not looking bullish. GDOW very close to the target.
Looks motive this 1st down in cash
It’s so bullish that it will be a miracle to make the reversal today
What about NYSE and GDOW ?
I see
I have delayed charts on both. NYSE only about 70 points shy.
Want to get below 2062 in ES.
We need really to break it down.
But it’s DOW 17.600 that they fight on
Futures all at new lows. A good start. SPX also coming down.
If we break down here we should be in the3rd of the 1st
I mean in cash
A drop through 2053 ES will be a good sign.
How do you find the structure of the wave?
I like GDOW. These a small waves so it’s a little early to say. As long as they keep stair-stepping down, I’m OK.
Even GDOW and NYSE are down in 3 waves now, so I don’t like nuttin!
It would be nice to have a double top and one wave down before the end of the session so we have Sunday to climb up into a second wave.
The Nasdaq is in the area of wave 1 so that knocks out the Wave 4 theory. It’s wave 2.
My ‘panic square of nine’ gave 10/21 as cardinal date. The rule is that when the cardinal date doesn’t bring the CIT the diagonal (= midpoint) will. This gives 10/25.
Mastertiming on the 2009 low gives 10/25. This is a very significant date.
Natal we see Mars conjunct Mars 10/25.
And Venus will be max west 10/26. So this is a very strong cluster of dates that the market needs to test. Crashes Always come after the weekend when people relax and start to realize what is happening.
This weekend that long anticipated black swan should finally arrive. So keep your eyes open.
Cheers,
André
Man man man, I hope you will be so right André since my P XNL NOV 390 don’t like this AEX at 463 points!!! I stepped in on Oct 9th around 440… Seriously, what a crazy stockmarket!!!
I still see this crash coming, but why can’t I be just a little more patience!!! GRRRRRRRRRRRRRRRRRRRRRRRRRRRRRRR!
Thanks again Peet/André, awesome analysis!
Cheers,
W
Relax,
10/24 mars/mercury conjunct
10/25 HC SR Mars change in sign (Leo)
10/26 HC t-square mercury j/saturn
10/25 sun declination 90 degrees
10/24 moon crosses 135 degrees
10/24 tidal change in trend.
The trend is down into 2018. This is a huge retracement. The market needed to test this weekend. Next week will be down. Confluence of everything I see ion 10/24-26. Soon, very soon W3 down.
Hope you realize how significant this is. Mars and Mercury both change sign as they become conjunct. This is rare. And at the same moment they translate the JS square by a conjunction with Jupiter. This is the most significant JS activation all year. And on Saturday they trine the galactic center. This means the Galactic center also energizes the JS square. And on Saturday we also see Mercury trine Earth. So Earth, Galactic center, Mars, Mercury, Jupiter and Saturn are all connected this weekend. Must be the most special configuration this year and another reason the market needs to test this date. Mars, Saturn and Galactic center should release a lot of energy. And on the same time we are headed for a full moon close to Perigee. And 10/24 is a Mercury shadow date. Every single aspect is capable of bringing change. The combination could be explosive and all we need to trigger some panic.
I really expect some weird news this weekend that main stream analysts will use to explain the ´sudden´ decline.
Andre,
I don’t know what should happen to stop this exuberance.
The market buys everything: bad news or good news.
Dimitri,
I gave you all the reasons why the market should go up. And the same reasons explain why it should come down next week. This weekend is pivotal. Now up is down next week. That happens with tops.
André!
I will realize how significant it is when it shows up next week. 😉 For now, I have faith in your, but some percentages decline would really show it! 😉
Cheers,
W
Patricia is the weekend, supposedly the biggest hurricane in history.
To put one or two things in perspective : I have several timing systems and one of them gives 2 dates a year. So these are very important. The last date was 5/24. This gave the 5/20-21 high. For a 6 month cycle 2 or 3 days off is acceptable. The next date is 10/21. So this date is of the same magnitude as 5/24. So this is very significant. The market started to rally on 10/21, so clearly they felt the power of this date. Allow a few days either side and we once again hit this weekend.
In 2014 this system gave 8/3 and 12/29. Both dates started a significant Multi week move. The 10/15/14 low was the exact midpoint in this cycle.
You won’t read about this cycle anywhere else as it is mine. So don’t expect other analysts to confirm this. But supports Peter’s analysis that W3 is around the corner. Bob McHugh says the same. Everybody is waiting for the trigger. I think I just gave that.
I can tell you’re excited! Thanks for all this, André!
So, the target SPX 2078 is hit.
What now?
2106 !
Why 2007 ?
Sorry, why 2106 ?
Dimitri
I am unable post my chart here , but it is very simple instructions to follow
Place Andrew’s Pitchfork ( A ) on 24 August low , ( B ) on 17 Sept High , ( C ) on 29 Sept low . I use SPX … 4 Hrs
add 61.8 % ration and it shows where we stopped now at 2080 , that is a very important level … which might hold and be our TOP, if failed then next stop 78.6 % which is around 2106 price.
Hope all clear
Regards
AZ
You want a blow-off. This is excellent! In fact, we’ll watch for an opening gap reversal this morning. We’ll see if NYSE is at 62% this morning at the open.
We turn down. That should bring those stragglers up to 62%, I think.
Should the cash go to top at the same level as the futures?
It is crash to the upside.
200 up in SPX since three weeks
Is this the classic rally back to the declining 200 day moving average? This rally certainly makes one feel bullish.
Which is a good thing!
Exactly, when the market really gets to my emotions, it is usually a turning pt to the opposite of what I feel.
I added a short update alert at the top of the post.
Well Peter,
If you are right and Stan Harley with picking this day as a possible top just as he did for Sept 17.
Then we have to see a big decline from this point.
The bradley was spot on till Sept 30 after that it made an inversion but today or monday there is a reversal point …
I am surprised that after three hours the DOW keeps rallying back to +100.
Slow death? Or being resilient in the face of really strong gains this week?
I think the signal is that we haven’t quite topped. This wave came down 38% of the previous wave up, which usually means a fourth wave. We might just need to test the top. I can see 5 waves up in NQ and now the DOW, and some double bottoms, so I would be cautious.
There’s an SPX gap at 2079.94 (and a few above that). Hopefully they don’t all have to fill. It just rejected that gap.
It will likely make that one. I count one more small wave up. This is a fourth wave down right now. If full length the
SP top would be 2083. My focus is on whether NYSE really needs to make 62%, which is still 70 points away. GDOW is 10 points away, which may be good enough. I measure the top of this wave for NYSE at 10554, which is about 30 points away.
So, no top today, by the looks of it, but futures should be able to make the remaining small gap over the weekend.
I have a weird feeling tptb want to hit spy 210 next week. Maybe mutual fund Monday kicks in.
By my measurement Liz, if this small fifth of the fifth of the fifth is full length (1.618 X 1) SPY should go to 208.50. All the waves are still coming in at just the right length, so I’m assuming this wave will be, too.
When I measure right from the bottom (around 187), I get the same result.
Thank you Peter. I am waiting to see if SPY 208 will print during regular trading hours.
Still 3 waves down, so we at least have to test the previous top.
SP500 waves are also getting shorter. The most recent first wave up was longer than the third, which at the moment is longer than the fifth. That’s a bearish sign. I’ll add a labelled chart to the post this weekend.
We might not make it to that number I gave you. We’re really struggling now. I would think we have to turn over Monday. No guarantee of course, but the turn feels imminent.
Peter,
Do you remember that I asked you a question a while ago this market looks like 2007
and we make a slightly new high with negative divergence is that still not possible what is the difference between now and 2007?
I don’t know what happened in 2007, but nothing has changed here with the wave count.
Any thoughts before the market close. I’m short.
Thanks
I just posted what I thought the top is for SP500, based on measurements (2083). Other than that, nothing has changed. We’re waiting on NYSE and GDOW, I think.
Sorry, I see the above, didn’t refresh.
In the DOW waves are starting to get shorter, they’re not making their full lengths. So that to me is a signal that we’re very close. But nothing will happen on the short side on the weekend.
I just posted a chart of the SP500 wave we’re dealing with right now so that you can see how the lengths of the waves are getting progressively shorter.
Thanks for all the work. Next week should be interesting.
All the Gann techniques I use – no matter the index or the period – point to a turnwindow 10/23-10/27. And this happens a few day from the notorious 10/21 panic date.
Never seen something like this before.
Gravity confirms as we are headed for a full moon close to perigee. Electricity confirms as we cross the 135 degree in the lunation cycle.
The markets bounces like a pinball between these gann dates. 10/21 a low is 10/26 a high. The core of the turn is this weekend so it has to be either Friday 10/23 or Monday 10/26. Can’t see it any other way.
I have been looking at S&P, DJ, NYSE (dollar) and Dax (euro) to test timing. As they usually give different dates I was looking for the best index. What strikes me now is that all indices seem to finally synchronize now. All the indices I mentioned give 10/24, 10/25.
So it seems that when my long term system gives a major turn (10/21), all major indices synchronize. So this should happen every 6 month or so. This is a new insight for me. Also long term (2000,2007,2009) and short term (Sept/Oct/May/July/August) converge.
These are special days we are seeing now.
Cheers,
André
Andre and Peter,
Thanks for all the effort to complete this puzzle.
I have been reading the work of Stan Harley over again and also looked at the bradley.
The bradley is still on the move higher but is making a turn this weekend.
What I think is we will see a pullback this week and afterwards an other try for higher prices, just like the topping proces by the end of July 2011 in to August.
The bradley goes straight down around Nov 5-6 and bottoms en Nov or Dec 7 .
This analysis is inline with Stan Harley a top around Okt 23 and Nov 5.
Great to see all the confirmation! Thanks for all your work putting this together. It’s amazing how all these cycles (I put them all under the umbrella of cycles, even EW, planetary, the works) point to the same day and how we have virtually no control over what we do on Earth on a grand scale … but let’s not get too far off topic … haha.
It’s posts like yours (and others here) that show the power of the forces of nature.
For the past three years, I’ve been watching the markets slowly get in sync: Prechter’s “All the same market” theory. Yes, everything now moves based on debt and deleveraging. The dollar and euro have been in sync with the US markets for over a year. I’ve been commenting often about the inverse relationship of the eur.usd to the US indices. It’s moving inversely in lock-step.
Back to the equity markets. They’re at a classic EW top:
I will summarize a lot of this in a mini-post on the weekend, as the charts haven’t changed all that much from my last post. Get ready for next week, everyone.
Last post today to blow your minds. I created a square of nine, starting on the major 2000 high, using the lunar synodic cycle (29,5305 days). 45 degrees in this square gives the period 10/18 – 11/17. The first square in this period gives 10/25.
The weekly square of nine on the 2009 low gives 10/26-27 on 45 degrees.
See? There is no escaping from this time frame, how weird your analysis may be.
Cheers,
André
Over on John Hampton’s site he often showed pictures and talked about ” the last chance rally ” This very well could be that ” last chance rally” . I will take comments on that!..
Be nice….nick
Top Talk haha…
https://www.youtube.com/watch?v=MMdHPDJgHrY
haha … my answer to that: https://worldcyclesinstitute.com/top-of-the-second/
Another way to calculate a crashwindow is to take 6 weeks before and after the solar eclipse (9/13). You do the math and discover what makes this weekend so very special.
Is anyone focused on the labeling or timing on the 10yr Treasury? https://research.stlouisfed.org/fred2/series/GS10
Paul,
Not specifically for me. However, 30 year is headed up, so is 20 year. The ten year chart looks like 3 waves down and has turned, but I see three waves up so far. It may have to do a double bottom.
No new post this weekend. There’s very little to add. I’ve updated two charts of the SP500 at the top and provided a link to a couple of other great shorts. It’s clear the final wave has come to an end.
Tomorrow Bradley Siderograph crosses 0 Line which is usually responsible for strong trend changes. More than often this changes the trend stronger than some official turn dates. Last time it was October 1st 2015 when SPX startet the 100 points rally until the next Bradley Date on October 9. The next time Bradley Siderograph crosses the 0 Line is on the 16th November. This strongly indicates a trend change to down as of tomorrow. I am not sure if the next 16th November will be an important intermidate low or a lower high as of today. I am very much excited to see how things develop the next few weeks.
A successfull trading week to all. Jaze
The third wave down will be deep and sharp. Then, because we had a sharp, long 2nd wave, the rule of alternation, says we’ll have a long but not sharp 4th wave. The 4th wave should be at least the length of time as the second wave. Then a final sharp 5th wave down. The second wave was 2 months in length almost exactly. So this places the start of the 5th wave into the new year.
The rule of alternation applies to corrective waves. It the second wave is sharp, the 4th wave will be sideways and vice versa.
I’ll post about all this once I see the turn down.
Hi Jaze,
Could you please tell me where you could see “Bradley Siderograph crosses 0 Line” at http://bradleysiderograph.com/2015-turn-dates-sp500/ ? Thanks.
Hey Goldbug2009,
I can’t see it on your link. But please have a good look on my link below.
http://time-price-research-astrofin.blogspot.ch/2014/11/geocentric-and-heliocentric-bradley.html
Best your trading,
Jaze
As mentioned last week, I see a pivitol low this week for the Oct 29th. The major correction to occur on the 28th. I am in a 1/2 position short at this time, which I may add to a full position Monday depending on how the markets react. If we do see a major correction, I will be selling half position at the 1950 level where we have a gap to close at. If we fall straight thru the 1950 level I will add on back on my other half short from selling at the 1950 level.For now, I am assuming we will not have a major correction. Hopefully we do have a major crash. I will be swing trading between certain pivitol points in the market. We are going to be entering a very positive seasonal period. All years ending in 5s have been positive years. Remember,it is very dangerous to see a whole blog being Bearish or Bullish, I just want to be a voice of reason with this resent market action.
Prosperous trading to all.
Dave,
I welcome other opinions and I am sure everybody does. And I think we all have a voice of reason. Disagreement is not the same as being unreasonable. Please keep voicing your mind; we can all learn from that.
André
Thank you Andre’ It really feels like the CALM BEFORE THE STORM. The different blogs and tweets I use to receive, is very eerily quiet. I have not seen this for a very long time.
Perhaps, the full moon is keeping the markets in check in combination with the FOMC meetings.
I still maintain, that late Oct 27 th into the (28th especially), will be the major down move in the markets. How much, that remains to be seen. Good luck to all.
Strong confirmation for me will be under the previous 4th at 2063 SPX. Then the larger 4th at 2017.
Good Morning Peter!
Is it too early to recalculate this chart?
thanks…
https://worldcyclesinstitute.com/wave-5-textbook-projection/
Good morning. Yes, I’d like to confirm the top first. These things take a while to do.
Thanks! We actually posted at the same time!
So, the first thing you are looking for is a drop (and stay below?) SPX 2063?
Yes and then the lower number. If we’ve topped, we have a long way down to go. This not motive so far, so I want to see more.
Not motive in futures, that is. Not looking too bad in cash.
Well … I see triangles forming just about everywhere and there’s a Fed meeting Tuesday/Wednesday. It’s hard for me to believe that we’re going to stay up here until then, but stranger things have happened. If that’s the case, then the Fed is truly in charge of the herd for a little while longer.
Triangles are the final pattern before a top.
My refresh doesn’t bring up any new posts, so maybe everyone is holding their breath. Was it a top? Are we about to get some fireworks?
http://www.reuters.com/article/2015/10/26/us-southchinasea-usa-idUSKCN0SK2AC20151026
Paul,
We’re all just waiting. The Fed meeting might be the trigger. The full moon is tomorrow. In any case, depending on whether they plan a skirmish, nobody may have the money for the ammo.
http://www.zerohedge.com/news/2015-10-26/us-stock-market-breadth-collapsing-again
Not much holding this baby up.
Last time when FED made his statement was September 17th and we made the high at 2020 and S&P 500 fell to a low of 1871 in 8 trading days or about 7.3% !
Plus Astro-wise, early this week, we have the “George Bayer Rule” of Mercury crossing the same path the sun did during a prior eclipse. The last time we saw this, the SPX fell 236 point in 4 trading days (late August 2015). We also have Mars joining in this time with Mercury which indicate a sentiment trend change.
So as in the past prior to FED meetings the market was holding up and then the sell off came. Best, Jaze
Jaze,
What prior eclipse would that be?
Cheers,
André
I found an error in my long term timing system. The 10/21 I gave before should have been 10/26. Now the confluence is much stronger. This supports the case that we are only days away from a significant CIT.
From an EW perspective, we need to see a new and final high here and then we should head down. My guess is we’ll see another Sept 17 scenario. A small spike and turn. I’m looking at Wednesday at noon EST.
My suggested short of the other day (APPL and BLK) has both turned down. APPL at least may have to test the top of this most recent wave down before turning down further. Currencies appear to be at inflection points.
We have penetrated SPX 2063 for the second time this morning. Is that still significant right now? The penetration of the previous 4th.
Gary,
I’m not going to be very near the market today mostly because we’re not going anywhere substantial until the Fed meeting, or reaching a new high, whichever comes first. So no, I wouldn’t expect moving into the area of the previous fourth to be very significant, other than it sets up for the final wave up.
could this ES move from 2074.50 to 2053.75 be already iii of the first subdivision of a Wave 1?
Whitemare,
ES can go wherever it likes, but it’s in a corrective wave. All the waves down within it are overlapping. That’s not motive. We need one more high. I’m not in front of the market, so I don’t know the specifics to the prices you quote.
The cash indices were all in corrective waves this morning. The only one that was questionable last time I looked was NYSE, which has done a double top and may have done a first wave down.
I think the FED tomorrow is no-event. Hilsentath has already told there is nothing to wait.
But AAPL tonight and crude oil inventories may be the last straw on the back of the camel.
If the crude breaks the support it is currently on the energy sector will plunge. US shell oil sector has tens of billions of credits to be rolled over next weeks.
Hilsenrath, sorry
Andre’
If you could possibly elaborate on your timing in regards to Oct 26 2015 and more so on your 2018 date I’d love to hear more about how you calculated it .is there a month in 2018 your focused on ? Or is it just the year 2018 at this point ?
Thanks
Joe
Joe,
This weekend I’ll show how you can do this analysis yourself. Regarding 2018 my focus is on the month of April.
My two cents!
The SPX (-12) and the NASDAQ (-25) both have the DOW down over 100. Yet the DOW is showing down 50. Peter had mentioned SPX 2063 as being a sign that we may be on the way down for violating the previous 4th. We tested 2063 twice and then broke below it. We are at 2059 right now.
I think the focus amongst the “smart money” is on the debt limit. This talk of blowing it off for two years isn’t sitting well. The Obama’s and their ilk don’t want to be bothered with the negativity of the debt limit coming up again and again leading up to the election.
Right now the market should be doing the typical choppy small range trading like it did yesterday. It always does that leading up to “FEDSPEAK”. I think we may be headed to the August lows now. It might surprise everyone and not be too impulsive to the downside. Except maybe for III of 3.
I had an indication at 11:05 EDT that we may make a run to the highs at ES 2075. Or just chop around 2064. Instead we have reversed to the downside.
The remainder of the week should be really interesting!
Gary,
The only significance SPX 2063 has is that it is close to the previous fourth. It’s a start, but the structure of the wave is more important. If SPX breaches 2055.19, then I’ll get more interested. Putting all the indices in one basket, I don’t see a compelling reason to think we’ve topped.
Timewise… 97 days from the May 19th top to the Aug 24 bottom. And a 0.618 retracement bounce of exactly 60 days into a Oct 23 top… at least that is what I’ve been expecting. The action will be similar to 2000-2001… expect a sharper drop closer to 35% in 2016, fwiw.
Gold will be where the action is in 2016, contrary to the expectations of the “Cash is King” horde, the US Dollar will get smoked. Anyone with a correct understanding of the fundamentals would agree imo.
Joel, great to hear from you again.
Thanks Dave… not sure if my view point fits in here…. the stock market certainly resembles 2000-2001 with sharp 1-2 month drops being met by strong 1-2 month rebounds. The Dollar Index has a 20-day cycle and rebounded from its Oct 15 low…
Since 2010, it has been setting a multi-month low in the second half of October… either way, when the stock market rolls over in earnest by January 2016, the dollar will follow it… this is when gold will shine. Some gold stocks have already doubled and tripled from the Sep lows fwiw.
Hi. Joel. I always appreciate your insights on the markets. I unfortunately I have not a very good feel when it comes to currencies.. I was hoping to buy some gold stocks after the markets have had a significant correction. I would assume the gold stocks would be part of the down draft as the market corrects. Correct me Joel, if you think differentely . We have a very positive 5 day period coming up, that have been very consistent over the years. Thursday thru middle of next week.
I am short for the moment thru Thursday, planning on going long some time Thursday thru next week . I will re assess their after.
Joel, if the US dollar is coming down as you suggest, where is the investors to park their money? The Euro, yuan, rubble Cd. Europe is one heck of a mess, both socially and economically. On slaught of the mass immigration is creating havoc all thru Europe as Martin Armstrong has communicated.
“… if the US dollar is coming down as you suggest, where is the investors to park their money?”
Dave, a review of history reveals that Gold usually bottoms before the dollar tops… so if my $1070 July 2015 target is the bottom (as projected several years ago in my private fb group), then it would not be unusual for Gold to head higher before the dollar tops. I have Gold possibly hitting the 0.618 retracement level ($1217.84) from the 2015 top to July bottom in the next week or two.
Unless we get a significant pull back into Thursday morning, I will be going back long no later than Thursday morning. Tomorrow morning into Thursday is my own cycle date for some kind of low.We are about to enter the five best days of the year to go long, from thursday into next week. I will certainly be very disappointed if we do not get a 60 – 80 sp points drop into Thursday morning. I am just waiting for a retrace upwards in the markets today to buy UVXY to have a full position short. Good luck to all.
I added a short update to the top of the post.
I’m putting together a new post this morning, based on where we are this morning. Just really an up-to-date summary. Will take an hour or so.
New post as at now: https://worldcyclesinstitute.com/a-little-yellen-and-a-lot-of-cryin/